Global rankings, comparisons, and country datasets — updated snapshots for 2025–2026
Manufacturing Industries Spend the Most on Raw Materials

U.S. Manufacturing Industries Ranked by Materials-to-Shipments Ratio (2024)

U.S. manufacturing · 2026 snapshot of 2024 data U.S. Manufacturing Industries Ranked by Materials-to-Shipments Ratio (2024) Petroleum and coal products had the highest materials-to-shipments ratio among U.S.


U.S. Banks Where Loan Growth Is Outpacing Deposit Growth

U.S. Banks Where Loan Growth Outpaced Deposit

U.S. Banking | Q2 2026 | Loan and Deposit Growth Which

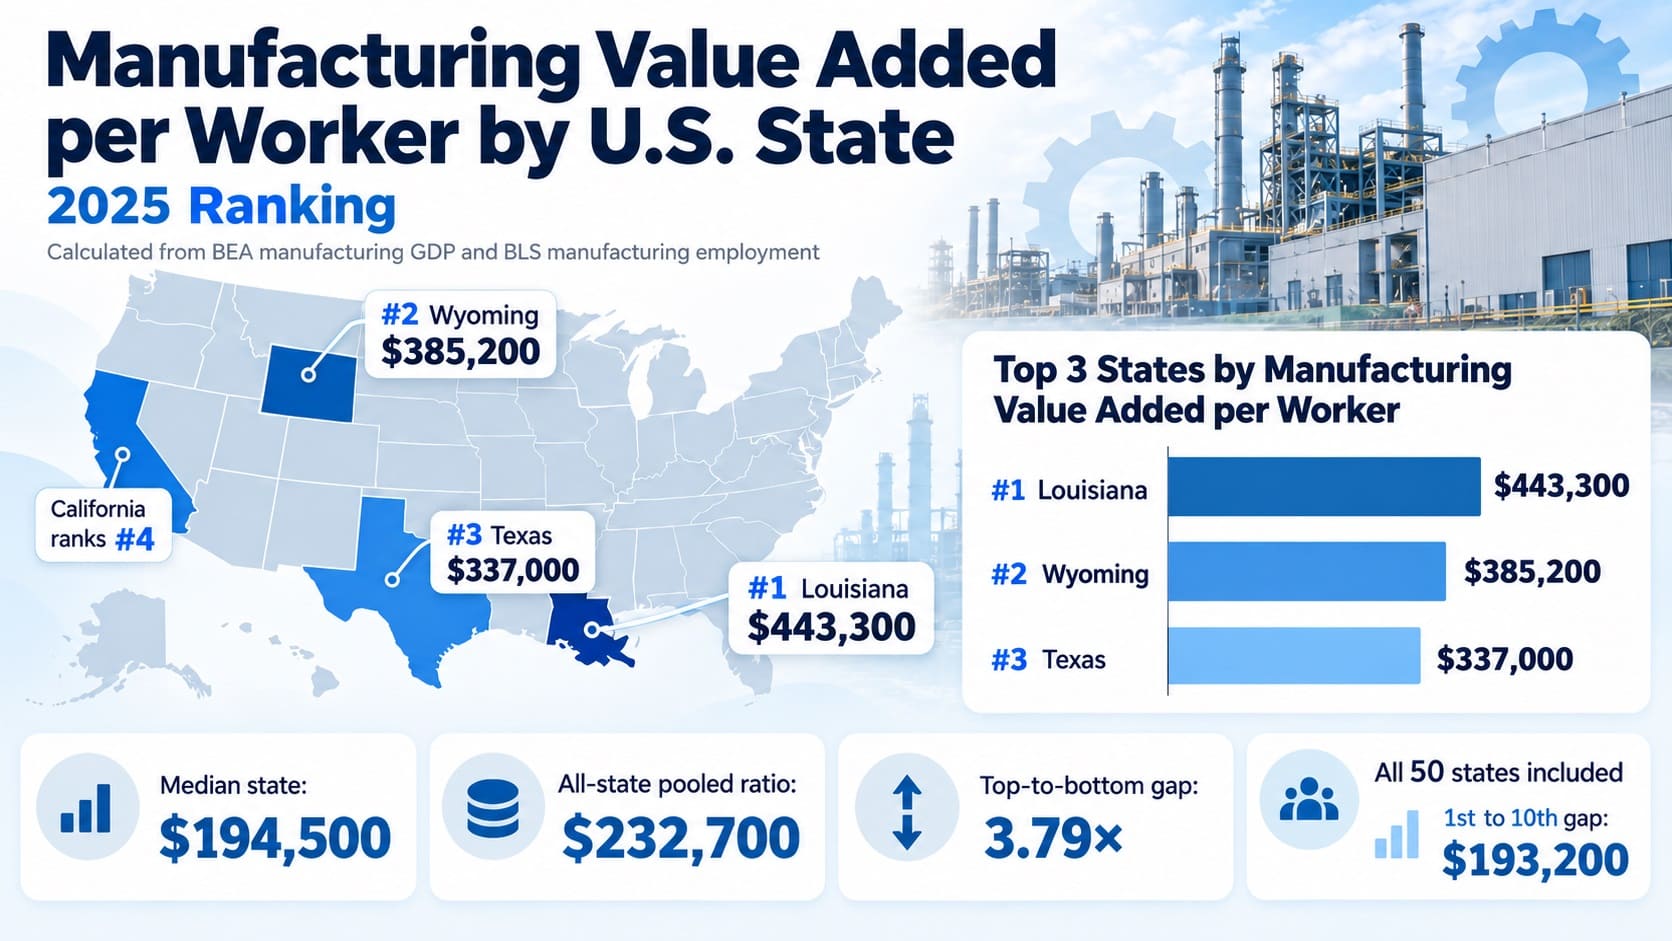
Manufacturing Value Added per Worker by U.S. State

U.S. Counties Losing Bank Branches Despite Rising

StatRanker · Original Research 245 U.S. counties had fewer bank branches

Manufacturing Value Added per Worker by U.S. State

Manufacturing Value Added per Worker by U.S.

U.S. manufacturing · 2025 observed data · 2026 snapshot Manufacturing Value

Renewable Electricity Share by U.S. State

Renewable Electricity Share by U.S. State: 2025

Energy / Economy · Final 2025 EIA observations Which U.S. States

Census Building Permits Survey

Building Permits per 1,000 Residents by U.S.

U.S. housing permits · Final 2025 data · Checked October 29,

Most Visited U.S. National Parks

Most Visited U.S. National Parks in 2025:

U.S. geography and environment / NPS official visitor-use statistics National Park

Most Expensive of 100 Busiest U.S. Airports

Most Expensive of the 100 Busiest U.S.

U.S. aviation · Full year 2025 · BTS 2025 Average Domestic

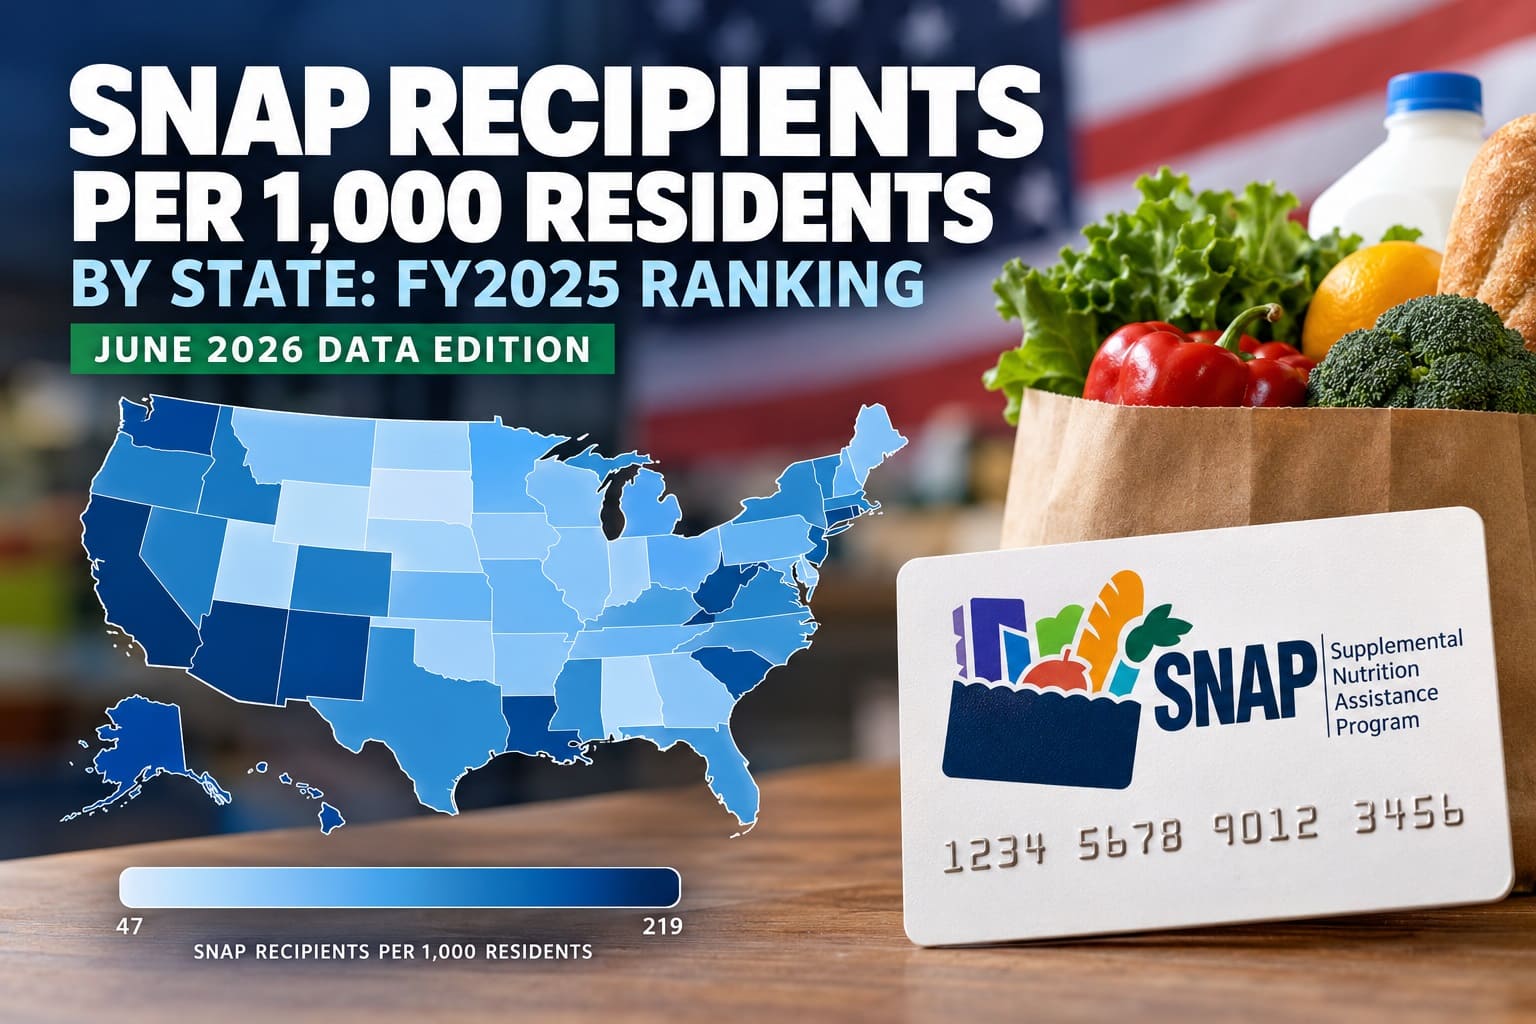
SNAP Recipients by State FY2025

SNAP Recipients per 1,000 Residents by State:

SNAP · FY2025 · June 18, 2026 source edition FY2025 SNAP

StatRanker: Global Rankings Based on Official Data

How we rank (quick methodology)

StatRanker rankings are built from public datasets and standardized for cross-country comparison. Each ranking page includes sources, notes, and update timestamps.

  • Sources

    IMF, World Bank, WHO, UN, IEA (and other official datasets depending on the indicator).

  • Normalization & units

    Values are converted into a single comparable unit (e.g., per capita, PPP, USD/kWh) and clearly labeled.

  • Update cadence

    Rankings are refreshed when new releases become available; each page shows “Updated:” and the reference year.

  • Limitations

    Coverage varies by indicator; missing data, revisions, and methodological differences can affect comparability.

Global Migration Trends

Global Migration Trends: Top Destinations and Source Countries in 2025

Review global migration destinations and origin countries using UN DESA International Migrant Stock 2024 data in a 2025 snapshot.

Impact of Climate Change on Migration: The Rise of Climate Refugees

Impact of Climate Change on Migration: The Rise of Climate Refugees

See how climate-related disasters drive migration and displacement, with a 2024 ranking of countries most affected by disaster-linked internal movements.

Internal Migration in China and India: Urbanization and Economic Impacts

Internal migration in China and India is still one of the biggest

Compare the latest evidence on internal migration in China and India and how mobility is reshaping cities, labor markets and