

Top 50 Inflation Rate by Country 2026: IMF Annual-Average CPI Forecast
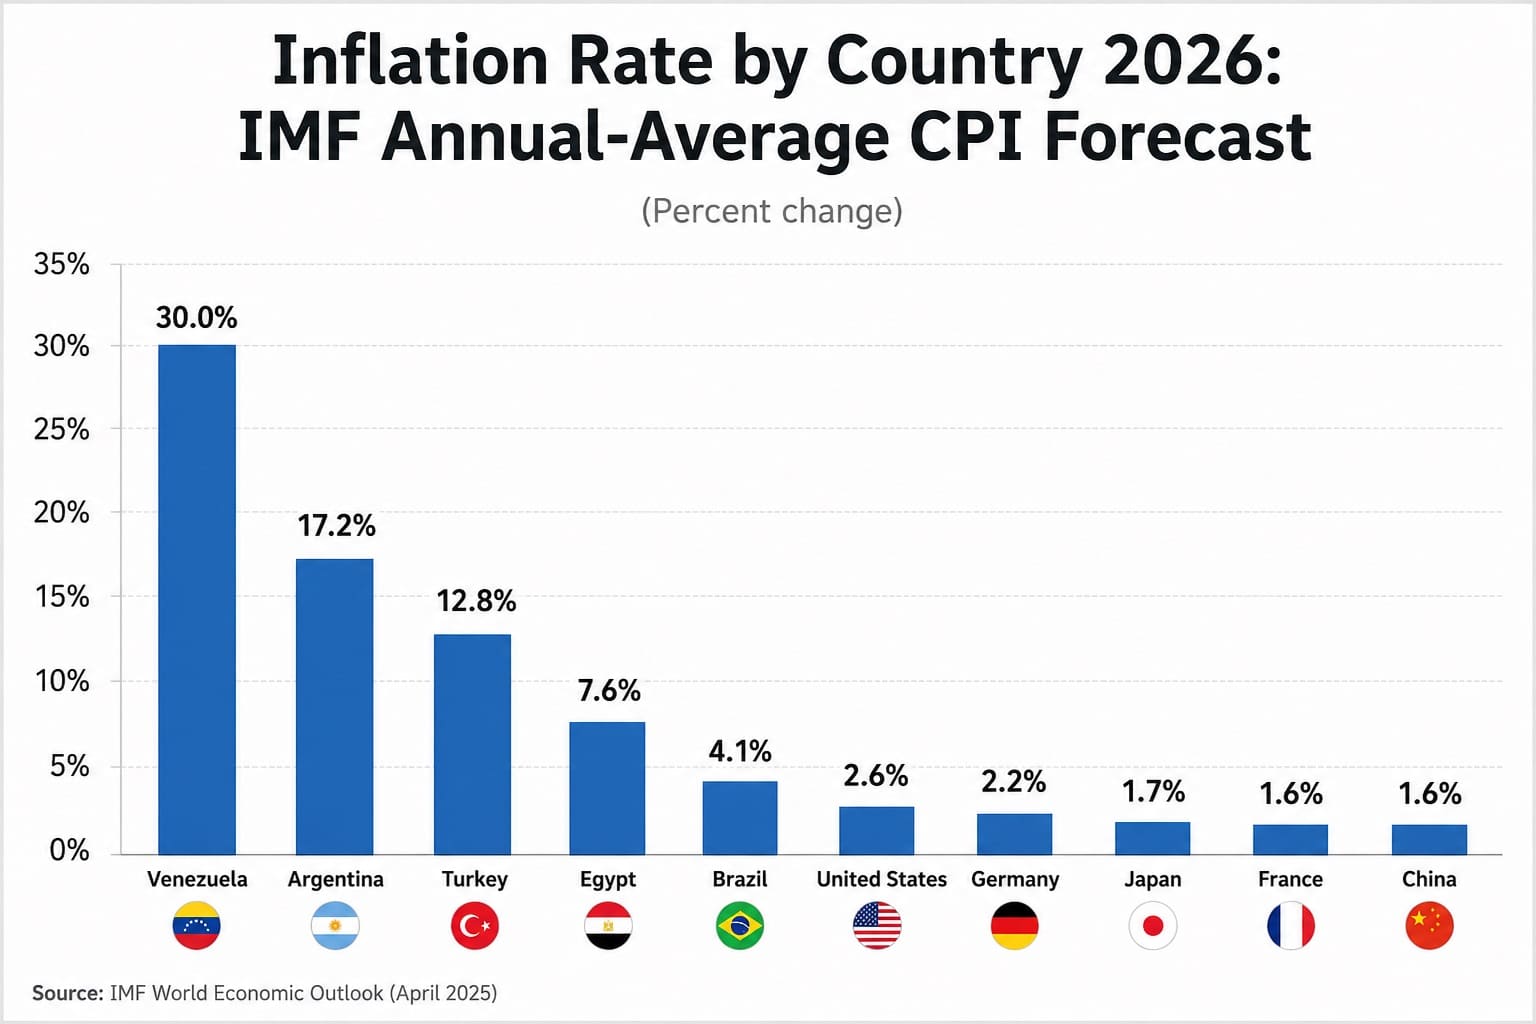
Which countries have the highest projected inflation in 2026?
Venezuela leads the Top 50 inflation rate by country 2026 ranking, followed by Sudan and Iran. The comparison uses the IMF World Economic Outlook measure “inflation rate, average consumer prices,” expressed as the annual percent change in the average consumer price index.
This 2026 inflation forecast by country is based on the IMF WEO database released on April 14, 2026. The forecast exercise uses information available through April 1, 2026. The table publishes the 50 highest projections among 191 WEO economies with a numeric 2026 value.
Every ranked row is an IMF staff projection, not an observed full-year result and not a projection created by this page. Higher projected inflation ranks higher; a higher rank does not mean stronger performance.
Continue exploring
More StatRanker pages connected by topic, category or ranking theme.
Inflation Rate by Country: IMF 2025 Estimates and Latest WEO Observations
Open rankingTop Countries with the Largest Food CPI Overheating in 2025
Open rankingTop 100 Countries by Inflation Rate (Consumer Prices), Latest Year
Open rankingVenezuela is first in the IMF staff projections for 2026.
Costa Rica is the lowest of the 191 numeric 2026 entries.
Half of the 191 numeric projections are at or below this value.
Six WEO economies have no numeric 2026 value for this series.
All 50 rows are IMF staff projections; the cutoff is 5.2%.
Annual-average CPI inflation is not year-end inflation
The IMF indicator PCPIPCH compares the average consumer price index during 2026 with the average CPI during 2025. It therefore reflects price movements across the entire year. End-of-period inflation instead compares price levels at specific endpoints, so the two measures can differ materially.
The ranking measures the projected pace of price change, not the absolute cost of a basket. A country can have relatively low inflation but high price levels, or high inflation from a lower starting price level. The indicator also does not directly measure wages, household purchasing power, exchange rates or the distribution of inflation across different households.
How to read the table: treat every value as one IMF forecast-vintage comparison. The projections are internally comparable within the April 2026 WEO, but later data and policy changes can lead to revisions.
Dataset audit and coverage
The coverage audit was calculated directly from the official IMF DataMapper Excel export for PCPIPCH. The denominator follows the 197-economy statistical basis stated in the April 2026 WEO appendix.
WEO economies
Economies with observations in the inflation series and included in the WEO statistical basis.
Numeric 2026 projections
Economies with a number in the 2026 PCPIPCH column and eligible for ranking.
Missing 2026 values
Afghanistan, Eritrea, Lebanon, Sri Lanka, Syria, and West Bank and Gaza.
Aggregates excluded
Regional, income, institutional and analytical group rows are not treated as countries.
The export also contains 41 country or territory profile labels with no observations anywhere in this series. They are outside the 197-economy WEO statistical basis and are not included in the denominator. The published Top 50 represents 26.2% of the 191 numeric country and economy projections.
Top 10 countries with the highest IMF inflation projections
The top ten range from 387.4% in Venezuela to 19.0% in Myanmar. Nine entries exceed 20%, showing that the upper end is concentrated in a small set of exceptionally high projections.
Top 10 countries and economies by IMF 2026 annual-average CPI projection
| Global rank | Country / economy | 2026 projection | WEO group / note |
|---|---|---|---|
| 1 | Venezuela | 387.4% | Latin America and the Caribbean; IMF staff projection; April 2026 WEO. |
| 2 | Sudan | 75.1% | Middle East and Central Asia; IMF staff projection; April 2026 WEO. |
| 3 | Iran | 68.9% | Middle East and Central Asia; IMF staff projection; April 2026 WEO. |
| 4 | Argentina | 30.4% | Latin America and the Caribbean; IMF staff projection; April 2026 WEO. |
| 5 | Türkiye, Republic of | 28.6% | Emerging and Developing Europe; IMF staff projection; April 2026 WEO. |
| 6 | Yemen | 26.5% | Middle East and Central Asia; IMF staff projection; April 2026 WEO. |
| 7 | Malawi | 24.4% | Sub-Saharan Africa; IMF staff projection; April 2026 WEO. |
| 8 | Haiti | 23.5% | Latin America and the Caribbean; IMF staff projection; April 2026 WEO. |
| 9 | Bolivia | 20.7% | Latin America and the Caribbean; IMF staff projection; April 2026 WEO. |
| 10 | Myanmar | 19.0% | Emerging and Developing Asia; IMF staff projection; April 2026 WEO. |
The values match the one-decimal precision in the official IMF export. Equal values are ordered alphabetically for a stable display; no ties occur in the Top 10.
Chart: Top 20 projected inflation rates
One common scale would make most bars unreadable because Venezuela is an extreme outlier. The chart therefore uses two clearly labelled panels: ranks 1–3 share one scale, while ranks 4–20 share a second scale. Compare bar lengths only within the same panel; exact values are printed for every entry.
Extreme range: ranks 1–3
Panel maximum: Venezuela at 387.4%.
Comparison range: ranks 4–20
Panel maximum: Argentina at 30.4%.
Methodology
The metric is IMF WEO indicator PCPIPCH, “Inflation rate, average consumer prices,” in annual percent change. The ranking sorts the numeric 2026 values from highest to lowest. It uses the April 2026 WEO database only; national forecasts and commercial datasets are not averaged with the IMF series.
Forecast status
The 2026 values are IMF staff projections published in an official IMF database. They are not final observed rates and are not official forecasts issued by national governments.
Forecast process
WEO projections are prepared through a bottom-up process led by IMF country teams and coordinated with global assumptions and cross-country consistency checks.
Official regional groups
The filter uses the six WEO groups: Advanced Economies; Emerging and Developing Asia; Emerging and Developing Europe; Latin America and the Caribbean; Middle East and Central Asia; and Sub-Saharan Africa.
Missing values and exclusions
Six WEO economies without a numeric 2026 value are excluded. Regional and analytical aggregates are excluded because the ranking unit is a country or economy.
Ranking and ties
Higher projected inflation ranks higher. Ranking uses the published one-decimal value. Equal values receive a stable alphabetical order without implying a meaningful difference.
Revision risk
The April database reflects information available through April 1, 2026. Later releases, policy changes and shocks can alter the projection in a subsequent WEO vintage.
The conceptual calculation is the percentage change from the average CPI level in 2025 to the average CPI level in 2026. The page does not reconstruct CPI index levels or apply a separate growth formula.
Limitations: CPI baskets, weights and statistical capacity differ across economies. Annual-average inflation does not show monthly momentum, year-end inflation, core inflation, household-specific exposure, absolute price levels, real wages or forecast uncertainty bands.
Main ranking: Top 50 inflation rates by country in 2026
Search and filter the Top 50 published entries. The “First 10 matches” and “First 20 matches” options are applied after search and WEO-group filtering, so they show the first matching rows in the selected sort order rather than the global Top 10 or Top 20.
Top 50 countries and economies by IMF 2026 annual-average CPI projection
| Global rank | Country / economy | 2026 projection | WEO group / note |
|---|---|---|---|
| 1 | Venezuela | 387.4% | Latin America and the Caribbean; IMF staff projection; April 2026 WEO. |
| 2 | Sudan | 75.1% | Middle East and Central Asia; IMF staff projection; April 2026 WEO. |
| 3 | Iran | 68.9% | Middle East and Central Asia; IMF staff projection; April 2026 WEO. |
| 4 | Argentina | 30.4% | Latin America and the Caribbean; IMF staff projection; April 2026 WEO. |
| 5 | Türkiye, Republic of | 28.6% | Emerging and Developing Europe; IMF staff projection; April 2026 WEO. |
| 6 | Yemen | 26.5% | Middle East and Central Asia; IMF staff projection; April 2026 WEO. |
| 7 | Malawi | 24.4% | Sub-Saharan Africa; IMF staff projection; April 2026 WEO. |
| 8 | Haiti | 23.5% | Latin America and the Caribbean; IMF staff projection; April 2026 WEO. |
| 9 | Bolivia | 20.7% | Latin America and the Caribbean; IMF staff projection; April 2026 WEO. |
| 10 | Myanmar | 19.0% | Emerging and Developing Asia; IMF staff projection; April 2026 WEO. |
| 11 | Nigeria | 16.0% | Sub-Saharan Africa; IMF staff projection; April 2026 WEO. |
| 12 | Burundi | 14.5% | Sub-Saharan Africa; IMF staff projection; April 2026 WEO. |
| 13 | South Sudan, Republic of | 14.0% | Sub-Saharan Africa; IMF staff projection; April 2026 WEO. |
| 14 | Egypt | 13.2% | Middle East and Central Asia; IMF staff projection; April 2026 WEO. |
| 15 | Angola | 12.9% | Sub-Saharan Africa; IMF staff projection; April 2026 WEO. |
| 16 | Ethiopia | 11.8% | Sub-Saharan Africa; IMF staff projection; April 2026 WEO. |
| 17 | Suriname | 11.8% | Latin America and the Caribbean; IMF staff projection; April 2026 WEO. |
| 18 | Kazakhstan | 10.7% | Middle East and Central Asia; IMF staff projection; April 2026 WEO. |
| 19 | Kyrgyz Republic | 10.6% | Middle East and Central Asia; IMF staff projection; April 2026 WEO. |
| 20 | Libya | 10.5% | Middle East and Central Asia; IMF staff projection; April 2026 WEO. |
| 21 | Lao P.D.R. | 9.6% | Emerging and Developing Asia; IMF staff projection; April 2026 WEO. |
| 22 | São Tomé and Príncipe | 9.6% | Sub-Saharan Africa; IMF staff projection; April 2026 WEO. |
| 23 | Bangladesh | 9.2% | Emerging and Developing Asia; IMF staff projection; April 2026 WEO. |
| 24 | Zambia | 9.0% | Sub-Saharan Africa; IMF staff projection; April 2026 WEO. |
| 25 | Madagascar | 8.3% | Sub-Saharan Africa; IMF staff projection; April 2026 WEO. |
| 26 | Zimbabwe | 8.0% | Sub-Saharan Africa; IMF staff projection; April 2026 WEO. |
| 27 | Romania | 7.8% | Emerging and Developing Europe; IMF staff projection; April 2026 WEO. |
| 28 | Sierra Leone | 7.5% | Sub-Saharan Africa; IMF staff projection; April 2026 WEO. |
| 29 | Marshall Islands | 7.4% | Emerging and Developing Asia; IMF staff projection; April 2026 WEO. |
| 30 | Mongolia | 7.4% | Emerging and Developing Asia; IMF staff projection; April 2026 WEO. |
| 31 | Pakistan | 7.2% | Middle East and Central Asia; IMF staff projection; April 2026 WEO. |
| 32 | Uzbekistan | 7.0% | Middle East and Central Asia; IMF staff projection; April 2026 WEO. |
| 33 | Tunisia | 6.5% | Middle East and Central Asia; IMF staff projection; April 2026 WEO. |
| 34 | Belarus | 6.4% | Emerging and Developing Europe; IMF staff projection; April 2026 WEO. |
| 35 | Moldova | 6.4% | Emerging and Developing Europe; IMF staff projection; April 2026 WEO. |
| 36 | Jamaica | 6.1% | Latin America and the Caribbean; IMF staff projection; April 2026 WEO. |
| 37 | Ukraine | 6.1% | Emerging and Developing Europe; IMF staff projection; April 2026 WEO. |
| 38 | Azerbaijan | 6.0% | Middle East and Central Asia; IMF staff projection; April 2026 WEO. |
| 39 | Colombia | 5.9% | Latin America and the Caribbean; IMF staff projection; April 2026 WEO. |
| 40 | Kenya | 5.9% | Sub-Saharan Africa; IMF staff projection; April 2026 WEO. |
| 41 | Kosovo | 5.9% | Emerging and Developing Europe; IMF staff projection; April 2026 WEO. |
| 42 | Palau | 5.9% | Emerging and Developing Asia; IMF staff projection; April 2026 WEO. |
| 43 | Somalia | 5.9% | Middle East and Central Asia; IMF staff projection; April 2026 WEO. |
| 44 | Gambia, The | 5.8% | Sub-Saharan Africa; IMF staff projection; April 2026 WEO. |
| 45 | Ghana | 5.8% | Sub-Saharan Africa; IMF staff projection; April 2026 WEO. |
| 46 | Liberia | 5.7% | Sub-Saharan Africa; IMF staff projection; April 2026 WEO. |
| 47 | Russian Federation | 5.6% | Emerging and Developing Europe; IMF staff projection; April 2026 WEO. |
| 48 | Rwanda | 5.6% | Sub-Saharan Africa; IMF staff projection; April 2026 WEO. |
| 49 | Nauru | 5.5% | Emerging and Developing Asia; IMF staff projection; April 2026 WEO. |
| 50 | Serbia | 5.2% | Emerging and Developing Europe; IMF staff projection; April 2026 WEO. |
Source: IMF World Economic Outlook April 2026, PCPIPCH. Forecast year: 2026. Release date: April 14, 2026. Information cutoff: April 1, 2026.
What stands out in the 2026 IMF inflation forecast
Extreme upper tail
Three of 191 numeric projections are at least 50%, nine are at least 20%, and 20 are at least 10%. Venezuela alone is 312.3 percentage points above second-ranked Sudan.
Top 50 threshold
Serbia closes the published ranking at 5.2%, while the median across all 191 numeric projections is 3.3%. There are 53 economies at or above 5%, so three sit just outside the Top 50.
Official WEO group mix
Sub-Saharan Africa accounts for 16 Top 50 entries, Middle East and Central Asia for 12, Emerging and Developing Europe for eight, and Asia and Latin America and the Caribbean for seven each.
No advanced economy in Top 50
None of the Top 50 belongs to the IMF Advanced Economies group. The highest projected advanced-economy value is Iceland at 4.8%, below the 5.2% Top 50 cutoff.
Why inflation projections differ across countries
A rank alone does not identify the cause of inflation. IMF country reports and the WEO forecasting framework show that different combinations of shocks and policy conditions can produce similar annual-average rates.
Conflict and supply disruption
War, damaged infrastructure, restricted trade routes and shortages can raise transport, food and fuel costs. IMF reporting on Yemen illustrates how conflict and import constraints can dominate the inflation outlook.
Exchange-rate pass-through
Currency depreciation can raise the local-currency cost of imported food, energy, medicine and production inputs. The effect is usually stronger where imports are essential and foreign-exchange buffers are limited.
Fiscal and monetary policy
Interest-rate policy, fiscal financing, wage decisions and expectations affect how long price pressure persists. IMF reports on Argentina and Türkiye emphasize that disinflation depends on coordinated monetary, fiscal and exchange-rate policies.
Administered prices and subsidies
Changes to regulated energy, transport or utility prices can move headline CPI even when underlying demand is weak. Timing matters because a one-off adjustment can affect the annual average for many months.
Food, energy and climate exposure
Economies with large food weights or heavy dependence on imported fuel can react strongly to harvest losses, commodity prices and shipping costs. National CPI basket weights determine how strongly each shock enters the index.
Base and carryover effects
Annual-average inflation can stay elevated after monthly inflation begins to slow because high price levels from earlier months remain in the full-year average. Lower inflation means prices rise more slowly; it does not normally mean prices fall.
These channels explain how country forecasts can differ; they are not a claim that one factor alone caused each ranked value. Country-specific interpretation requires the relevant IMF staff report and national price data.
What the ranking means for readers
The ranking is useful for comparing the IMF’s expected pace of average consumer-price growth in 2026. It is not a league table of price levels or living costs. A projected rate of 5% means the average CPI is expected to be about 5% higher than the previous year’s average, not that every product or household budget rises by exactly 5%.
Forecasts should be read with their vintage. A projection published in April can be revised when exchange rates, commodity prices, fiscal measures, monetary policy, conflict conditions or incoming CPI releases differ from the assumptions available on April 1.
For purchasing-power analysis, inflation should be compared with wage, pension or income growth. For short-term momentum, use monthly or 12-month CPI releases. For monetary-policy analysis, add core inflation, expectations and the central bank’s target.
Related StatRanker pages
FAQ
Which country has the highest projected inflation in 2026?
Venezuela ranks first with an IMF annual-average CPI projection of 387.4%, followed by Sudan at 75.1% and Iran at 68.9%.
Which economy has the lowest IMF projection for 2026?
Costa Rica has the lowest numeric value in the April 2026 WEO export at −0.4%. It does not appear in the Top 50 highest-inflation table.
What is the median IMF inflation projection for 2026?
The median across the 191 economies with numeric 2026 values is 3.3%.
Are these final 2026 inflation rates?
No. They are IMF staff projections based on information available through April 1, 2026. Final observed annual-average rates can differ.
Is annual-average inflation the same as year-end inflation?
No. Annual-average inflation compares the average CPI across two full years. Year-end inflation compares price levels at period endpoints and can show a different direction or magnitude.
Why use the April database after the July WEO Update?
The IMF publishes the full WEO database with the April and October reports. January and July are partial updates and do not replace the complete country-level database used for this ranking.
Which WEO economies are missing a numeric 2026 value?
Afghanistan, Eritrea, Lebanon, Sri Lanka, Syria, and West Bank and Gaza have no numeric 2026 value in the official PCPIPCH export used for the audit.
Why can IMF and national inflation forecasts differ?
They may use different publication dates, policy assumptions, exchange-rate paths, data cutoffs and definitions. This page keeps one IMF vintage to preserve internal comparability.
Does lower inflation mean consumer prices are falling?
Usually not. Lower positive inflation means prices are rising more slowly. A sustained fall in the CPI level would require negative inflation, or deflation.
Sources
IMF World Economic Outlook Database, April 2026
Primary official dataset environment for the PCPIPCH country projections.
IMF DataMapper Excel export: PCPIPCH
Direct official spreadsheet used to calculate coverage, rank the 2026 values, find the median and identify missing entries.
https://www.imf.org/external/datamapper/export/excel.php?indicator=PCPIPCH
IMF DataMapper: Average consumer prices
Official indicator page for annual percent change in average consumer prices.
https://www.imf.org/external/datamapper/PCPIPCH%40WEO/WEOWORLD
April 2026 WEO Database Appendix
Source for the 197-economy basis, official WEO group structure and April 1 information cutoff.
World Economic Outlook, April 2026
Official publication page confirming the April 14, 2026 release.
https://www.imf.org/en/publications/weo/issues/2026/04/14/world-economic-outlook-april-2026
WEO Frequently Asked Questions
Methodology source for forecast preparation, revisions and the distinction between full databases and interim updates.
https://data.imf.org/en/Datasets/WEO/Frequently-Asked-Questions
IMF World Economic Outlook Update, July 2026
Context for the later interim update; it does not replace the full April country database.
https://www.imf.org/en/publications/weo/issues/2026/07/08/world-economic-outlook-update-july-2026
IMF country reports and policy context
Supporting country context for conflict, exchange-rate, fiscal and monetary-policy channels discussed in “Why countries differ.”
Related rankings
More StatRanker pages connected by topic, category or ranking theme.
Top 100 Countries by Food Inflation (%), 2025 — Full Ranking + Context
Open rankingTOP 10 Countries with Highest Core Inflation (2025)
Open rankingTOP 10 Countries with Highest Food Inflation (2025)
Open rankingTOP 10 Countries with Lowest Inflation (2025)
Open ranking
StatRanker (Website)
administrator
