


Top 100 Countries by Total CO₂ Emissions, 2026
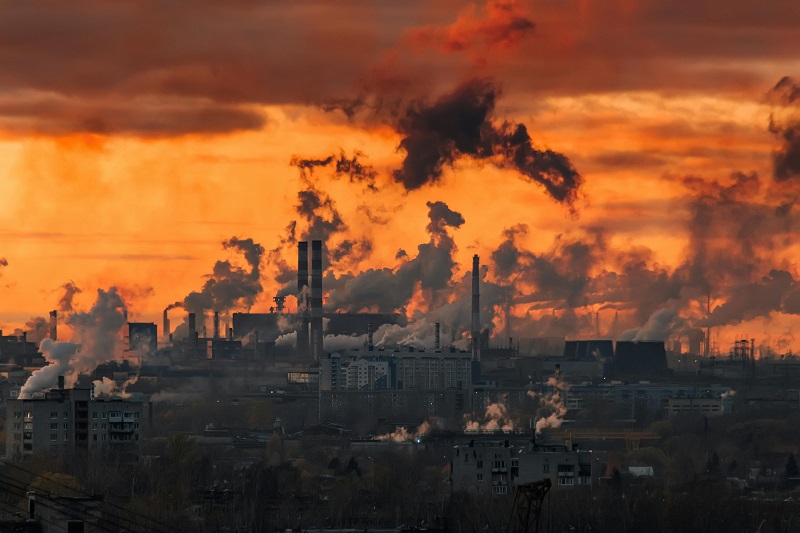
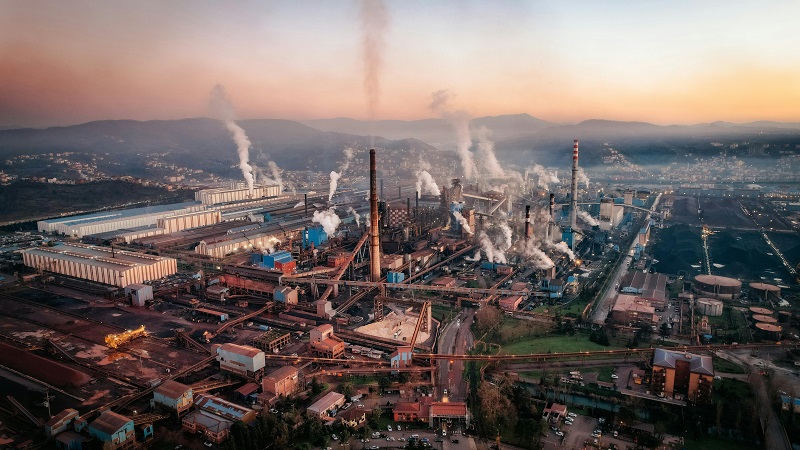
Climate emissions · fossil CO2 · 2026 snapshot Countries and Economies by Fossil CO2 Emissions: EDGAR/JRC 2024 Snapshot China is
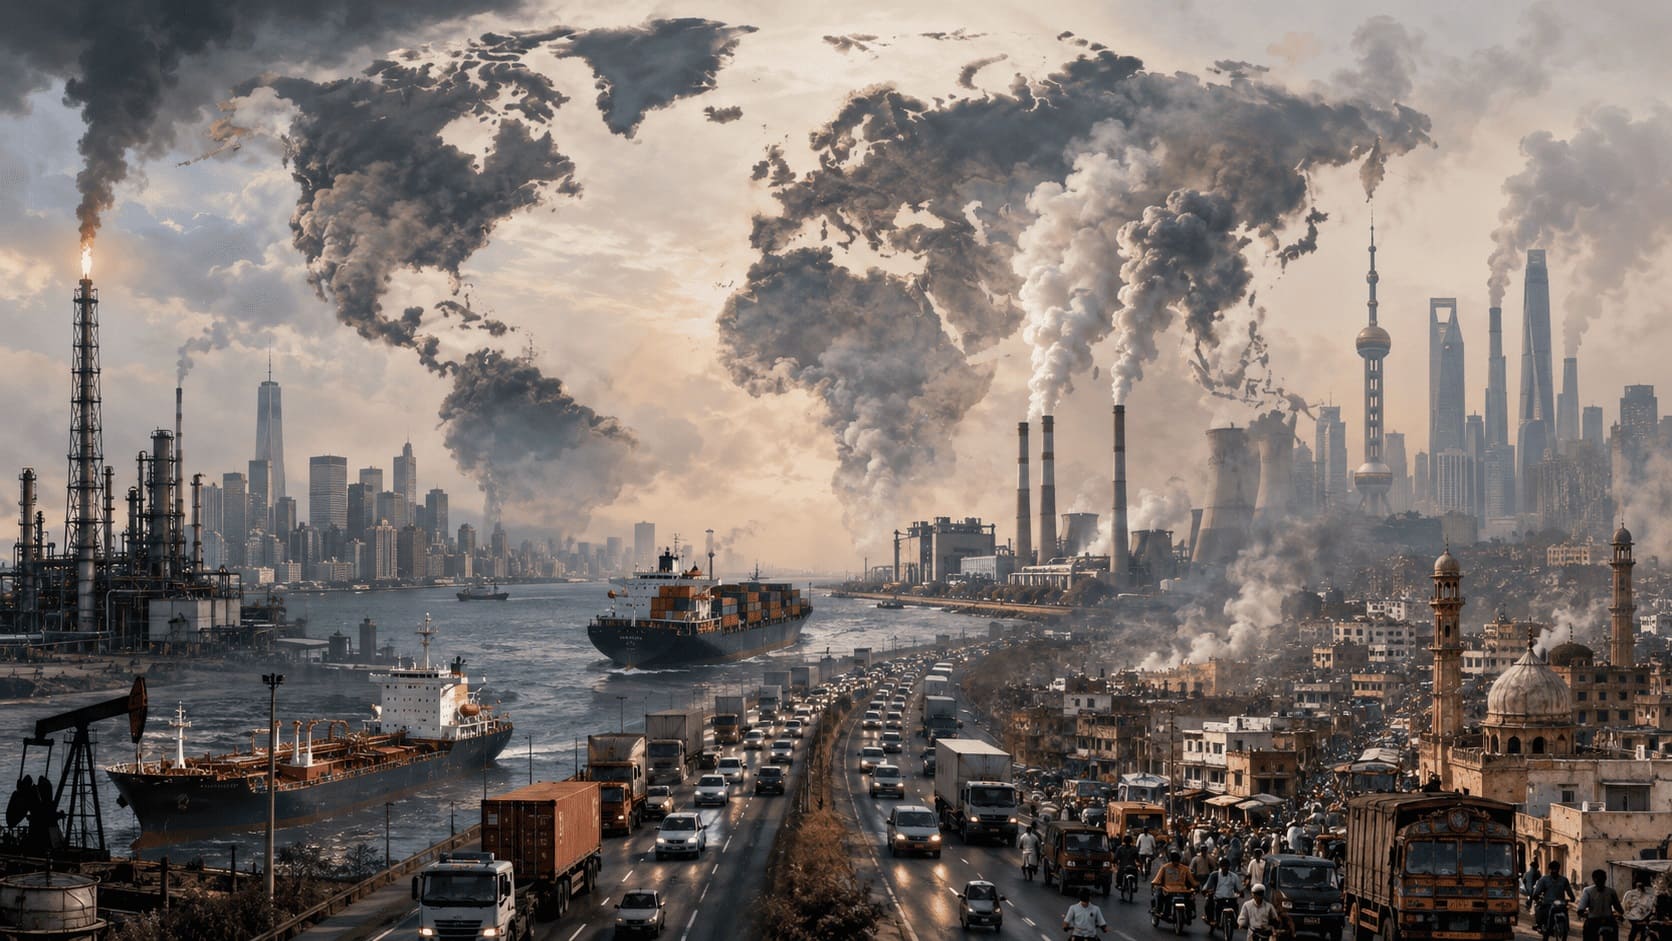
Climate emissions · fossil CO2 · 2026 snapshot Countries and Economies by Fossil CO2 Emissions: EDGAR/JRC 2024 Snapshot China is
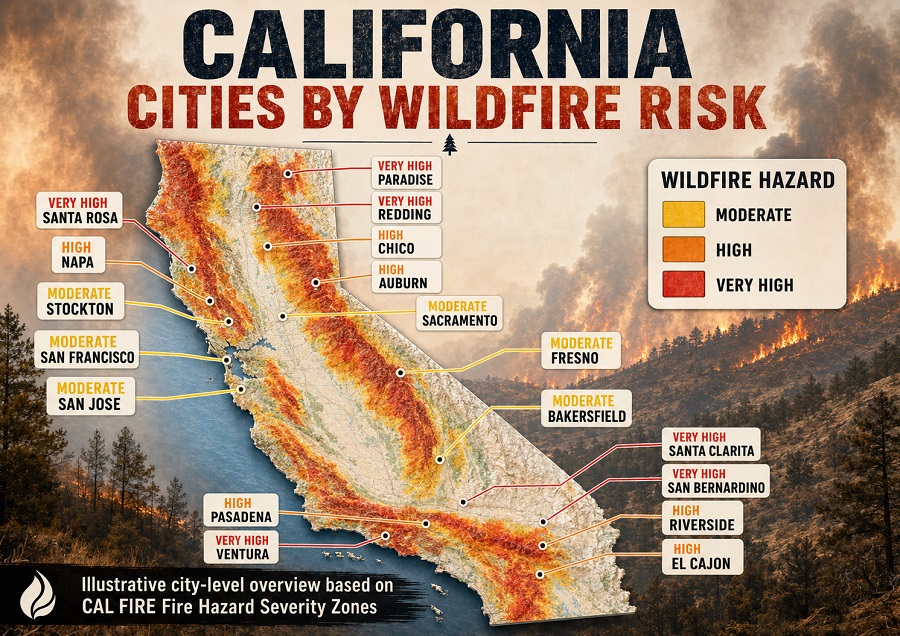
Wildfire risk · California communities · official hazard-map context California communities with the highest modeled wildfire risk to homes This
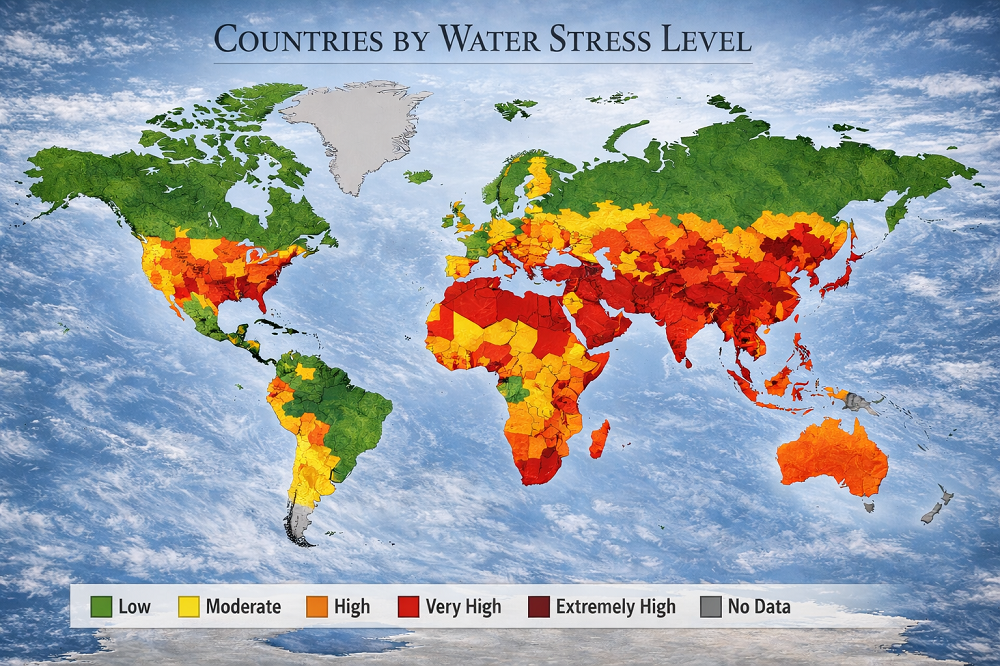
Climate · Water · Sustainability Kuwait ranks first among the most water-stressed countries in the latest official global data, followed
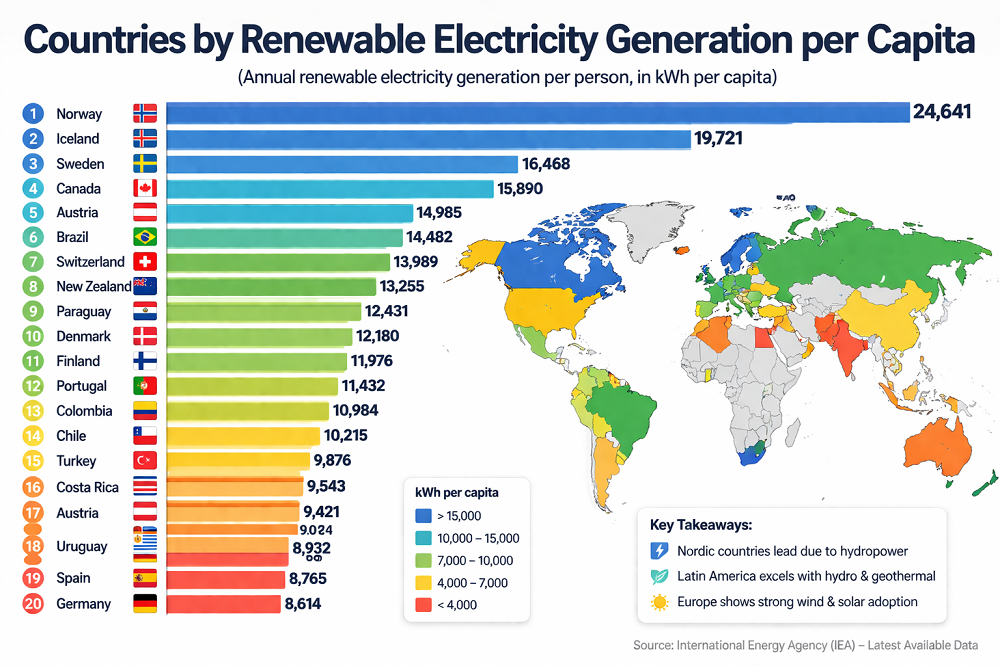
Climate · Clean Power · Country Ranking Installed renewable capacity tells you how much equipment is connected to the grid.
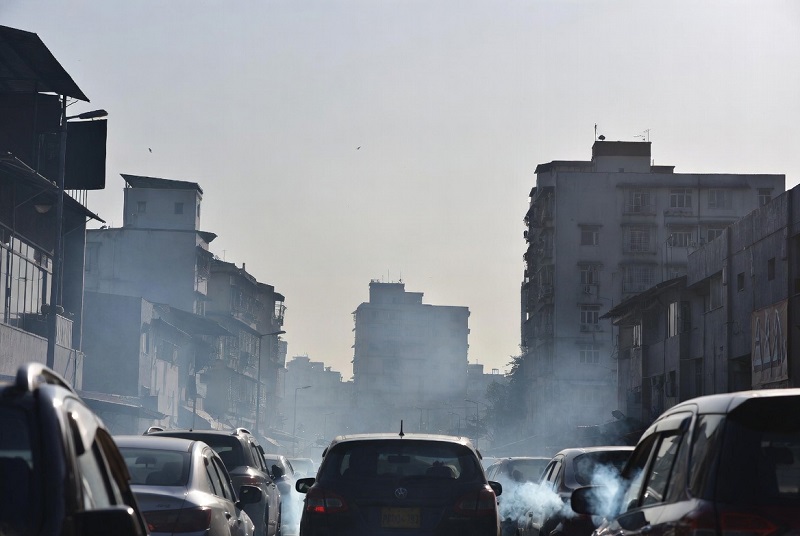
Climate, air quality and public health PM2.5 Air Pollution by Country: Latest Available World Bank/GBD Data PM2.5 means fine particulate
Climate · Energy · CO₂ Emissions CO₂ emissions per capita divide a country’s annual territorial CO₂ output from fossil fuels
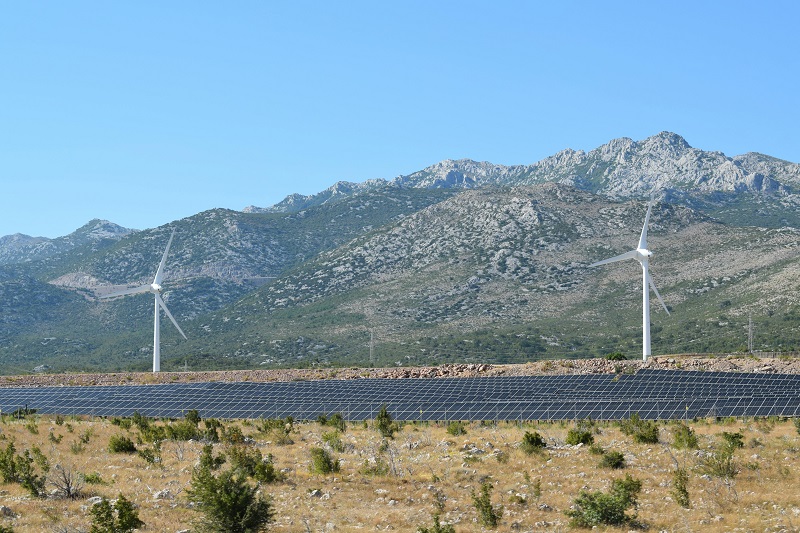
Metric focus: electricity generation mix Latest full-year country data: 2024 (published/updated in 2025) Renewable electricity share in 2025: why “power

Composite Climate Hazard Exposure Score 2025: heat, floods and storms on a 0–100 scale Climate risk is not the same

Metric focus: exposure (not probability) Horizon: 2050 Units: people exposed (approx.) How to read “exposure” in a 2050 sea-level-rise ranking

100-country watchlist of repeated extreme-weather disaster pressure, 2000–2025 Extreme-weather disaster frequency is a pressure indicator. It shows how often national
Patterns behind city PM2.5 in 2025: what the ranking is capturing Annual mean PM2.5 is a “slow” indicator: it reflects

Climate Normals vs. 2025: What the 1991–2020 Baseline Reveals This ranking compares average annual near-surface air temperature (2-meter air temperature)
