
Top 50 Inflation Rate by Country 2026: IMF
Top 50 · Inflation and prices · IMF WEO April 2026 Which countries have the highest projected inflation in 2026?
StatRanker.org is a data-driven research publication that transforms official economic, demographic and social statistics into clear rankings, structured comparisons and concise analytical reports.
Our research is based primarily on open data published by authoritative institutions, including the World Bank, International Monetary Fund (IMF), United Nations agencies, national statistical offices, government departments, regulators and other recognized public-data providers.
For each ranking, we define a specific metric, verify the underlying data, document the applicable year or statistical snapshot, and compare only observations that are sufficiently consistent in definition, unit and scope. When multiple sources are required, the dataset is compiled according to a documented source hierarchy, and differences in methodology, reference periods, geographic coverage or measurement standards are disclosed where they affect comparability.
StatRanker.org covers a broad range of economic and social indicators, including economic growth, inflation, public debt, international trade, population, income, labor markets, health expenditure and other measurable dimensions of national and regional performance. Particular attention is given to the United States, including state, county, metropolitan and other domestic rankings as well as comparisons between the U.S. and major global economies.
Our rankings are based on documented source values or transparently disclosed calculations. Where relevant, published values are distinguished from calculated values, official forecasts, modeled projections and other observed industry data. Calculated values are derived from identified source inputs using a disclosed formula, while forecasts and projections are clearly separated from historical or currently observed statistics.
Each research ranking documents the source institution, applicable source year or snapshot, unit of measurement, ranking direction and methodology used for comparison. Where a value has been calculated rather than directly published, the underlying inputs, formula and assumptions are documented. Where a projection is used, the base value, growth or trend parameter, formula and assumptions are identified separately.
Tables and charts on StatRanker.org are research visualizations created from the documented underlying data. Rankings are generally determined from the underlying numeric values rather than rounded display values. Analytical commentary is intended to describe patterns visible in the data and does not present unsupported correlations as evidence of causation.
The publication is designed for researchers, journalists, students, analysts, educators, businesses and decision-makers who need an efficient and transparent way to compare countries, regions, U.S. states, counties, metropolitan areas and other statistical entities using verifiable data.
StatRanker.org also maintains a correction-oriented editorial approach. When an official source revises a dataset, releases a more recent comparable observation or a material error is identified in a published ranking, the relevant page may be reviewed and updated to reflect the best available evidence.
StatRanker.org may be cited in articles, reports, presentations, academic materials and other editorial or educational publications. Original StatRanker.org analysis, tables and visualizations may be reproduced for legitimate editorial, research or educational purposes provided that they are not materially or misleadingly altered, clear attribution is included, and any applicable licensing or attribution requirements of the underlying data providers are also respected.
A recommended attribution is:
“Source: StatRanker.org, based on official data.”
For academic, regulatory, financial, legal or other high-stakes uses, readers should also review and, where appropriate, cite the original statistical institution and dataset identified on the relevant StatRanker.org page.
StatRanker.org does not replace the World Bank, IMF, United Nations, national statistical offices or other primary data authorities. Its role is to research, verify, organize, document and present their data in a format that makes statistical comparisons easier to understand, evaluate and use.
info@statranker.org
Rankings on inflation, consumer prices, energy and fuel prices, cost of living, purchasing power, and related price indicators.
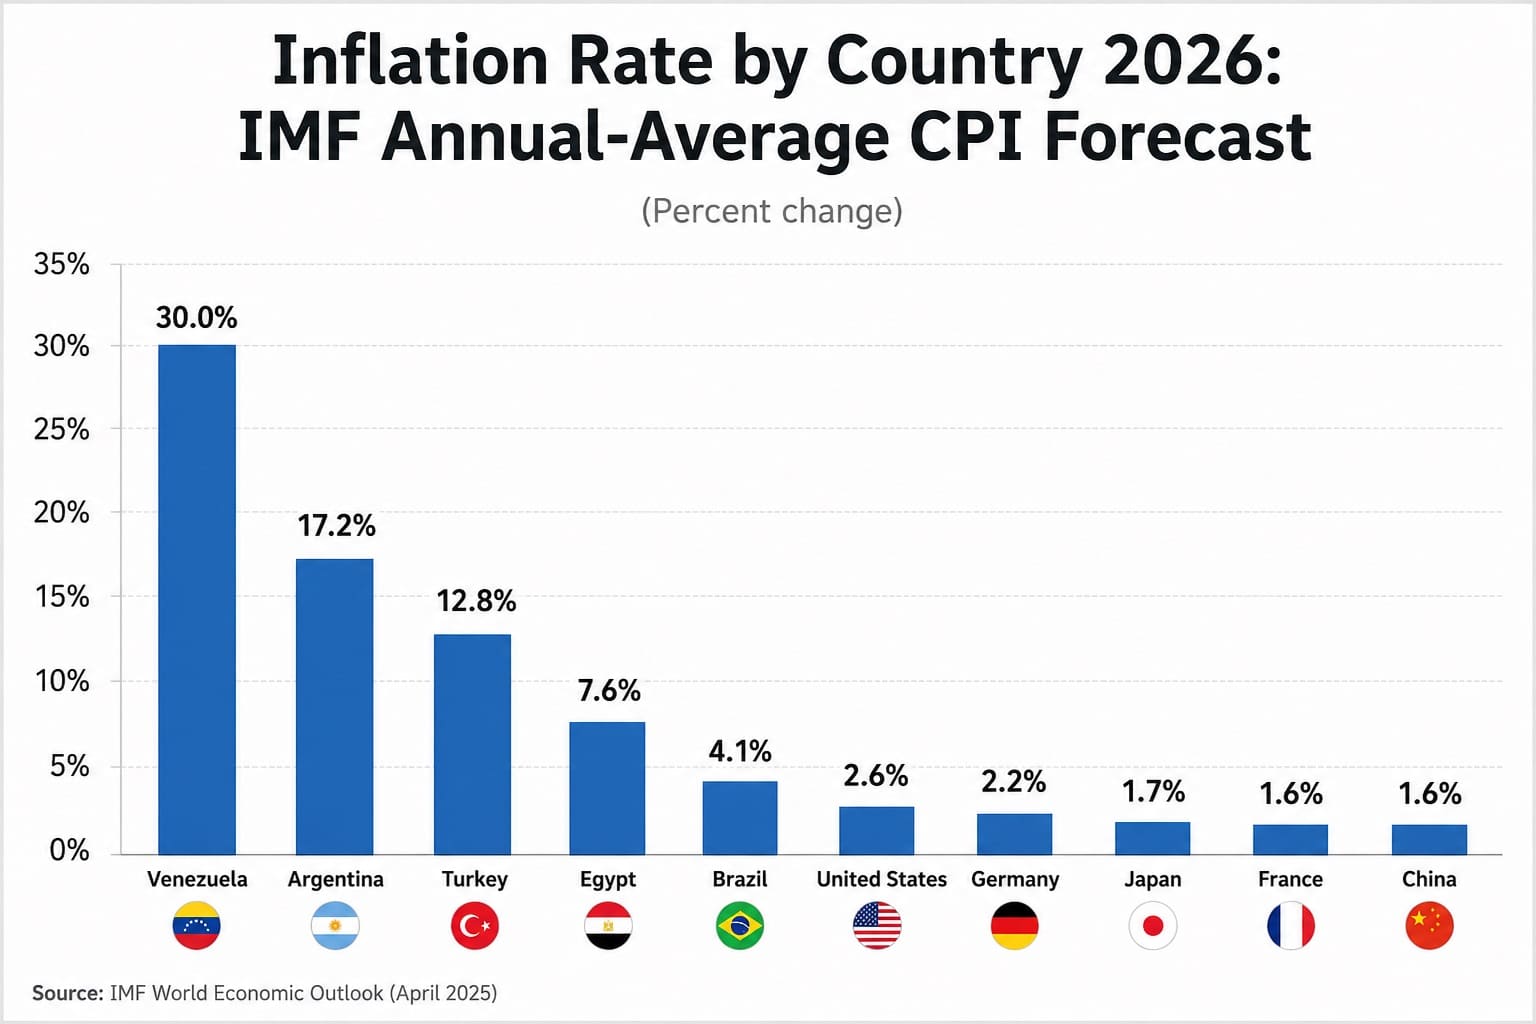
Top 50 · Inflation and prices · IMF WEO April 2026 Which countries have the highest projected inflation in 2026?

#sr-rating-page,#sr-rating-page *{box-sizing:border-box;} #sr-rating-page{–text:#111827;–heading:#0b1220;–muted:#475569;–blue:#1d4ed8;–blue-soft:#eff6ff;–green-soft:#ecfdf5;–amber-soft:#fffbeb;–red-soft:#fef2f2;–line:#dbe5f3;–line-strong:#c6d4e8;width:100%;max-width:1120px;margin:0 auto;padding:22px 16px 44px;background:transparent;color:var(–text);font-family:system-ui,-apple-system,BlinkMacSystemFont,”Segoe UI”,Roboto,Arial,sans-serif;} #sr-rating-page [hidden]{display:none!important;} #sr-rating-page .sr-section{width:100%;margin:0 0 24px;scroll-margin-top:24px;} #sr-rating-page .sr-card,#sr-rating-page .sr-hero,#sr-rating-page .sr-chart-card{width:100%;background:#fff;border:1px solid var(–line);border-radius:18px;box-shadow:0 12px
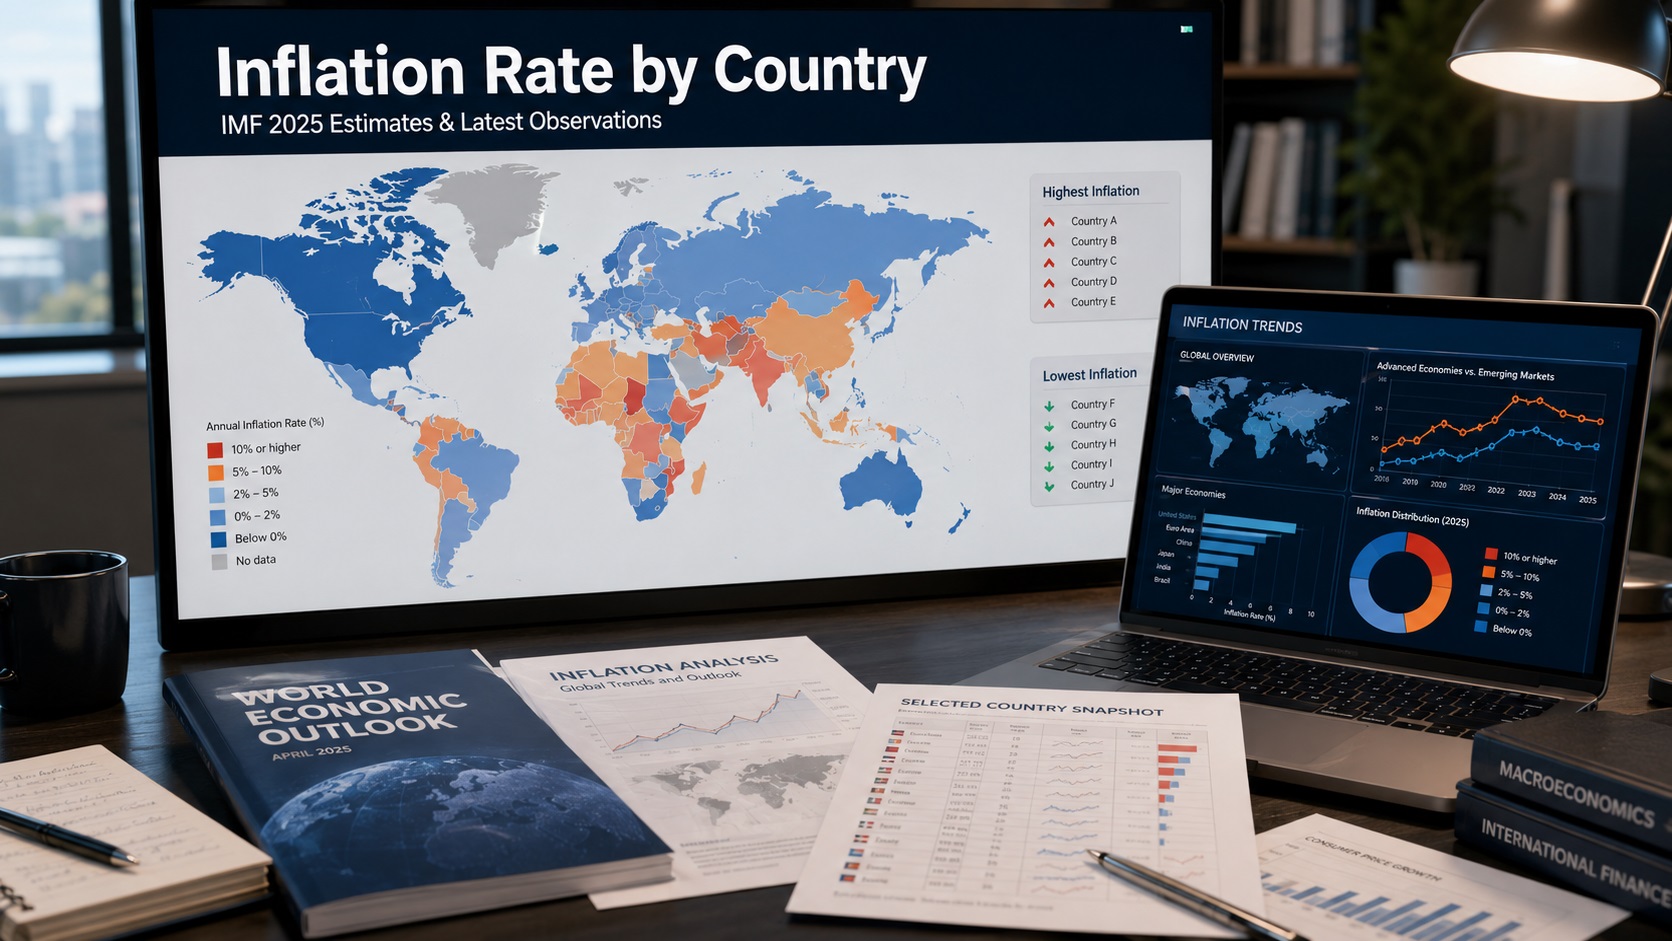
Economy · Inflation and prices · 2025 Top 10 Countries by IMF 2025 Average Inflation Estimate This ranking compares countries
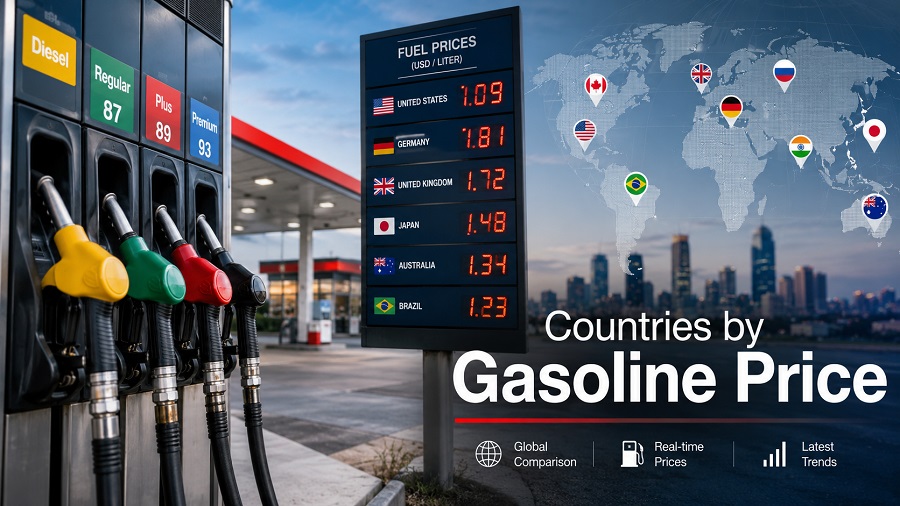
Where gasoline costs the most in 2026 Drivers in Hong Kong paid 4.156 U.S. dollars per liter for gasoline on
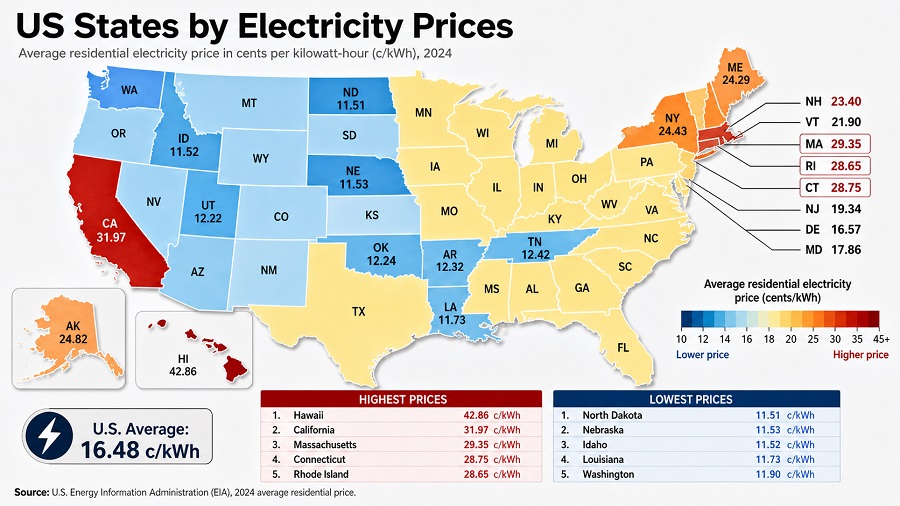
Electricity prices · U.S. states and D.C. · EIA monthly data Electricity Prices by State and D.C. in the Latest
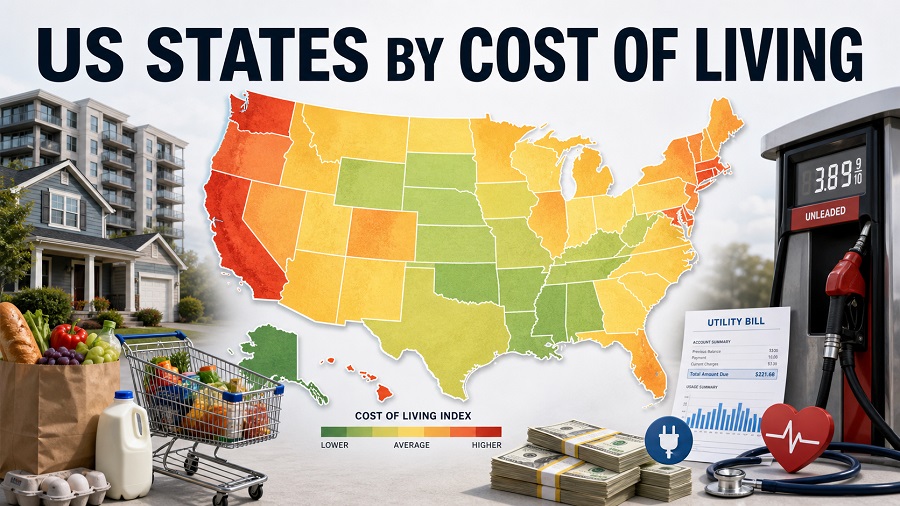
U.S. cost of living ranking · MERIC Annual Average 2025 How U.S. State Price Levels Compare Using the Latest MERIC
Economy · Prices · Inflation Why annual consumer-price inflation still matters more than a single monthly headline Inflation is the
Global FX · Weakest currencies vs USD · Latest Feb 2026 snapshot Weakest Currencies Against the U.S. Dollar: Biggest Year-over-Year

Updated April 16, 2026 · 2025 CPI snapshot Food Inflation by Country: 2025 Snapshot Food inflation is the year-over-year change

EU household natural gas prices · Eurostat · H2 2025 EU Household Natural Gas Prices by Country, H2 2025 Among
Household electricity prices · USD/kWh · 2026 snapshot Global Household Electricity Price Benchmark: 2026 Snapshot This ranking compares household electricity

Top 10 Countries with Highest Official Core Inflation at End-2025 Inflation · Price stability · Underlying price pressure Core inflation

Inflation and prices · gasoline affordability · 2025 Gasoline affordability after adjusting pump prices for income Gasoline affordability compares the
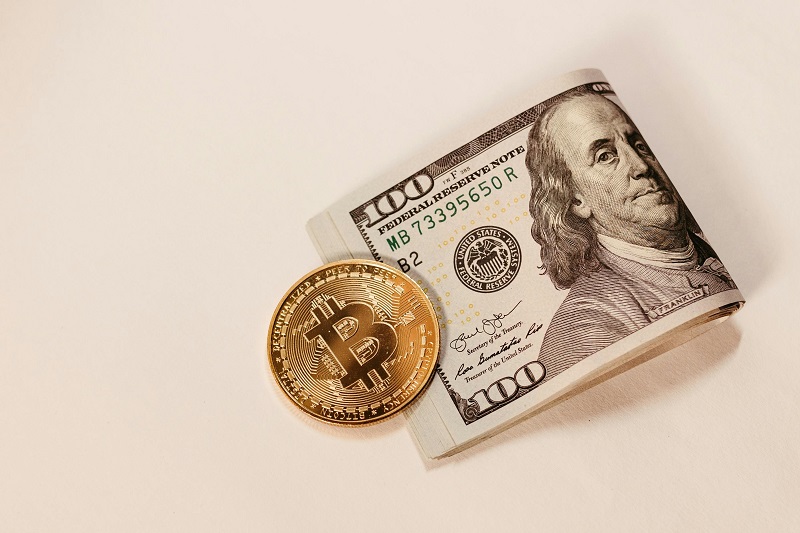
Economy · Inflation · Food prices Why food inflation still matters in a year of softer global commodity prices Late

Analysis year: 2025 Metric: CPI inflation forecast (end-of-period, YoY %) Primary baseline: IMF projections (Oct 2025 vintage) Low inflation is not an accident.

Food inflation gap · September 2025 data · 2026 snapshot Where food prices are rising faster than the broader CPI
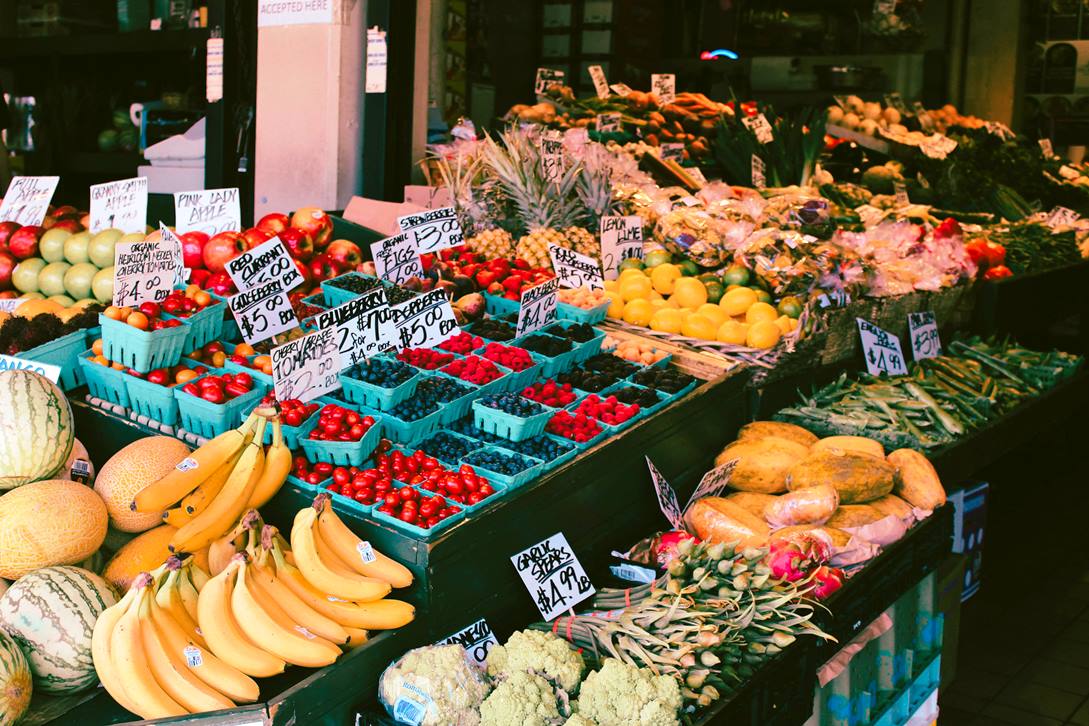
Food prices · CPI · 2026 snapshot Why grocery bills can rise faster than headline inflation Food prices can rise

Methods to combat inflation: what actually worked across countries (2020–2025) Inflation is not a single problem with a single cure.
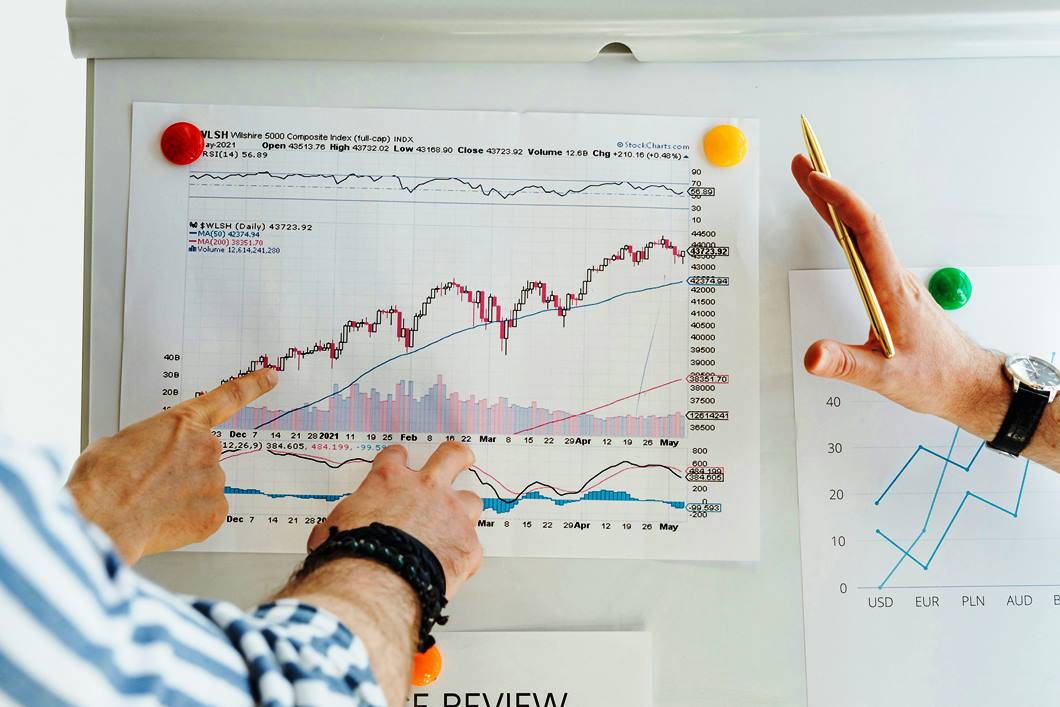
Inflation and prices · CPI guide · 2026 Consumer Price Index: how to read CPI, core CPI and HICP correctly
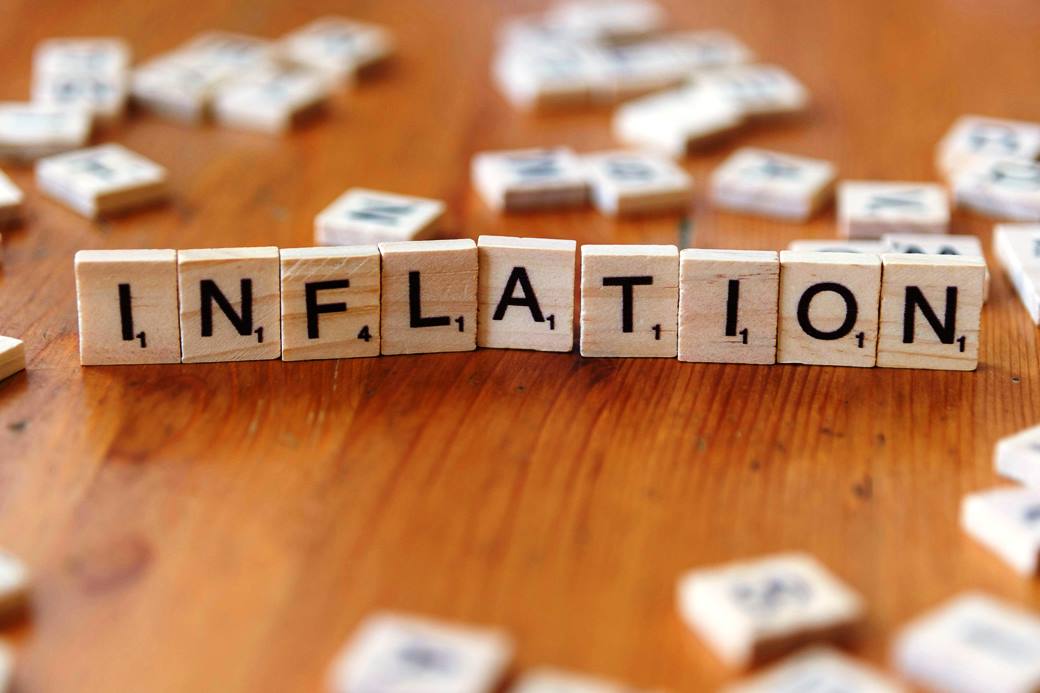
Updated snapshot • 2026 edition How inflation reduces purchasing power Purchasing power is what your income can buy in real
Largest price increases within a 20-category U.S. CPI benchmark, 2020–2026 U.S. CPI-U · Unadjusted January 2020 vs. August 2026 indexes

Site managed by Oleksandr Isaienko (team lead; private entrepreneur) since 28 August 2025, registration code 133276738020, Ukraine.
Contact: info@statranker.org.
Technical infrastructure (hosting/server resources) is located in the United States; a CDN may be used to improve performance with edge locations in multiple countries.