

US States by Electricity Prices, 2026 Snapshot
Electricity prices · U.S. states and D.C. · EIA monthly data
Electricity Prices by State and D.C. in the Latest EIA Monthly Data
This ranking compares average retail electricity revenue per kilowatthour across the 50 states and the District of Columbia. EIA calculates the measure by dividing retail electric revenues by retail sales, making it a comparable retail price indicator. The figures are EIA preliminary monthly estimates for February 2026, not a full-year 2026 average.
Overview: what the electricity price ranking shows
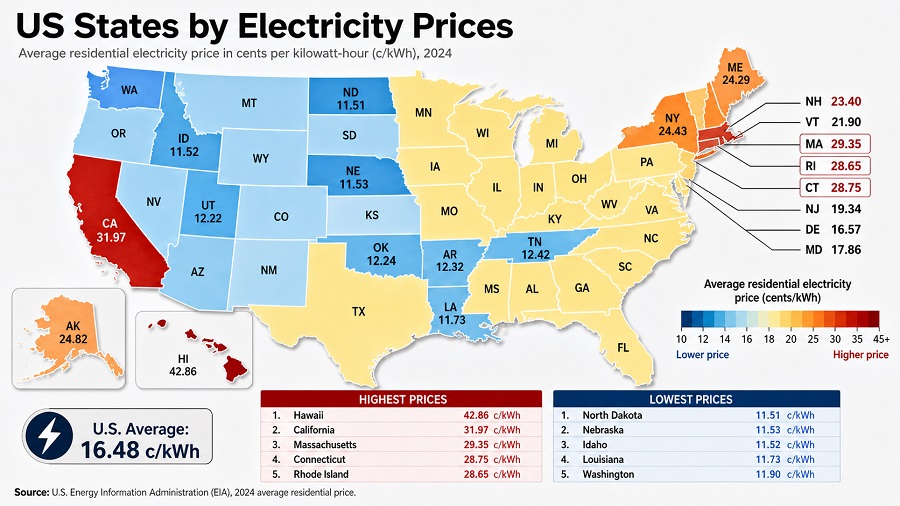
The top of the ranking is concentrated in isolated or high-cost power markets. Hawaii is far above every other entry because island grids face higher fuel, infrastructure and system-balancing costs. The next tier is dominated by New England, California, New York, Alaska and the District of Columbia, where supply constraints, network costs, seasonal demand and market structure can lift average retail revenue per kWh.
The lowest prices are mostly in the central and Mountain states. North Dakota, New Mexico, Iowa, Oklahoma and Nebraska sit at the bottom of the table, with all-sector averages below 9.50¢/kWh. These values do not mean every household pays less than households in other states: the all-sector metric blends residential, commercial and industrial sales, so large industrial loads can pull a state average below the residential rate.
February 2026 is a monthly indicator for comparing state price pressure. It is not a complete annual bill comparison; weather, seasonal consumption, sector mix and later EIA revisions can change the final annual picture.
Top 10 highest electricity prices, February 2026
The top 10 includes one non-contiguous island state, several New England states, California, New York, Alaska and the District of Columbia. The pattern reflects several drivers at once: geography, fuel exposure, grid investment, customer mix and local market rules.
| Rank | State or DC | All-sector price | YoY change |
|---|---|---|---|
| 1 | Hawaii | 37.78¢/kWh | −0.6% |
| 2 | Connecticut | 27.61¢/kWh | −5.2% |
| 3 | Massachusetts | 27.06¢/kWh | +2.8% |
| 4 | Maine | 26.67¢/kWh | +19.2% |
| 5 | California | 26.55¢/kWh | +2.0% |
| 6 | Rhode Island | 26.23¢/kWh | −13.4% |
| 7 | New York | 24.88¢/kWh | +14.2% |
| 8 | New Hampshire | 24.25¢/kWh | +12.8% |
| 9 | Alaska | 23.31¢/kWh | +2.5% |
| 10 | District of Columbia | 22.70¢/kWh | +14.3% |
Table uses all-sector average revenue per kilowatthour. Year-over-year change compares February 2026 with February 2025.
Highest all-sector electricity prices, February 2026
Hawaii stands far above the mainland high-price states. The next group is tightly clustered between roughly 24¢ and 28¢ per kWh, still well above the U.S. all-sector average of 14.36¢ per kWh.
Methodology
The ranking uses the U.S. Energy Information Administration’s Electric Power Monthly, Table 5.6.A, “Average Price of Electricity to Ultimate Customers by End-Use Sector, by State.” States are sorted by the February 2026 all-sector average price, measured in cents per kilowatthour. The all-sector figure combines residential, commercial, industrial and transportation customers, so it measures the broader retail market rather than household-only electricity rates.
The EIA describes this measure as average revenue per kWh: retail electricity revenues divided by retail electricity sales. That makes it a comparable retail price indicator, not a posted utility tariff. The February 2026 values are preliminary estimates based on the monthly EIA-861M reporting system, and the EIA notes that customer classification and revisions can affect sector-level and state-level comparisons. Values in this article are rounded to two decimals for prices and one decimal for year-over-year change.
The state table used here covers February 2026. It is not a final 2026 annual average. Seasonal demand, fuel costs, rate cases, customer mix and later revisions can change monthly rankings, especially where winter heating demand, industrial consumption or island-grid fuel exposure is large.
Full ranking: electricity prices by state and D.C., February 2026
Search, sort, filter by Census division, or switch between cents per kWh and an index where the U.S. all-sector average equals 100.
Full table: 51 rows. Default view: Top 20 by price.
| Rank | State or DC | Price / index | YoY change |
|---|---|---|---|
| 1 | Hawaii | 37.78¢/kWh263.1 | −0.6% |
| 2 | Connecticut | 27.61¢/kWh192.3 | −5.2% |
| 3 | Massachusetts | 27.06¢/kWh188.4 | +2.8% |
| 4 | Maine | 26.67¢/kWh185.7 | +19.2% |
| 5 | California | 26.55¢/kWh184.9 | +2.0% |
| 6 | Rhode Island | 26.23¢/kWh182.7 | −13.4% |
| 7 | New York | 24.88¢/kWh173.3 | +14.2% |
| 8 | New Hampshire | 24.25¢/kWh168.9 | +12.8% |
| 9 | Alaska | 23.31¢/kWh162.3 | +2.5% |
| 10 | District of Columbia | 22.70¢/kWh158.1 | +14.3% |
| 11 | Vermont | 20.42¢/kWh142.2 | +6.9% |
| 12 | New Jersey | 19.49¢/kWh135.7 | +15.8% |
| 13 | Maryland | 19.06¢/kWh132.7 | +17.3% |
| 14 | Pennsylvania | 16.52¢/kWh115.0 | +19.5% |
| 15 | Delaware | 15.23¢/kWh106.1 | +8.9% |
| 16 | Michigan | 15.14¢/kWh105.4 | +5.6% |
| 17 | Ohio | 14.52¢/kWh101.1 | +21.9% |
| 18 | Florida | 14.31¢/kWh99.7 | +8.5% |
| 19 | Wisconsin | 13.95¢/kWh97.1 | +5.3% |
| 20 | Virginia | 13.92¢/kWh96.9 | +26.3% |
| 21 | Illinois | 13.88¢/kWh96.7 | +5.7% |
| 22 | Colorado | 13.44¢/kWh93.6 | +12.9% |
| 23 | Indiana | 13.21¢/kWh92.0 | +9.1% |
| 24 | South Carolina | 13.10¢/kWh91.2 | +15.7% |
| 25 | Alabama | 12.70¢/kWh88.4 | +2.8% |
| 26 | North Carolina | 12.55¢/kWh87.4 | +5.4% |
| 27 | Minnesota | 12.52¢/kWh87.2 | +3.0% |
| 28 | Mississippi | 12.32¢/kWh85.8 | +10.3% |
| 29 | Arizona | 12.29¢/kWh85.6 | −0.5% |
| 30 | Washington | 12.19¢/kWh84.9 | +10.9% |
| 31 | Georgia | 12.09¢/kWh84.2 | +8.2% |
| 32 | Kansas | 11.90¢/kWh82.9 | +9.0% |
| 33 | Tennessee | 11.73¢/kWh81.7 | +2.8% |
| 34 | West Virginia | 11.64¢/kWh81.1 | −0.3% |
| 35 | South Dakota | 11.54¢/kWh80.4 | +9.6% |
| 36 | Oregon | 11.39¢/kWh79.3 | −2.1% |
| 37 | Montana | 11.33¢/kWh78.9 | +14.0% |
| 38 | Kentucky | 11.25¢/kWh78.3 | +5.3% |
| 39 | Missouri | 10.75¢/kWh74.9 | +5.9% |
| 40 | Utah | 10.65¢/kWh74.2 | +4.5% |
| 41 | Texas | 10.39¢/kWh72.4 | +6.6% |
| 42 | Idaho | 10.14¢/kWh70.6 | +7.9% |
| 43 | Wyoming | 10.12¢/kWh70.5 | +5.2% |
| 44 | Nevada | 10.09¢/kWh70.3 | +0.2% |
| 45 | Arkansas | 10.00¢/kWh69.6 | +7.5% |
| 46 | Louisiana | 9.77¢/kWh68.0 | +9.3% |
| 47 | Nebraska | 9.49¢/kWh66.1 | +6.7% |
| 48 | Oklahoma | 9.36¢/kWh65.2 | +6.5% |
| 49 | Iowa | 9.08¢/kWh63.2 | +0.4% |
| 50 | New Mexico | 8.97¢/kWh62.5 | −6.2% |
| 51 | North Dakota | 8.87¢/kWh61.8 | +8.3% |
Source: U.S. Energy Information Administration, Electric Power Monthly, Table 5.6.A. Data are preliminary February 2026 estimates from Form EIA-861M. District of Columbia is included separately, so the table contains 51 rows.
Insights from the electricity price ranking
The distribution is highly uneven. Hawaii’s 37.78¢/kWh is more than four times North Dakota’s 8.87¢/kWh and about 2.6 times the U.S. all-sector average. This gap is too large to explain by household behavior alone; it reflects structural differences in fuel supply, grid scale, island exposure, transmission investment, state regulation and customer mix.
New England remains the most visible regional cluster near the top. Connecticut, Massachusetts, Maine, Rhode Island, New Hampshire and Vermont all rank in the upper part of the table. These states often face higher winter reliability costs, constrained fuel delivery, smaller system scale and retail-rate structures that recover network and policy costs through customer bills.
The middle of the table is more mixed. States such as Michigan, Ohio, Florida, Wisconsin, Virginia and Illinois sit around the national average but moved differently from a year earlier. Virginia’s year-over-year increase is especially notable, while Ohio and Pennsylvania also show large increases. At the low end, several central and Mountain states remain below 10¢/kWh, but a low average price does not automatically mean a low monthly bill because usage levels can be high.
What the ranking means for readers
For households, the ranking signals local electricity-cost pressure but does not estimate a complete monthly bill. A household in a lower-price state can still pay a large monthly bill if air-conditioning, electric heating or home size pushes consumption high. A household in a high-price state can reduce exposure through efficiency, time-of-use behavior, weatherization or distributed energy options where available.
For businesses, the all-sector figure captures the broader cost environment faced by commercial and industrial customers. Electricity-intensive industries care not only about headline rates, but also about demand charges, reliability, interconnection timelines, transmission constraints and whether the local grid can support new load without major upgrades.
For policymakers, the table identifies states where affordability pressure is most visible and where average prices are rising quickly. High prices can reflect legitimate infrastructure investment, fuel-cost exposure or decarbonization costs, but they also increase pressure to protect vulnerable households, improve rate design and ensure that new demand pays an appropriate share of grid expansion.
FAQ: electricity prices by state and D.C.
Is this the same as a residential electricity rate?
No. The main ranking uses all sectors combined: residential, commercial, industrial and transportation. Residential prices are often higher than the all-sector average because industrial customers usually buy larger volumes at lower average prices.
Why is Hawaii so much higher than other states?
Hawaii’s electricity market is shaped by island-grid constraints, fuel logistics, limited interconnection with other grids and higher system costs per customer. These factors make its average electricity price structurally different from most mainland states.
Why can a state with cheap electricity still have high bills?
A bill depends on both price and usage. States with hot summers, electric heating, larger homes or energy-intensive businesses can have high total electricity spending even when the cents-per-kWh price is below the national average.
Why use February 2026 instead of a full-year average?
A full-year 2026 state average is not available yet. February 2026 is the EIA monthly state table used here, so the ranking is a monthly comparison rather than a completed annual ranking.
Why do some states move sharply year over year?
Year-over-year changes can reflect fuel costs, utility rate cases, transmission and distribution spending, weather-sensitive demand, customer reclassification and shifts in the balance between residential, commercial and industrial sales.
Sources
-
U.S. Energy Information Administration — Electric Power Monthly, Table 5.6.A
State-level average electricity prices by end-use sector, February 2026 and February 2025.
https://www.eia.gov/electricity/monthly/epm_table_grapher.php?t=epmt_5_06_a -
U.S. Energy Information Administration — Electricity Monthly Update, End Use
Context on average revenue per kWh, sector-level national changes and February 2026 retail prices.
https://www.eia.gov/electricity/monthly/update/end-use.php -
U.S. Energy Information Administration — Electricity Data
EIA electricity datasets covering sales, revenue, prices, generation and customers.
https://www.eia.gov/electricity/data.php
Information updated: May 3, 2026. Figures are preliminary EIA monthly estimates and may be revised.
StatRanker (Website)
administrator
