


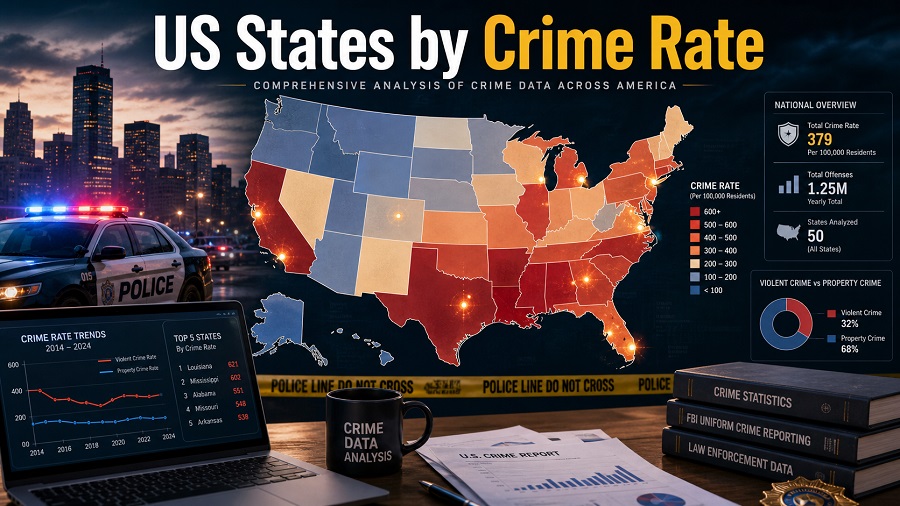
US States by Crime Rate, 2026 Snapshot Based on FBI 2024 Data
US States by Violent Crime Rate: 2024 FBI Estimates, 2026 Snapshot
Article updated: May 3, 2026
Thank you for reading this post, don't forget to subscribe!This ranking compares U.S. states by violent crime rate, measured as reported violent offenses per 100,000 residents. Property crime rates are shown beside the ranking metric because “crime rate” is often used loosely, while violent and property offenses describe different safety risks.
The 2026 framing means a latest-available-data snapshot, not crimes measured in 2026. The underlying state estimates are for 2024, the latest complete FBI UCR / Crime Data Explorer state-estimate year available for all 50 states at the time of this update. The estimates are based on law-enforcement submissions through the National Incident-Based Reporting System and the Summary Reporting System. Washington, D.C. is not included because the ranking covers states only.
Continue exploring
More StatRanker pages connected by topic, category or ranking theme.
California Cities by Crime Rate, Latest Official Data
Open rankingUS Cities by Crime Rate, 2026
Open rankingSummary cards
Overview: what the top of the ranking shows
The upper end of the violent-crime ranking is not dominated by the largest states. Alaska and New Mexico sit at the top, followed by Tennessee, Arkansas and Louisiana. Population adjustment changes the comparison: a smaller state can rank high even when its total number of offenses is far below California, Texas or New York.
The Top 10 also shows a clear regional pattern. Several Southern and Western states have elevated violent-crime rates, while New England states tend to appear near the bottom of the violent-crime distribution. Property crime tells a partly different story: Colorado, Washington, Oregon and New Mexico stand out more strongly on property offenses than some states with high violent-crime rankings.
How to read the metric
Violent crime includes murder and nonnegligent manslaughter, rape, robbery and aggravated assault. Property crime includes burglary, larceny-theft and motor vehicle theft. These rates are not victimization survey estimates and do not measure every harmful event; they measure offenses reported to or recorded by law enforcement and estimated through the FBI UCR / Crime Data Explorer framework.
A state rank is useful for broad comparison, but it is not a neighborhood-safety score. City-level patterns, reporting practices, tourism, commuting flows, police staffing, local poverty, drug markets and rural isolation can all change the experience of safety inside the same state.
Top 10 states by violent crime rate, 2026 snapshot
The Top 10 table uses the same 2024 FBI-estimate basis as the full table. Values are rates per 100,000 residents and are rounded to one decimal place.
| Rank | State | Violent crime rate | Property crime rate |
|---|---|---|---|
| 1 | Alaska | 724.1 | 1,711.2 |
| 2 | New Mexico | 717.1 | 2,751.1 |
| 3 | Tennessee | 592.3 | 2,032.1 |
| 4 | Arkansas | 579.4 | 1,929.5 |
| 5 | Louisiana | 519.8 | 2,296.4 |
| 6 | California | 486.0 | 2,078.4 |
| 7 | Colorado | 476.3 | 2,592.8 |
| 8 | Missouri | 462.0 | 1,941.2 |
| 9 | Kansas | 438.7 | 1,956.4 |
| 10 | South Carolina | 436.7 | 1,965.8 |
Chart: highest violent crime rates by state
The chart shows how Alaska and New Mexico separate from the rest of the Top 10, while ranks 3–10 form a lower but still elevated cluster.
Rates are violent offenses per 100,000 residents. No final 2026 state crime rates are available; this ranking uses the latest complete 2024 estimates as a 2026 snapshot.
Methodology
The ranking orders the 50 U.S. states by violent crime rate, defined as reported violent offenses per 100,000 residents. Violent crime covers murder and nonnegligent manslaughter, rape, robbery and aggravated assault. Property crime is displayed as a comparison column and covers burglary, larceny-theft and motor vehicle theft.
The data year is 2024 because it is the latest complete state-estimate year available from the FBI UCR / Crime Data Explorer at the time of this May 3, 2026 update. The word “2026” therefore identifies the publication snapshot, not the year in which the crimes occurred. Participating agencies submitted data through NIBRS and SRS, and the FBI estimated state rates from reported law-enforcement data. Preliminary monthly feeds and partial-year reports can be useful for trend monitoring, but they are not the same as a complete state ranking.
Values are rates per 100,000 residents and are rounded to one decimal place. Washington, D.C. is excluded because the requested scope is U.S. states. When two states have nearly identical rounded values, the order follows the unrounded source order. These estimates improve comparability across states of different population sizes, but they do not remove all measurement limits.
These are reported crimes known to law enforcement, not all crimes experienced by residents. Non-reporting, agency participation, reporting-system changes and estimation methods can affect comparability across states. USAFacts also flags limited 2024 data availability for Florida, so Florida should be interpreted with extra caution. The ranking should be read as a high-level indicator of reported crime known to law enforcement, not as a complete measure of personal safety or victimization risk.
Full 50-state table: violent crime rate ranking, latest available data
Use the controls to search, sort or limit the visible rows. The full ranking covers all 50 states, and the Top 10 and Top 20 filters refer to the original violent-crime rank.
| Rank | State | Violent crime rate | Property crime rate |
|---|---|---|---|
| 1 | Alaska | 724.1 | 1,711.2 |
| 2 | New Mexico | 717.1 | 2,751.1 |
| 3 | Tennessee | 592.3 | 2,032.1 |
| 4 | Arkansas | 579.4 | 1,929.5 |
| 5 | Louisiana | 519.8 | 2,296.4 |
| 6 | California | 486.0 | 2,078.4 |
| 7 | Colorado | 476.3 | 2,592.8 |
| 8 | Missouri | 462.0 | 1,941.2 |
| 9 | Kansas | 438.7 | 1,956.4 |
| 10 | South Carolina | 436.7 | 1,965.8 |
| 11 | Michigan | 434.3 | 1,378.9 |
| 12 | Montana | 423.5 | 1,617.3 |
| 13 | Oklahoma | 422.8 | 1,977.7 |
| 14 | Arizona | 421.9 | 1,792.1 |
| 15 | Maryland | 420.4 | 2,049.6 |
| 16 | Nevada | 402.0 | 2,197.0 |
| 17 | Texas | 389.4 | 2,040.5 |
| 18 | New York | 380.2 | 1,719.5 |
| 19 | North Carolina | 375.8 | 1,968.1 |
| 20 | South Dakota | 362.3 | 1,586.0 |
| 21 | Delaware | 360.8 | 1,745.8 |
| 22 | Alabama | 359.9 | 1,565.1 |
| 23 | Oregon | 331.0 | 2,388.0 |
| 24 | Washington | 326.1 | 2,466.5 |
| 25 | Georgia | 325.7 | 1,674.9 |
| 26 | Massachusetts | 314.7 | 1,112.1 |
| 27 | Indiana | 312.9 | 1,378.6 |
| 28 | Ohio | 293.7 | 1,551.2 |
| 29 | Illinois | 289.2 | 1,715.2 |
| 30 | Wisconsin | 278.5 | 1,154.1 |
| 31 | FloridaLimited 2024 data availability noted by USAFacts | 267.1 | 1,420.4 |
| 32 | Minnesota | 256.6 | 1,606.3 |
| 33 | North Dakota | 254.3 | 1,682.1 |
| 34 | West Virginia | 248.8 | 1,161.9 |
| 35 | Pennsylvania | 245.6 | 1,435.0 |
| 36 | Iowa | 243.3 | 1,296.8 |
| 37 | Idaho | 230.6 | 736.3 |
| 38 | Utah | 229.6 | 1,408.9 |
| 39 | Nebraska | 220.5 | 1,626.7 |
| 40 | Vermont | 219.1 | 1,627.5 |
| 41 | Virginia | 217.9 | 1,569.7 |
| 42 | Hawaii | 217.7 | 1,946.8 |
| 43 | New Jersey | 217.7 | 1,427.3 |
| 44 | Kentucky | 213.1 | 1,349.9 |
| 45 | Mississippi | 210.5 | 1,363.0 |
| 46 | Wyoming | 203.4 | 1,231.9 |
| 47 | Rhode Island | 153.6 | 1,032.4 |
| 48 | Connecticut | 136.0 | 1,366.1 |
| 49 | New Hampshire | 110.1 | 918.0 |
| 50 | Maine | 100.1 | 1,142.1 |
Insights from the 2026 crime-rate snapshot
What this means for readers
For residents, people comparing relocation options and researchers, the ranking is useful as a starting point before checking local data. A high state rate signals that county, city and neighborhood data should be checked before drawing conclusions. It should not be used by itself to choose a neighborhood, school district or travel destination.
For policy readers, the split between violent and property crime matters. Violent crime points toward questions about assault, robbery, firearm violence, policing, emergency response and community violence prevention. Property crime points more strongly toward theft prevention, vehicle security, insurance exposure and repeat-offense patterns. For insurance, relocation or local policy decisions, state rates should be paired with city-level FBI/CDE data, local police dashboards and victimization indicators where available.
For anyone comparing state safety data, the main caution is wording. “Crime rate” can mean violent crime, property crime, overall indexed offenses, victimization survey results or specific offenses such as homicide. Violent crime is the ranking metric; property crime is included so different public-safety problems are not compressed into one number.
FAQ
Is this a 2026 crime rate?
No. It is a 2026 snapshot using the latest complete state estimates available for all 50 states, which are 2024 FBI UCR / Crime Data Explorer estimates. Treating it as final 2026 data would be misleading.
Why rank by violent crime instead of adding violent and property crime together?
Adding the two can be useful for a broad “indexed crime” view, but property crime usually dominates the combined total because larceny-theft is much more frequent than violent offenses. Ranking by violent crime gives a clearer view of serious violent offenses against people, while the table keeps property crime visible for context.
Does a high state rank mean every city in that state is unsafe?
No. State averages can hide large differences between cities, suburbs, rural counties and tourist areas. A state-level ranking is a starting point for comparison, not a replacement for local crime maps and neighborhood-level data.
Do FBI crime rates include every crime that happened?
No. These are law-enforcement reported and estimated offenses. Some incidents are never reported to police, and reporting practices can differ across jurisdictions. Victimization surveys can show a broader picture, but they are not the same dataset as the FBI state estimates used here.
Why is Washington, D.C. excluded?
The source dataset includes the District of Columbia, but this page is titled and scoped to U.S. states. D.C. is therefore excluded from the 50-row table to keep the ranking consistent with the page title.
Sources
-
Federal Bureau of Investigation — Uniform Crime Reporting Program and Crime Data Explorer.
Main federal source for U.S. crime statistics and state-level estimates.
https://cde.ucr.cjis.gov/ -
FBI — 2024 Reported Crimes in the Nation statistics.
National release context for the 2024 crime data cycle and FBI reporting coverage.
https://www.fbi.gov/news/press-releases/fbi-releases-2024-reported-crimes-in-the-nation-statistics -
USAFacts — state crime-rate explainers.
Public cross-check for state-level 2024 violent and property crime rates, definitions and Florida data-availability note.
https://usafacts.org/articles/which-states-have-the-least-and-most-crime/ -
Bureau of Justice Statistics — Crime Known to Law Enforcement, 2024.
Methodological and national context for crime known to law enforcement.
https://bjs.ojp.gov/library/publications/crime-known-law-enforcement-2024
Updated May 3, 2026. Data year: 2024. Status: latest available state estimates used as a 2026 snapshot.
Related rankings
More StatRanker pages connected by topic, category or ranking theme.
California Cities by Crime Rate, Latest Official Data
Open rankingUS Cities by Crime Rate, 2026
Open rankingStatRanker (Website)
administrator
