


Countries with the Highest Bank NPL Ratios: 2026
Economy · banking stability · 2026 snapshot Reported Bank Loan Stress by Country This ranking compares countries and areas by

Economy · banking stability · 2026 snapshot Reported Bank Loan Stress by Country This ranking compares countries and areas by
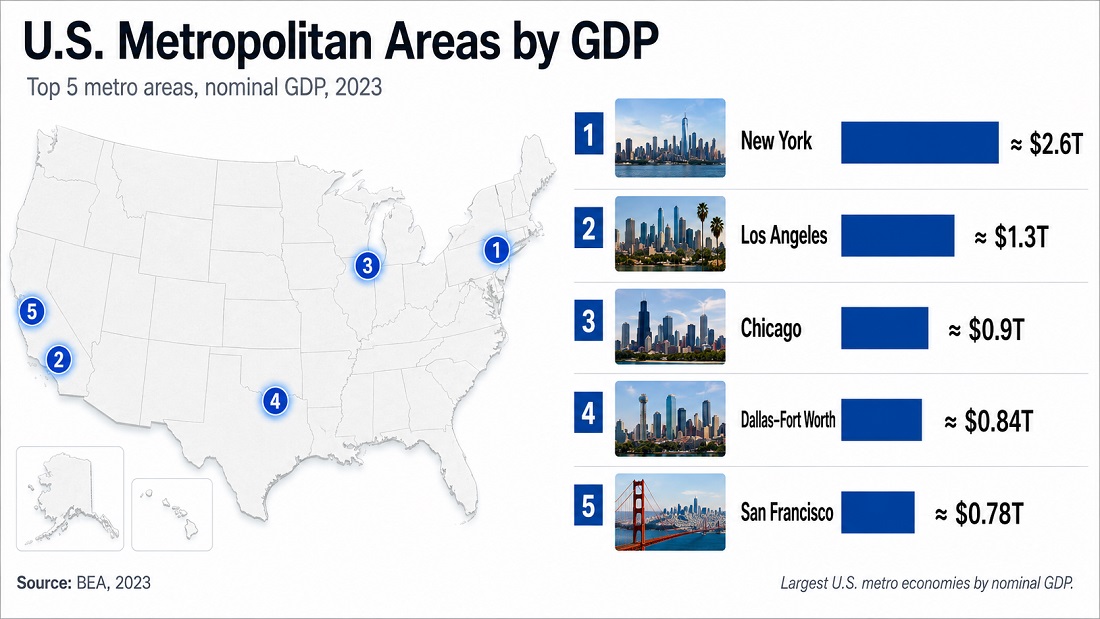
U.S. metropolitan economy · 2026 snapshot based on latest available 2024 county GDP Top 50 U.S. Metropolitan Areas by GDP
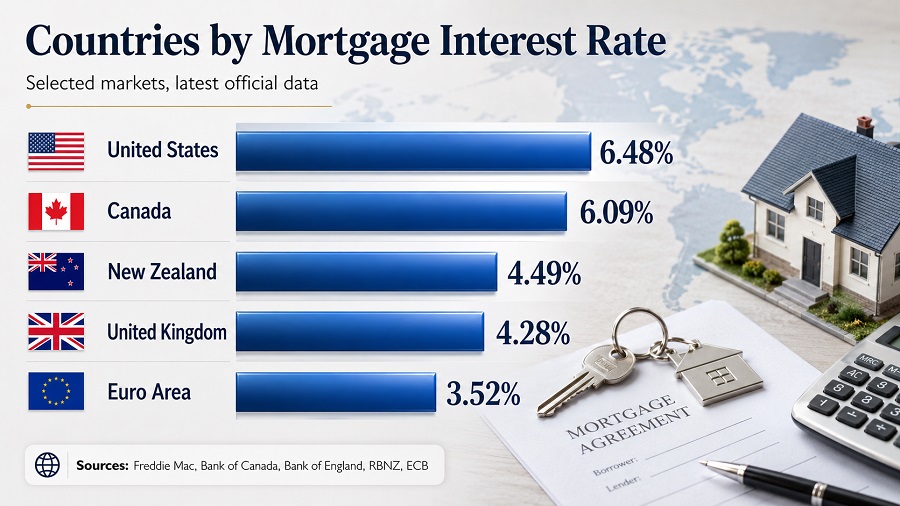
Housing finance · official-source rows · 2026 snapshot Countries by Mortgage Interest Rate, 2026 This ranking compares confirmed country entries

Economy · Labor market · Latest available year Labor force participation rate (15+) measures the share of people aged 15
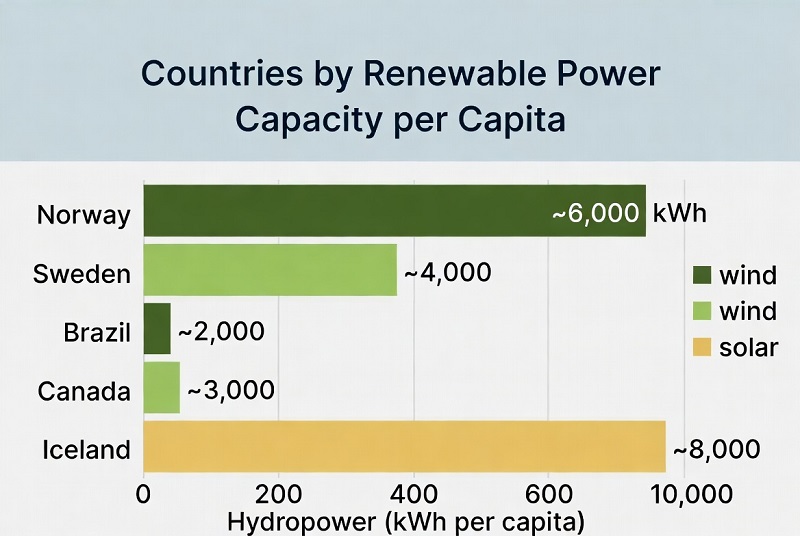
Renewable power capacity per person changes the ranking lens Installed renewable power per person highlights a different side of the
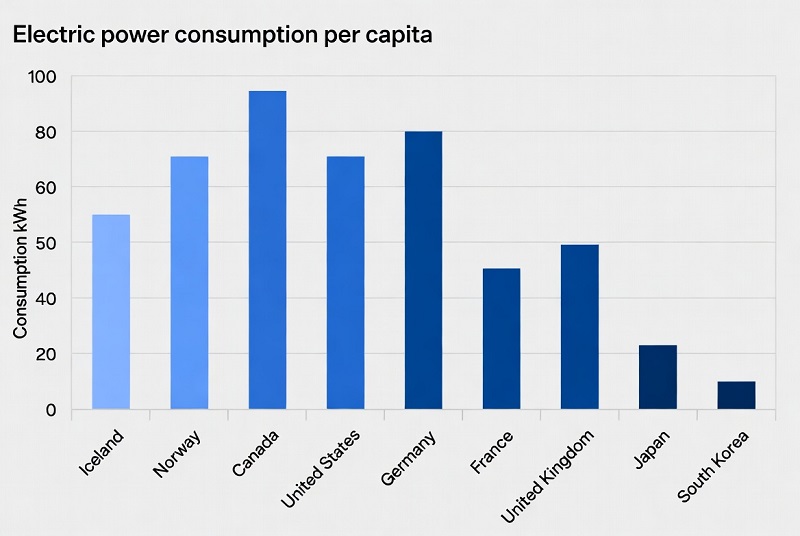
Energy · Utilities · Infrastructure What electric power consumption per capita shows in the latest World Bank / IEA comparison

Geopolitics · Defense budgets · SIPRI How military expenditure as a share of GDP shows defense burden in 2025 Military
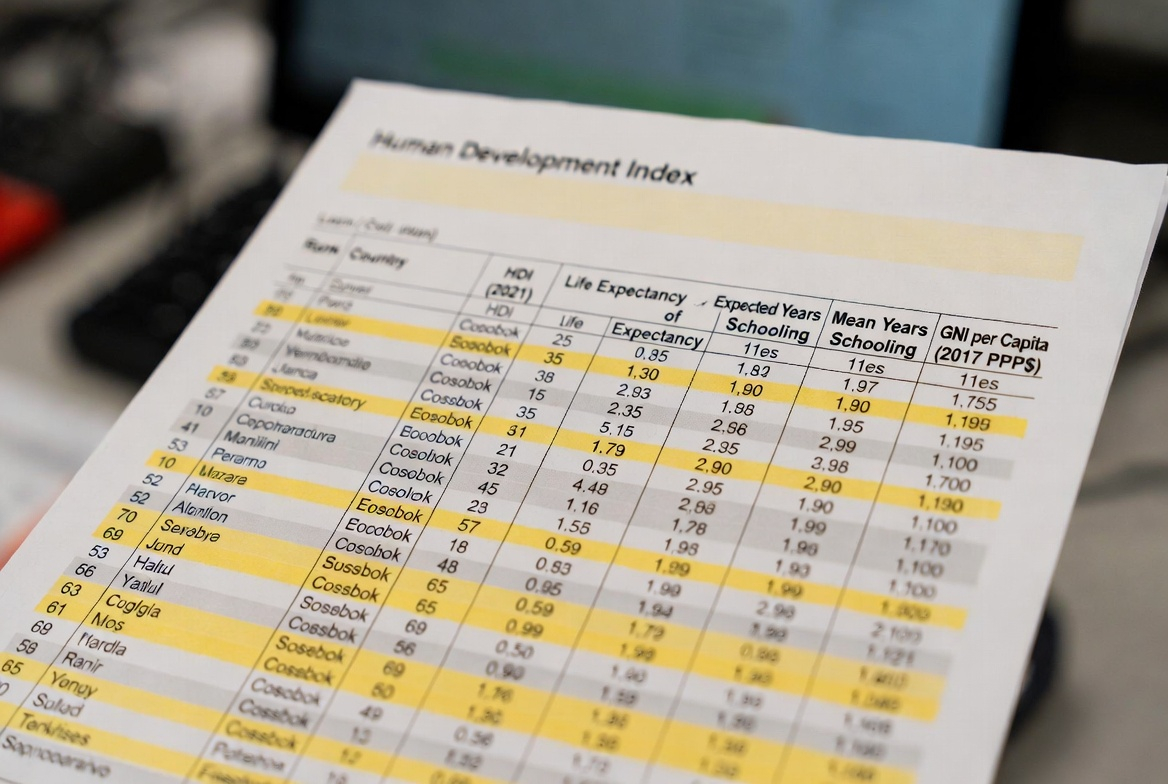
Society · Development · Composite index HDI Ranking 2025: Top 100 Countries by Human Development Index The HDI Ranking 2025
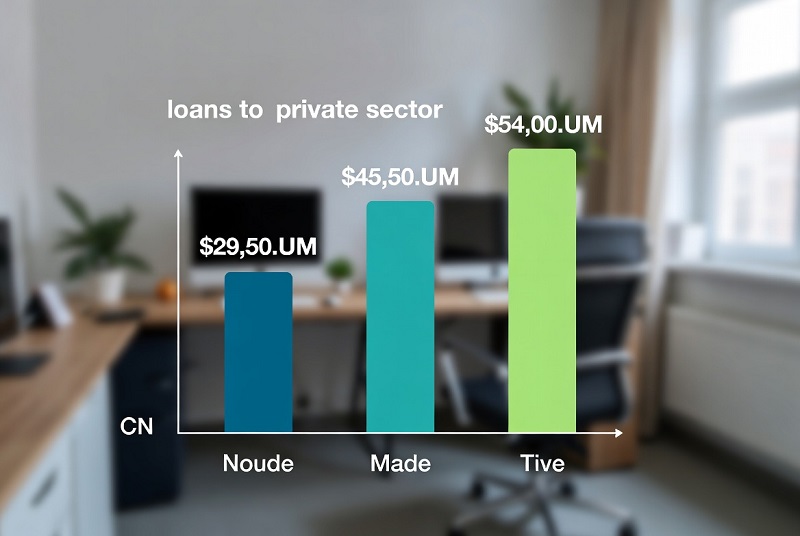
Private credit depth (bank lending to the private sector) This benchmark tracks how large bank credit to households and non-financial

Metric: Interest payments (% of revenue) Snapshot: latest available year (often 2022–2024) Coverage: government reporting varies by country When interest
Economy · Prices · Monetary stability Inflation volatility is not the same as high inflation. A country can experience persistently
External sector · Balance of payments Countries by current account balance (% of GDP) — 2025 snapshot (latest full-year data
Economy · Macroeconomics · Growth Updated: April 29, 2026 Fastest-growing economies by real GDP growth in 2025 Real GDP growth

Global Labour Market • Youth unemployment Youth Unemployment Ranking: What the 2025 Data Shows About Young Jobseekers Updated: April 27,

IMF DataMapper · unemployment rate · 2025 Highest unemployment rates in the IMF 2025 labour-market snapshot The ranking compares unemployment

Real Interest Rate Ranking, 2025 Snapshot Real interest rate measures the cost of borrowing after inflation is taken into account.

Economy · Macroeconomics · Dec 2025 snapshot Central bank policy rates show where monetary pressure was still highest at the

Youth NEET 2025 Countries with the lowest NEET rates When we talk about youth not in employment, education or training

Remittances · 2025 analytical snapshot · current USD per resident Countries by Remittance Inflows per Capita: 2025 Snapshot Based on

E-Commerce · Digital Retail · Per Capita Rankings Ranking countries by total online sales creates a distorted picture dominated by
Why Small, Specialized Economies Dominate the Highest PPP GDP per Capita Rankings GDP per capita adjusted for purchasing power parity

Technology · Semiconductors · 2025 snapshot How to read the 2025 microchip cycle without confusing revenue with manufacturing depth “Microchip
Economy · Macroeconomics · Purchasing power parity GDP (PPP) in 2025: the clearest way to compare real economic scale across

Macroeconomics · resource dependency · economic diversification How resource-dependent economies build broader growth models Economic diversification is the long-term process

The Role of ESG Factors in G20 Macroeconomic Forecasts In 2025, Environmental, Social, and Governance (ESG) factors have emerged as

Macroeconomics · Global trade · Supply-chain resilience How Supply Chain Resilience Shapes Inflation, Growth and Economic Stability Global supply chains

In 2025, Central Bank Digital Currencies (CBDCs) are reshaping the global financial landscape, prompting intense debate about their macroeconomic implications.
