

Top 100 Countries by Human Development Index (HDI) — Latest UNDP Ranking
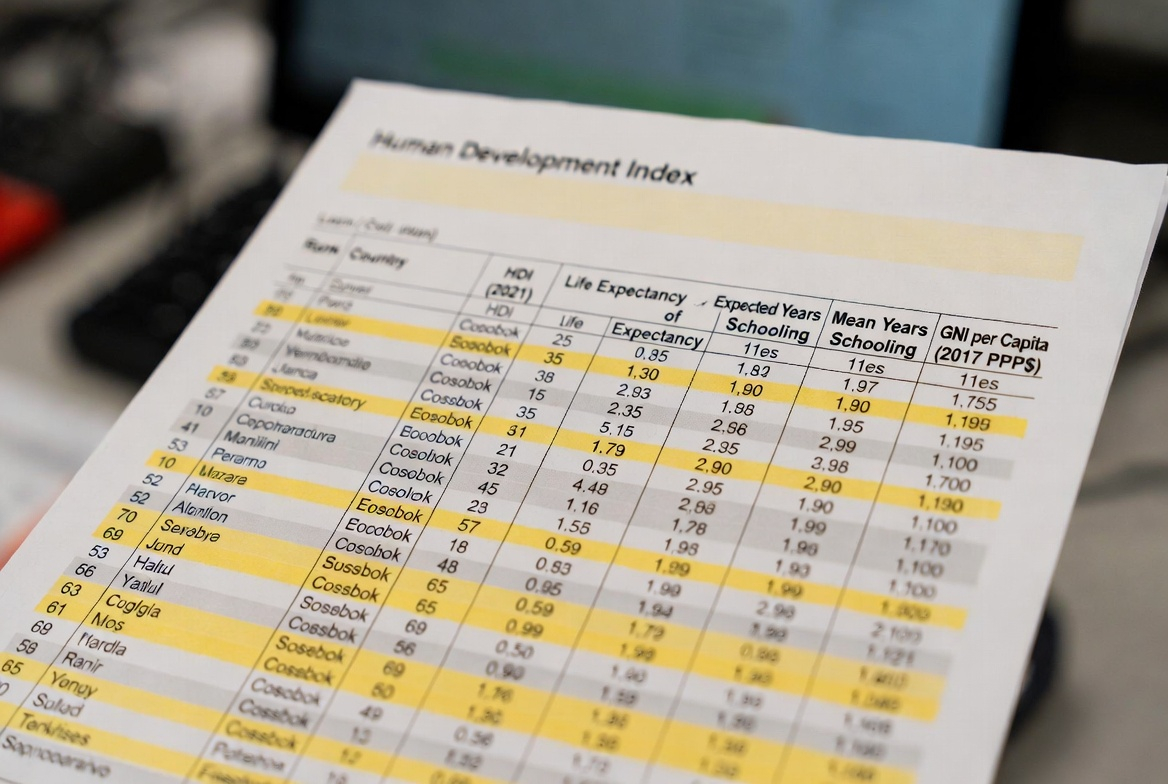
HDI Ranking 2025: Top 100 Countries by Human Development Index
The HDI Ranking 2025 ranks countries by the latest UNDP Human Development Index values, published in the Human Development Report 2025 with underlying country values for 2023. The Human Development Index (HDI) compares human development across countries by combining life expectancy (health), years of schooling (education), and gross national income per person (standard of living) into one index between 0 and 1.
The edition year is 2025; the measured country values are 2023. The ranking is therefore best read as the latest available UNDP HDI table, not as a calendar-year 2025 measurement. Where available, the table also shows a simple rank change versus 2022 to show movement in the most recent UNDP update.
Answer: Iceland ranks #1 in the HDI Ranking 2025 with an HDI value of 0.972. Norway and Switzerland share rank #2 at 0.970, Denmark ranks #4 at 0.962, and Germany and Sweden share rank #5 at 0.959. The values are the latest UNDP 2023 HDI values published in the HDR 2025 edition.
Continue exploring
More StatRanker pages connected by topic, category or ranking theme.
Top 10 countries by Human Development Index in the HDI Ranking 2025
At the frontier, the Human Development Index ranking is dominated by countries that deliver long lives, maintain high learning outcomes, and sustain high incomes at the same time. It is not a richest-countries list; it is a scoreboard for balanced human development.
Consistently strong outcomes in life expectancy, schooling, and income produce one of the world’s highest composite development scores.
A high-income, high-trust model with strong health outcomes and broad access to education keeps Norway at the very top of HDI.
High productivity and long life expectancy combine with strong education outcomes, placing Switzerland among the global leaders.
High living standards, robust public services, and consistently strong education results lift Denmark’s HDI to the global frontier.
A large advanced economy that pairs high incomes with broad educational attainment and long life expectancy.
High schooling, strong health outcomes, and stable prosperity keep Sweden in the top tier of human development.
High life expectancy and strong education outcomes underpin Australia’s position among the top HDI performers.
Exceptional longevity and strong educational attainment support a very high HDI in one of Asia’s leading hubs.
A long-run leader in education and health with high incomes, maintaining a top-10 place in the composite ranking.
High education and health outcomes, alongside strong income levels, keep Belgium firmly in the very-high HDI group.
Table 1. Top 10 countries by HDI — HDR 2025 edition, 2023 values
| Rank | Country | HDI (index) |
|---|---|---|
| 1 | Iceland | 0.972 |
| 2 | Norway | 0.970 |
| 2 | Switzerland | 0.970 |
| 4 | Denmark | 0.962 |
| 5 | Germany | 0.959 |
| 5 | Sweden | 0.959 |
| 7 | Australia | 0.958 |
| 8 | Hong Kong, China (SAR) | 0.955 |
| 8 | Netherlands | 0.955 |
| 10 | Belgium | 0.951 |
Ranks can repeat when countries have the same HDI value at the reported precision. The Top 10 block contains 10 country entries, not 10 unique rank numbers. The full Top 100 table appears below.
Chart 1. Top 20 HDI values — HDR 2025 edition, 2023 values
Top 20 HDI values
- Iceland0.972
- Norway0.970
- Switzerland0.970
- Denmark0.962
- Germany0.959
- Sweden0.959
- Australia0.958
- Hong Kong, China (SAR)0.955
- Netherlands0.955
- Belgium0.951
- Ireland0.949
- Finland0.948
- Singapore0.946
- United Kingdom0.946
- United Arab Emirates0.940
- Canada0.939
- Liechtenstein0.938
- New Zealand0.938
- United States0.938
- Korea (Republic of)0.937
HDI is shown on a 0–1 scale. The differences near the top are small in absolute terms, so ranking changes can occur with modest shifts in health, schooling, or income.
Methodology: how UNDP calculates the Human Development Index
In the HDR 2025 edition, the latest reported HDI values are for 2023. The HDI is produced by UNDP as a geometric mean of three normalized dimension indices: (1) health measured by life expectancy at birth, (2) education measured by expected years of schooling (children) and mean years of schooling (adults), and (3) standard of living measured by gross national income (GNI) per capita in PPP terms (with income logged to reflect diminishing returns). Because the index is geometric, weak performance in one dimension is harder to “compensate” with extreme strength in another.
This ranking uses the latest HDR statistical annex (HDR 2025) as the authoritative release for 2023 values. The “Δ rank” column compares the reported 2023 rank to the reported 2022 rank where both are available. Values are shown at the precision provided in the statistical annex.
Key limitations to keep in mind: HDI is a national average and does not show inequality or within-country gaps; it does not capture dimensions such as safety, political freedoms, or environmental sustainability; and some inputs are subject to reporting lags and periodic revisions (including PPP-related income revisions). For distribution-sensitive comparisons, UNDP provides complementary indices such as the IHDI (inequality-adjusted HDI) and the PHDI (planetary pressures–adjusted HDI).
Key insights from the HDI Ranking 2025 edition
- Europe’s institutional advantage still shows up: many top positions combine longevity, educational attainment, and high incomes at once.
- Asia’s leading hubs are present, but the composite matters: strong income alone is not enough—education and health systems are the difference-makers.
- Convergence is visible in Central and Eastern Europe: a growing share of countries sit in the “very high” group, reflecting decades of progress in schooling and life expectancy.
- Resource-rich does not automatically mean top-tier HDI: high income can raise the index, but gaps in education/health (or uneven access) can limit the composite score.
- Small differences can move ranks: at the frontier, HDI values are clustered, so minor revisions or marginal changes can shift placements.
What this means for readers
Use HDI when you need a balanced snapshot—not just a money metric. For relocation or study decisions, it helps you compare “people outcomes” across countries (education and health alongside incomes). For investors and analysts, it is a quick way to understand human-capital environments that often correlate with productivity, institutional capacity, and long-run demand.
If your question is primarily about purchasing power and consumption capacity, a PPP-income ranking is more direct. If your question is about human capability—how long people live, how much they learn, and what living standards support that—HDI is the better starting point.
FAQ: Human Development Index (HDI)
Which country ranks first in the HDI Ranking 2025?
Iceland ranks first in the HDI Ranking 2025, with a 2023 HDI value of 0.972 in the UNDP Human Development Report 2025 edition.
Is HDI the same as “richest countries” or GDP per capita?
No. HDI includes income, but it also requires strong health and education outcomes. A country can be very rich and still rank below the top tier if education or longevity is weaker, or if progress is uneven.
Why can two countries with similar income have very different HDI ranks?
Because the non-income dimensions matter. Differences in life expectancy, schooling years, and education outcomes can shift the composite score even when income is similar.
Why do some ranks repeat?
UNDP reports HDI values at a defined precision. If two countries share the same value at that precision, they can share a rank.
What does “Δ rank” mean in the tables?
It is a simple comparison of the reported 2023 rank to the reported 2022 rank. A positive number means a country moved up the table (better rank); a negative number means it moved down.
Can HDI go down even when GDP grows?
Yes. GDP growth does not guarantee better outcomes in life expectancy or education, and income gains can be uneven. HDI reflects the balance of the three dimensions.
What should I use if I care about inequality or sustainability?
Use UNDP’s complementary indices such as the Inequality-adjusted HDI (IHDI) and the Planetary pressures–adjusted HDI (PHDI), which adjust the headline score for distribution and environmental pressures.
HDI Ranking 2025 Table: Top 100 Countries Using Latest UNDP 2023 Values
The table below lists the Top 100 countries by the Human Development Index (HDI) in the HDR 2025 release, using the latest available 2023 values. Use the controls to search, filter by region and development group, sort by value or rank change, and switch the value display between the HDI index and % of the 1.000 frontier.
Table 2. HDI Ranking 2025: Top 100 countries by Human Development Index
| Rank | Country | Value | Δ rank |
|---|---|---|---|
| 1 | Iceland | 0.97297.20% | +2 |
| 2 | Norway | 0.97097.00% | −1 |
| 2 | Switzerland | 0.97097.00% | 0 |
| 4 | Denmark | 0.96296.20% | 0 |
| 5 | Germany | 0.95995.90% | +1 |
| 5 | Sweden | 0.95995.90% | −1 |
| 7 | Australia | 0.95895.80% | +1 |
| 8 | Hong Kong, China (SAR) | 0.95595.50% | +1 |
| 8 | Netherlands | 0.95595.50% | −1 |
| 10 | Belgium | 0.95195.10% | +3 |
| 11 | Ireland | 0.94994.90% | −1 |
| 12 | Finland | 0.94894.80% | −1 |
| 13 | Singapore | 0.94694.60% | +1 |
| 13 | United Kingdom | 0.94694.60% | −2 |
| 15 | United Arab Emirates | 0.94094.00% | +8 |
| 16 | Canada | 0.93993.90% | 0 |
| 17 | Liechtenstein | 0.93893.80% | −2 |
| 17 | New Zealand | 0.93893.80% | 0 |
| 17 | United States | 0.93893.80% | +1 |
| 20 | Korea (Republic of) | 0.93793.70% | −1 |
| 21 | Slovenia | 0.93193.10% | 0 |
| 22 | Austria | 0.93093.00% | −2 |
| 23 | Japan | 0.92592.50% | 0 |
| 24 | Malta | 0.92492.40% | +2 |
| 25 | Luxembourg | 0.92292.20% | −3 |
| 26 | France | 0.92092.00% | +1 |
| 27 | Israel | 0.91991.90% | −4 |
| 28 | Spain | 0.91891.80% | 0 |
| 29 | Czechia | 0.91591.50% | −1 |
| 29 | Italy | 0.91591.50% | +3 |
| 29 | San Marino | 0.91591.50% | +1 |
| 32 | Andorra | 0.91391.30% | +5 |
| 32 | Cyprus | 0.91391.30% | −1 |
| 34 | Greece | 0.90890.80% | +2 |
| 35 | Poland | 0.90690.60% | −2 |
| 36 | Estonia | 0.90590.50% | −3 |
| 37 | Saudi Arabia | 0.90090.00% | 0 |
| 38 | Bahrain | 0.89989.90% | −5 |
| 39 | Lithuania | 0.89589.50% | 0 |
| 40 | Portugal | 0.89089.00% | +1 |
| 41 | Croatia | 0.88988.90% | −1 |
| 41 | Latvia | 0.88988.90% | +2 |
| 43 | Qatar | 0.88688.60% | −2 |
| 44 | Slovakia | 0.88088.00% | 0 |
| 45 | Chile | 0.87887.80% | 0 |
| 46 | Hungary | 0.87087.00% | 0 |
| 47 | Argentina | 0.86586.50% | 0 |
| 48 | Montenegro | 0.86286.20% | 0 |
| 48 | Uruguay | 0.86286.20% | +2 |
| 50 | Oman | 0.85885.80% | +2 |
| 51 | Türkiye | 0.85385.30% | −3 |
| 52 | Kuwait | 0.85285.20% | +1 |
| 53 | Antigua and Barbuda | 0.85185.10% | −2 |
| 54 | Seychelles | 0.84884.80% | +2 |
| 55 | Bulgaria | 0.84584.50% | +2 |
| 55 | Romania | 0.84584.50% | −1 |
| 57 | Georgia | 0.84484.40% | −2 |
| 58 | Saint Kitts and Nevis | 0.84084.00% | +2 |
| 59 | Panama | 0.83983.90% | −2 |
| 60 | Brunei Darussalam | 0.83783.70% | +3 |
| 60 | Kazakhstan | 0.83783.70% | −1 |
| 62 | Costa Rica | 0.83383.30% | +3 |
| 62 | Serbia | 0.83383.30% | −1 |
| 64 | Russian Federation | 0.83283.20% | −3 |
| 65 | Belarus | 0.82482.40% | −1 |
| 66 | Bahamas | 0.82082.00% | 0 |
| 67 | Malaysia | 0.81981.90% | +1 |
| 68 | North Macedonia | 0.81581.50% | −1 |
| 69 | Armenia | 0.81181.10% | +3 |
| 69 | Barbados | 0.81181.10% | 0 |
| 71 | Albania | 0.81081.00% | −1 |
| 72 | Trinidad and Tobago | 0.80780.70% | −1 |
| 73 | Mauritius | 0.80680.60% | +2 |
| 74 | Bosnia and Herzegovina | 0.80480.40% | −1 |
| 75 | Iran (Islamic Republic of) | 0.79979.90% | +2 |
| 76 | Saint Vincent and the Grenadines | 0.79879.80% | −1 |
| 76 | Thailand | 0.79879.80% | +2 |
| 78 | China | 0.79779.70% | −4 |
| 79 | Peru | 0.79479.40% | 0 |
| 80 | Grenada | 0.79179.10% | 0 |
| 81 | Azerbaijan | 0.78978.90% | +1 |
| 81 | Mexico | 0.78978.90% | +3 |
| 83 | Colombia | 0.78878.80% | +2 |
| 84 | Brazil | 0.78678.60% | +2 |
| 84 | Palau | 0.78678.60% | −3 |
| 86 | Moldova (Republic of) | 0.78578.50% | −4 |
| 87 | Ukraine | 0.77977.90% | +3 |
| 88 | Ecuador | 0.77777.70% | +1 |
| 89 | Dominican Republic | 0.77677.60% | −2 |
| 89 | Guyana | 0.77677.60% | +6 |
| 89 | Sri Lanka | 0.77677.60% | −1 |
| 92 | Tonga | 0.76976.90% | −1 |
| 93 | Maldives | 0.76676.60% | −2 |
| 93 | Viet Nam | 0.76676.60% | −2 |
| 95 | Turkmenistan | 0.76476.40% | +1 |
| 96 | Algeria | 0.76376.30% | 0 |
| 97 | Cuba | 0.76276.20% | −6 |
| 98 | Dominica | 0.76176.10% | 0 |
| 99 | Paraguay | 0.75675.60% | +3 |
| 100 | Egypt | 0.75475.40% | 0 |
“Δ rank” compares reported 2023 rank to reported 2022 rank. Positive = moved up (better rank). Source: UNDP Human Development Report 2025 statistical annex (HDI table). Values shown as reported. The table is capped at 100 country entries; Jordan also shares UNDP rank 100 but is outside the 100-entry cut-off used here.
Figure 2. HDI vs income (GNI per capita, PPP) among the Top 100
HDI is correlated with income, but it is not an income ranking: countries with similar GNI per person can differ in HDI because education attainment and longevity vary. The scatter plot uses GNI per capita from the HDI table (PPP) on the x-axis and HDI on the y-axis.
Sample points
| Country | GNI per capita (PPP) | HDI |
|---|---|---|
| Iceland | 69.1k | 0.972 |
| Norway | 112.7k | 0.970 |
| Switzerland | 81.9k | 0.970 |
| Denmark | 76.0k | 0.962 |
| Germany | 64.1k | 0.959 |
| Sweden | 66.1k | 0.959 |
| Australia | 58.3k | 0.958 |
| Hong Kong, China (SAR) | 69.4k | 0.955 |
| Netherlands | 68.3k | 0.955 |
| Belgium | 63.6k | 0.951 |
X-axis is GNI per capita in thousands of 2021 PPP dollars; Y-axis is HDI (0–1). This is an illustrative “level vs outcome” view, not a causal model.
How to interpret the HDI Ranking 2025 without confusing it with wealth rankings
The HDI ranking is best read as a three-dimensional scoreboard. Income matters, but it is only one leg of the stool. Countries rise to the top when they achieve a long, healthy life, build a strong education base, and sustain a decent standard of living at the same time.
This is why HDI should not be read as another GDP-per-capita table. Two countries can look similar in PPP income yet differ in HDI because one delivers longer lives and more schooling. Conversely, a country can rank very high in HDI without being the absolute top in PPP income if it performs exceptionally in health and education.
Reading guide: what to look at first
Step 1: Start with the HDI value (0–1). In the top tier, even a 0.01 difference is meaningful because scores are clustered.
- Step 2: Check whether the country’s position is driven mainly by income or by health/education strength.
- Step 3: Use “Δ rank” as a direction signal, not a verdict—small updates can move ranks near the frontier.
- Step 4: If you care about distribution, look at complementary indices (IHDI, GDI, GII, MPI, PHDI).
HDI should not be treated as proof that one policy model is superior. The index is descriptive, not prescriptive: it shows where outcomes are strong and where they lag, but it does not identify which reforms caused the change. It works best as a starting point for deeper country analysis.
Policy takeaways (why the composite structure matters)
- Health and education are growth infrastructure: they raise productivity and make income gains more durable.
- Income can lift HDI, but only to a point: with logged income and geometric averaging, progress requires balanced gains.
- Near the top, marginal improvements are hard: frontier countries compete on longevity, quality of schooling, and inclusion.
- For “high” HDI countries, the next step is resilience: reducing internal disparities and protecting progress during shocks.
- For “medium/low” HDI countries outside the Top 100: the priority is foundational health access and schooling completion, alongside basic income growth.
For investment or relocation screening, HDI is stronger when paired with indicators for safety, governance, labour markets and cost of living. HDI describes the capabilities baseline; it does not fully describe day-to-day conditions.
Official sources for the HDI Ranking 2025
These are the primary sources for the data used here. The original UNDP files and technical notes provide the full definitions, metadata and revision history.
-
UNDP Human Development Data Center — Human Development Index (HDI)https://hdr.undp.org/data-center/human-development-index
-
Human Development Report 2025 — report pagehttps://hdr.undp.org/content/human-development-report-2025
-
HDR 2025 Statistical Annex — Table 1 (HDI and components), XLSXhttps://hdr.undp.org/sites/default/files/2025_HDR/HDR25_Statistical_Annex_HDI_Table.xlsx
-
HDR 2025 Statistical Annex — Table 1 (PDF)https://hdr.undp.org/sites/default/files/2025_HDR/HDR25_Statistical_Annex_HDI_Table.pdf
-
Documentation & downloads (all HDR tables, metadata, and technical notes)https://hdr.undp.org/data-center/documentation-and-downloads
Related rankings
More StatRanker pages connected by topic, category or ranking theme.
Top 100 Countries by Labor Force Participation Rate (15+), Latest Year
Open rankingTop 100 Countries by Renewable Power Capacity per Capita in 2025
Open rankingTop 100 Countries by Electric Power Consumption per Capita (Latest Year)
Open rankingTop 100 Countries by Military Expenditure (% of GDP), 2025
Open ranking
StatRanker (Website)
administrator
