


Top Countries by Passenger Car Production, 2025 Snapshot
Mobility · Manufacturing · Passenger cars Top 44 Countries and Territories with Positive Passenger Car Production, OICA 2024 Data Passenger

Mobility · Manufacturing · Passenger cars Top 44 Countries and Territories with Positive Passenger Car Production, OICA 2024 Data Passenger

Mobility, Transport & Vehicles · Air cargo · 2026 snapshot Busiest cargo airports by handled tonnes Airport cargo volume measures

Airports · international passengers · 2026 edition The airports handling the largest international passenger flows This page ranks airports by

Mobility · aviation · 2026 update Where global airport passenger demand concentrated in 2025 Passenger traffic measures how many travelers
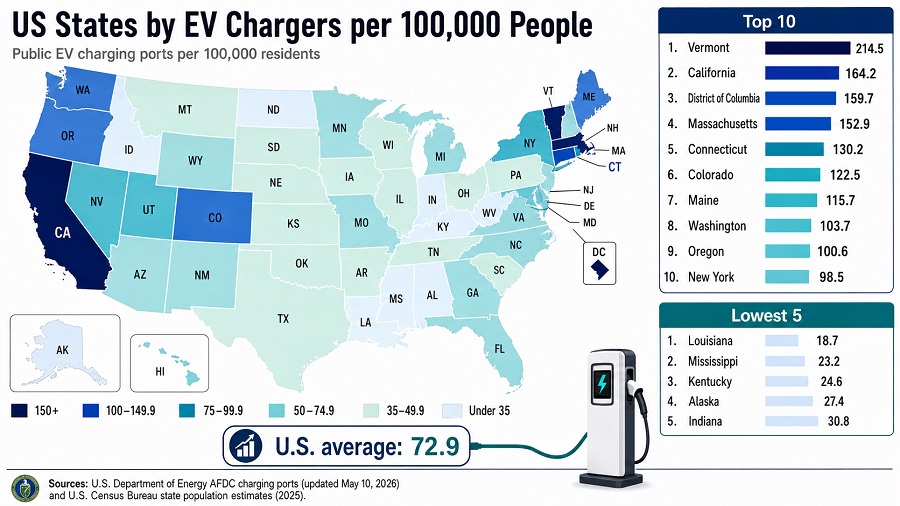
Where Public EV Charging Is Most Available per Resident EV charging density by state Public charging access varies sharply across

Global Automotive Group Sales Leaders Based on 2025 Reported Volumes This ranking compares global automotive groups by reported 2025 vehicle

2025 Passenger Traffic Snapshot Behind the Latest Airport Ranking Passenger traffic measures the total number of passengers handled by an

Which Airlines Carry the Most Passengers in the 2026 Traffic Snapshot? Updated: May 2, 2026 · Metric: annual passengers carried,

Mobility · Aviation · Latest fully comparable ranking Airline Passengers Carried by Country in 2021 Air transport passengers carried measures
Air transport · latest official country ranking A reliable way to compare the scale of national airline systems is registered

Mobility · Manufacturing · Passenger cars Passenger car production is not the same thing as total motor vehicle output. This

Global vehicle fleet age • safety • ownership cost Oldest car fleets: where “old vehicles” dominate — and why it
United States · Calendar year 2025 · Passenger cars & SUVs (fuel-focused) Top-selling brands by passenger car & SUV sales

All-in-one page — Part 1/3 Sales snapshot (unit sales) — by year, half-year, and region This section summarizes Mercedes-Benz unit

A model-level ranking of the world’s highest-volume vehicles in 2025, with a practical, publisher-friendly layout: overview, methodology, a Top 100
Top Electric Vehicles by Maximum Range (EPA Miles per Charge), 2025 Mobility • Rankings • 2025 Top Electric Vehicles by
StatRanker · Mobility This 2025 ranking focuses on real-world-friendly efficiency signals: EPA combined MPG for gasoline/hybrids and combined MPGe +

Mobility · Safety ranking · 2025 edition “Safest car” is not a single star rating, and it is not only

Mobility • Vehicle market “Best-selling” sounds simple until you define the unit of counting. In the U.S. market, sales leadership

“Most sold cars” sounds like a simple list. In practice it’s a measurement problem: the same badge on the trunk

Mobility · Auto Insurance · 2026 Edition Top 50 U.S. States by Average Car Insurance Cost (Full Coverage), 2026 The

Mobility • U.S. Insurance • 2026 composite ranking Composite score (0–100) Complaints • Claims • Financial strength Coverage & UX

“Cheapest” is only meaningful if everyone is priced on the same driver profile, the same coverage limits, and the same

Diesel Price Ranking Based on the 20-Apr-2026 Snapshot The ranking compares retail diesel prices in U.S. dollars per liter from

StatRanker · Automotive exports Automotive exports by country and territory: Top 100 ranking This ranking compares countries and territories by
Overview: Top 100 Most Reliable Car Models, 2025 Reliability is most actionable when it is comparable at the model level.

Overview This ranking compares countries by the estimated share of road traffic fatalities where alcohol impairment (above the national legal
