

Busiest Airports by Passenger Traffic: 2026 Update Based on 2025 Data
2025 Passenger Traffic Snapshot Behind the Latest Airport Ranking
Passenger traffic measures the total number of passengers handled by an airport in a year, normally counting arriving passengers, departing passengers and direct-transit passengers where reported. It is one of the clearest indicators of an airport’s real operating scale, route-network importance and pressure on terminals, runways, border control and ground transport.
The latest ACI World public release was published on April 14, 2026 and covers actual 2025 passenger traffic. The public release identifies the leading airports and gives the global traffic context. The ranking below presents 50 airports from the latest available public snapshot.
Key numbers in the actual 2025 airport traffic snapshot
ACI estimates that world airport passenger traffic reached about 9.8 billion in 2025, up 3.6% from 2024 and 7.3% above 2019. The figure describes actual annual passenger throughput, not a 2026 forecast.
Hartsfield-Jackson Atlanta International Airport remained first with 106,302,208 passengers in 2025.
Passenger growth in 2025 reflected international recovery, strong U.S. domestic demand and the later return of several Asia-Pacific route networks.
Overview: what the top of the airport ranking shows
The upper tier is split between very large domestic-market hubs and intercontinental transfer gateways. Atlanta, Dallas Fort Worth, Chicago O’Hare and Denver reflect the scale of the U.S. domestic market and hub-and-spoke airline networks. Dubai, Heathrow, Istanbul, Incheon and Singapore show how long-haul international flows can lift airport traffic far above what local origin-and-destination demand would suggest.
Asia-Pacific is back in the upper part of the table. Shanghai Pudong moved into the top five, Guangzhou Baiyun entered the top ten, and several Chinese airports occupy the middle of the Top 50. The pattern reflects domestic volume, restored international routes and expanded connectivity after the region’s later reopening cycle.
Top 20 airports by passenger traffic, 2025 snapshot
| Rank | Airport | Country | Passengers |
|---|---|---|---|
| 1 | Hartsfield-Jackson Atlanta International Airport | United States | 106,302,208 |
| 2 | Dubai International Airport | United Arab Emirates | 95,192,160 |
| 3 | Tokyo Haneda Airport | Japan | 91,679,814 |
| 4 | Dallas Fort Worth International Airport | United States | 85,660,127 |
| 5 | Shanghai Pudong International Airport | China | 84,994,227 |
| 6 | O'Hare International Airport | United States | 84,814,099 |
| 7 | Heathrow Airport | United Kingdom | 84,482,126 |
| 8 | Istanbul Airport | Turkey | 84,437,710 |
| 9 | Guangzhou Baiyun International Airport | China | 83,582,952 |
| 10 | Denver International Airport | United States | 82,427,962 |
| 11 | Indira Gandhi International Airport | India | 79,259,890 |
| 12 | Seoul Incheon International Airport | South Korea | 74,071,475 |
| 13 | Los Angeles International Airport | United States | 73,709,594 |
| 14 | Charles de Gaulle Airport | France | 72,029,407 |
| 15 | Beijing Capital International Airport | China | 70,742,712 |
| 16 | Singapore Changi Airport | Singapore | 69,980,000 |
| 17 | Amsterdam Airport Schiphol | Netherlands | 68,800,000 |
| 18 | Adolfo Suárez Madrid-Barajas Airport | Spain | 68,179,054 |
| 19 | Shenzhen Bao'an International Airport | China | 66,485,213 |
| 20 | Kuala Lumpur International Airport | Malaysia | 63,300,000 |
Unit: annual passengers handled in calendar year 2025. Data type: actual airport traffic snapshot. Primary source basis: ACI World 2026 release covering 2025 airport rankings and passenger traffic.
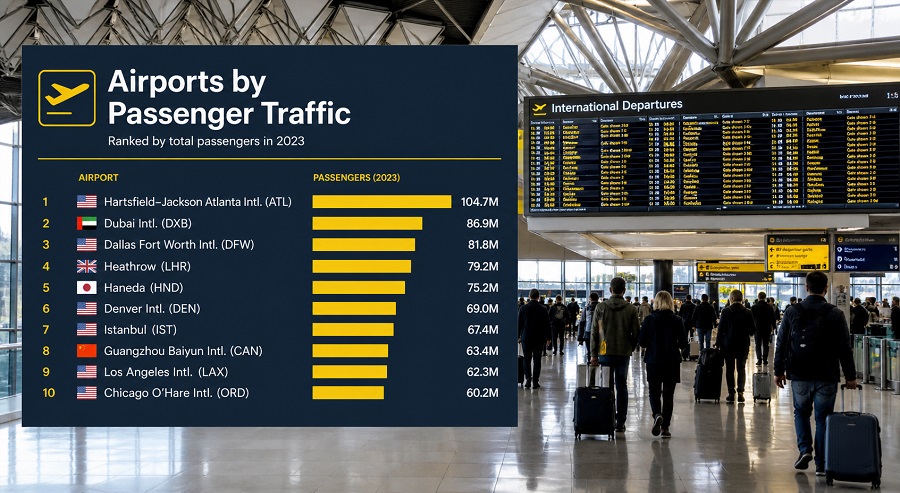
Chart: Top 10 passenger airports, 2025
Methodology
The ranking uses total airport passengers for calendar year 2025. The primary source basis is the ACI World public 2026 release for the 2025 busiest airport rankings, supported by ACI data references and public airport/operator disclosures where available. Total passengers means passengers enplaned plus passengers deplaned plus direct-transit passengers where included by the reporting standard.
The release year is 2026, while the traffic year is 2025. The numbers describe actual annual passenger traffic, not a 2026 forecast. The table uses the latest available public Top 50 snapshot for total passenger traffic and keeps the unit consistent: annual passengers handled in calendar year 2025.
Rows are sorted from highest to lowest passenger traffic. Whole-passenger totals are used where available; rounded figures are kept where public airport or operator reporting gives rounded totals. Differences between airport operators, national authorities and ACI tables can occur because of reporting timing, direct-transit treatment, calendar-year validation and later revisions.
The ranking measures airport throughput, not passenger experience. It does not evaluate delays, security wait times, terminal quality, route diversity, emissions, transfer convenience or airport financial performance.
Main table: Top 50 airports by passenger traffic
The table starts with the Top 20 view. Use the controls to search, sort or show all 50 rows.
| Rank | Airport | Country | Passengers |
|---|---|---|---|
| 1 | Hartsfield-Jackson Atlanta International Airport | United States | 106,302,208 |
| 2 | Dubai International Airport | United Arab Emirates | 95,192,160 |
| 3 | Tokyo Haneda Airport | Japan | 91,679,814 |
| 4 | Dallas Fort Worth International Airport | United States | 85,660,127 |
| 5 | Shanghai Pudong International Airport | China | 84,994,227 |
| 6 | O'Hare International Airport | United States | 84,814,099 |
| 7 | Heathrow Airport | United Kingdom | 84,482,126 |
| 8 | Istanbul Airport | Turkey | 84,437,710 |
| 9 | Guangzhou Baiyun International Airport | China | 83,582,952 |
| 10 | Denver International Airport | United States | 82,427,962 |
| 11 | Indira Gandhi International Airport | India | 79,259,890 |
| 12 | Seoul Incheon International Airport | South Korea | 74,071,475 |
| 13 | Los Angeles International Airport | United States | 73,709,594 |
| 14 | Charles de Gaulle Airport | France | 72,029,407 |
| 15 | Beijing Capital International Airport | China | 70,742,712 |
| 16 | Singapore Changi Airport | Singapore | 69,980,000 |
| 17 | Amsterdam Airport Schiphol | Netherlands | 68,800,000 |
| 18 | Adolfo Suárez Madrid-Barajas Airport | Spain | 68,179,054 |
| 19 | Shenzhen Bao'an International Airport | China | 66,485,213 |
| 20 | Kuala Lumpur International Airport | Malaysia | 63,300,000 |
| 21 | Frankfurt Airport | Germany | 63,189,666 |
| 22 | Suvarnabhumi Airport | Thailand | 62,902,183 |
| 23 | John F. Kennedy International Airport | United States | 62,629,455 |
| 24 | Hong Kong International Airport | Hong Kong SAR | 60,992,000 |
| 25 | Orlando International Airport | United States | 57,675,573 |
| 26 | Josep Tarradellas Barcelona-El Prat Airport | Spain | 57,483,036 |
| 27 | Chengdu Tianfu International Airport | China | 56,686,738 |
| 28 | Chhatrapati Shivaji Maharaj International Airport | India | 55,500,000 |
| 29 | Miami International Airport | United States | 55,314,661 |
| 30 | Harry Reid International Airport | United States | 54,989,185 |
| 31 | Soekarno-Hatta International Airport | Indonesia | 54,950,000 |
| 32 | San Francisco International Airport | United States | 54,532,613 |
| 33 | Hamad International Airport | Qatar | 54,300,000 |
| 34 | Beijing Daxing International Airport | China | 53,618,949 |
| 35 | Charlotte Douglas International Airport | United States | 53,600,000 |
| 36 | King Abdulaziz International Airport | Saudi Arabia | 53,400,000 |
| 37 | Seattle-Tacoma International Airport | United States | 52,715,181 |
| 38 | Ninoy Aquino International Airport | Philippines | 52,020,000 |
| 39 | Phoenix Sky Harbor International Airport | United States | 51,620,420 |
| 40 | Leonardo da Vinci Rome Fiumicino Airport | Italy | 50,872,356 |
| 41 | Hangzhou Xiaoshan International Airport | China | 50,459,018 |
| 42 | Shanghai Hongqiao International Airport | China | 50,151,025 |
| 43 | Chongqing Jiangbei International Airport | China | 50,094,770 |
| 44 | Kunming Changshui International Airport | China | 49,705,725 |
| 45 | Xi'an Xianyang International Airport | China | 48,535,594 |
| 46 | Istanbul Sabiha Gökçen International Airport | Turkey | 48,420,757 |
| 47 | George Bush Intercontinental Airport | United States | 48,131,213 |
| 48 | Taoyuan International Airport | Taiwan | 47,795,969 |
| 49 | Toronto Pearson International Airport | Canada | 47,300,000 |
| 50 | São Paulo/Guarulhos International Airport | Brazil | 47,188,085 |
Source basis: ACI World 2026 release covering 2025 passenger traffic rankings, with public airport and operator disclosures used where available. Coverage: 50 total-passenger airports. Unit: annual passengers handled in calendar year 2025. Data type: actual traffic snapshot.
Insights from the latest airport passenger ranking
The Top 10 shows three airport models. Atlanta, Dallas Fort Worth, Chicago O’Hare and Denver are powered mainly by a large domestic aviation market and hub-and-spoke airline networks. Dubai, Heathrow, Istanbul, Incheon and Singapore rely more heavily on international flows, long-haul connectivity and transfer traffic. Tokyo Haneda and the Chinese hubs add a third pattern: very large metropolitan catchments with strong domestic demand and restored international links.
The middle of the Top 50 shows capacity and recovery dynamics more clearly than the top ten. Chinese airports occupy many positions from rank 15 onward, showing the scale of China’s domestic network. European airports remain prominent, but many operate in slot-constrained systems where growth is structurally harder than in newer Asian or Middle Eastern hubs.
Rank changes need context. A large jump can reflect recovery after a weak base year, restored international routes, new terminal capacity, airline network changes or visa-policy effects. A small decline does not necessarily mean weak demand; it can also reflect runway limits, terminal constraints, aircraft-delivery delays, airspace disruption or deliberate capacity management.
What this means for readers
For travellers, high passenger volume usually means more route choice, higher flight frequency and stronger global connectivity. It can also mean longer queues, crowded terminals and higher pressure during peak hours. For investors and local governments, airports at this scale support tourism, logistics, employment, conventions, trade and commercial real estate around the airport corridor.
For airlines, the ranking helps identify where network competition and slot scarcity are most intense. For policymakers, it shows where infrastructure investment, border processing, rail links, air traffic management and sustainability planning matter most. Passenger traffic is not a quality ranking, but it is a strong measure of operational importance.
FAQ
Is this a Top 100 ranking?
No. The article contains 50 airport rows. Broader rankings may be available in ACI’s deeper traffic datasets, but this article is framed only as a Top 50 snapshot.
Why is the page called a 2026 update if the traffic year is 2025?
Airport traffic rankings are usually published after the reporting year closes. This update was released in 2026 and covers actual 2025 passenger traffic.
Does passenger traffic mean international passengers only?
No. This ranking uses total passengers, which includes domestic and international passengers. A separate ranking is needed for international-only traffic, where airports such as Dubai, Heathrow and Incheon usually rank especially high.
Why do U.S. airports rank so high?
The United States has a very large domestic air travel market. Airports such as Atlanta, Dallas Fort Worth, Chicago O’Hare and Denver handle huge domestic connecting flows, which lifts total passenger counts even when their international share is lower than Dubai or Heathrow.
Can passenger traffic be used as a quality indicator?
Not directly. Passenger traffic measures scale, not punctuality, queue times, comfort or passenger satisfaction. A very busy airport can be operationally efficient, but the traffic ranking alone does not prove service quality.
Sources
- Airports Council International World — primary public source for the 2026 release covering 2025 busiest airport rankings, global passenger traffic and category definitions.
- ACI World data products — validated traffic datasets and broader ranking coverage.
- Airport World summary of ACI 2025 rankings — secondary industry summary of ACI’s passenger, cargo and aircraft-movement highlights.
- Public airport traffic compilation — auxiliary cross-check for airport names and public value listings, not a primary source.
StatRanker (Website)
administrator
