


Top 100 Countries by Cost of Housing vs
Housing affordability by country · house price-to-income ratio · Numbeo 2026 Countries Where Home Prices Are Highest Compared With Income

Housing affordability by country · house price-to-income ratio · Numbeo 2026 Countries Where Home Prices Are Highest Compared With Income
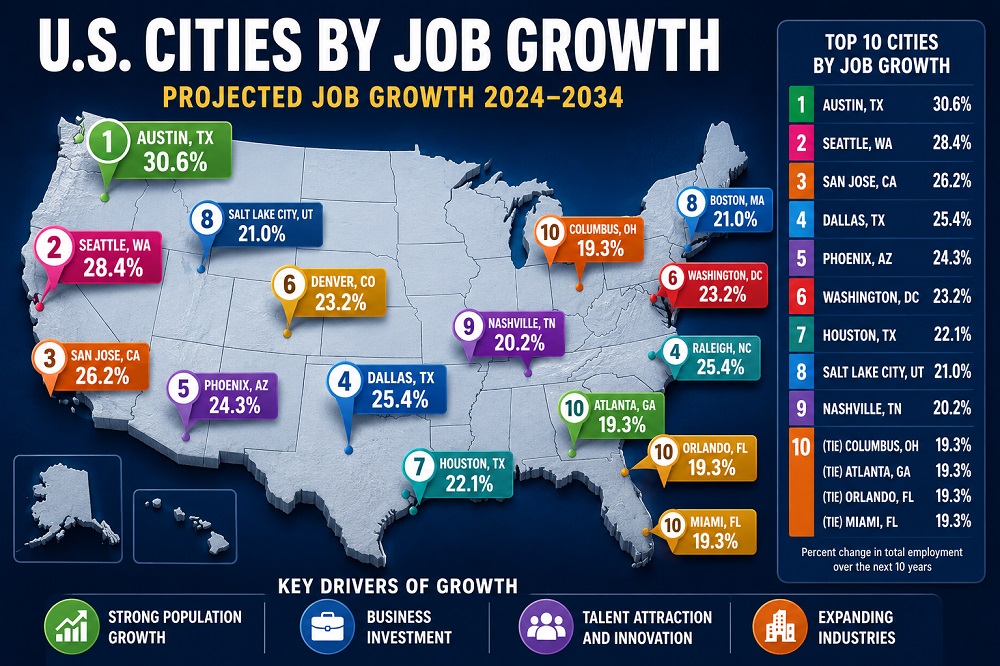
Economy · labor market · April 2026 BLS snapshot US Cities by Job Growth, 2026: Published BLS Metro Payroll Estimate
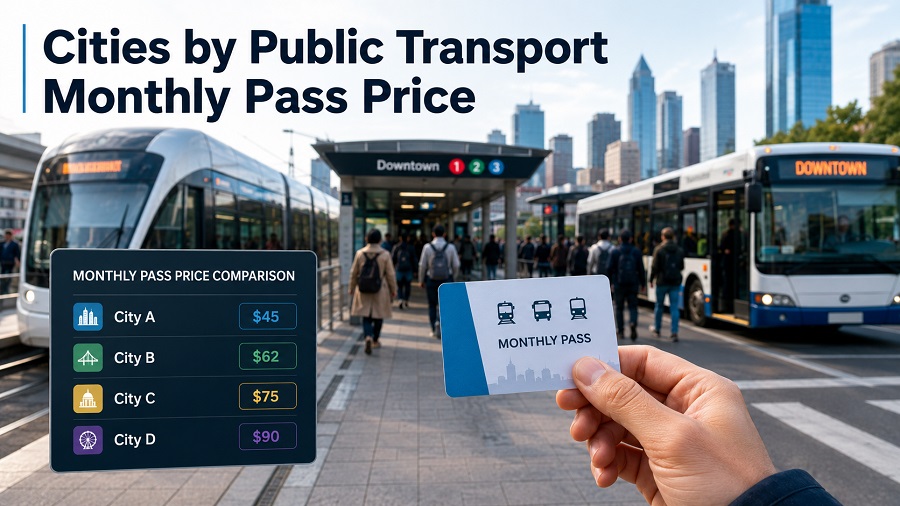
Urban mobility · monthly pass price · 2026 snapshot Cities by Public Transport Monthly Pass Price This ranking compares the
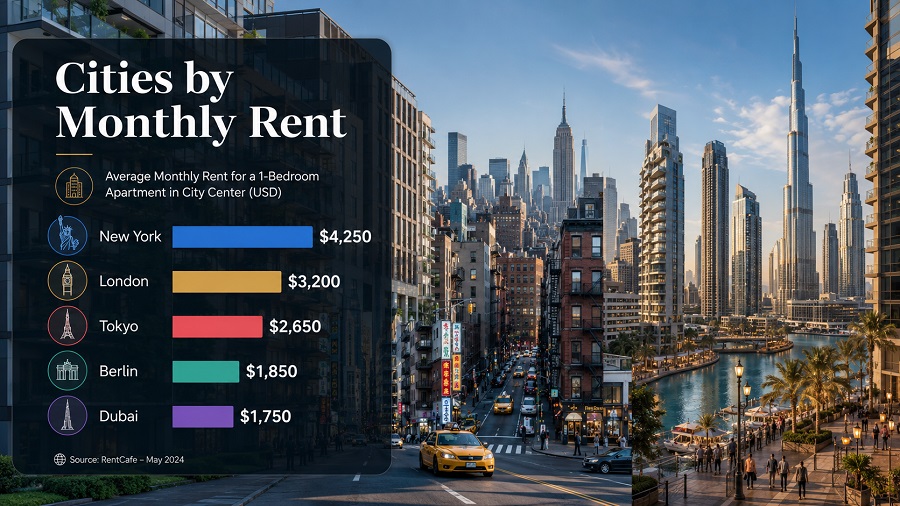
Housing costs · United States · 2026 snapshot U.S. metro areas by estimated monthly rent, 2026 This ranking compares U.S.
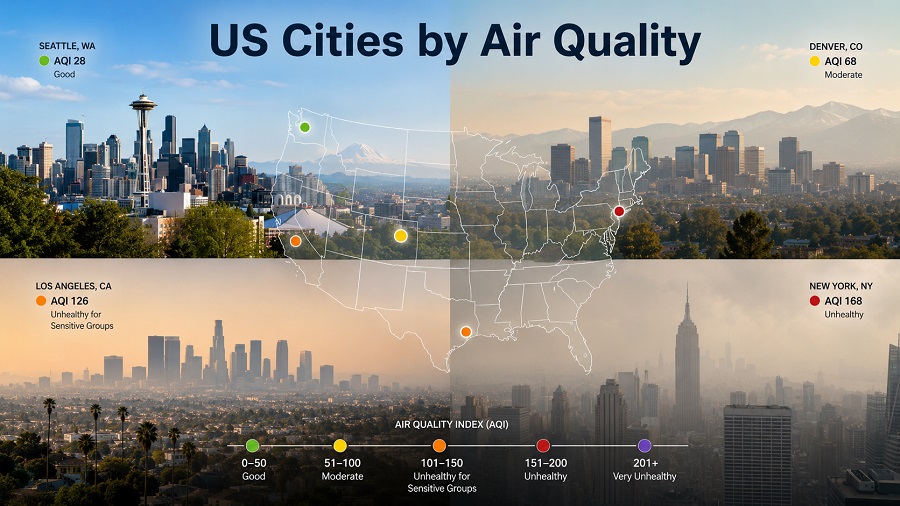
Air quality · annual PM2.5 · 2026 snapshot Cleanest U.S. Cities by Year-Round Air Quality in 2026 The ranking compares
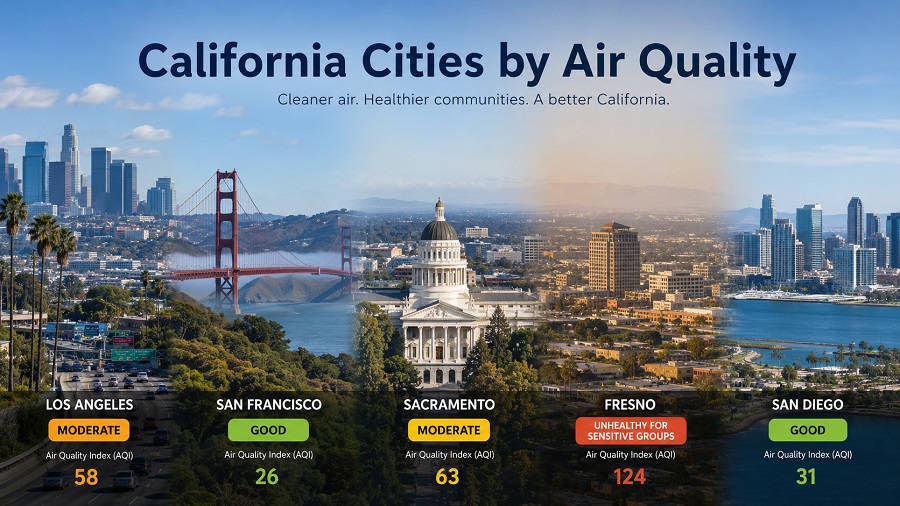
Climate, weather & environmental risks · 2026 California metro areas with the worst air quality burden This ranking compares California
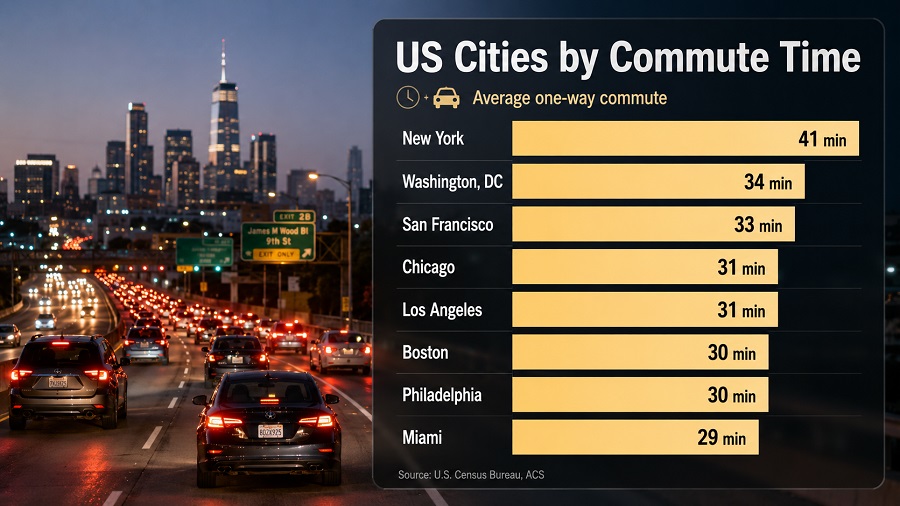
Mobility · commuting · 2026 page snapshot Major U.S. cities with the longest average commute times This ranking compares average
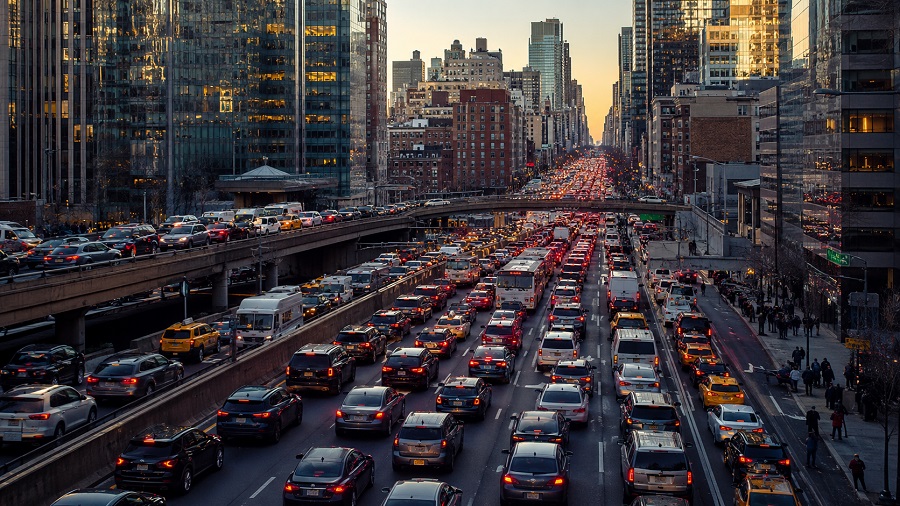
Mobility · U.S. and Puerto Rico congestion · 2026 update U.S. cities and urban areas by traffic congestion This 2026

Cities · restaurant prices · 2026 Where a basic restaurant meal is most expensive The table compares cities by the

Public safety · California cities · 2024 FBI CDE-based data California cities with the highest reported violent crime rates This

Urban life · housing instability · 2026 snapshot Major U.S. urban service areas ranked by homelessness rate This ranking compares

Housing markets · California city profiles · March 2026 Highest-priced California city markets in the March 2026 Redfin snapshot This

Public safety · reported homicide · updated May 24, 2026 Reported homicide-rate leaders among 100,000+ U.S. city records Homicide rate

Cities · reported violent crime · 2026 snapshot Major U.S. cities ranked by reported violent crime rate This ranking compares

California renter cost pressure in selected large cities Rent burden shows the share of renter households spending at least 30%
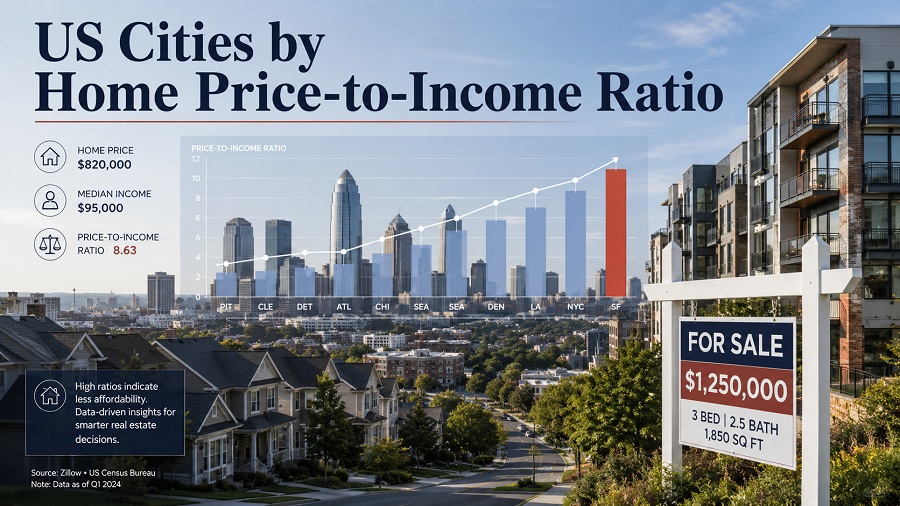
2026 housing affordability snapshot Where U.S. home values stretch furthest beyond local incomes The home price-to-income ratio compares a city’s
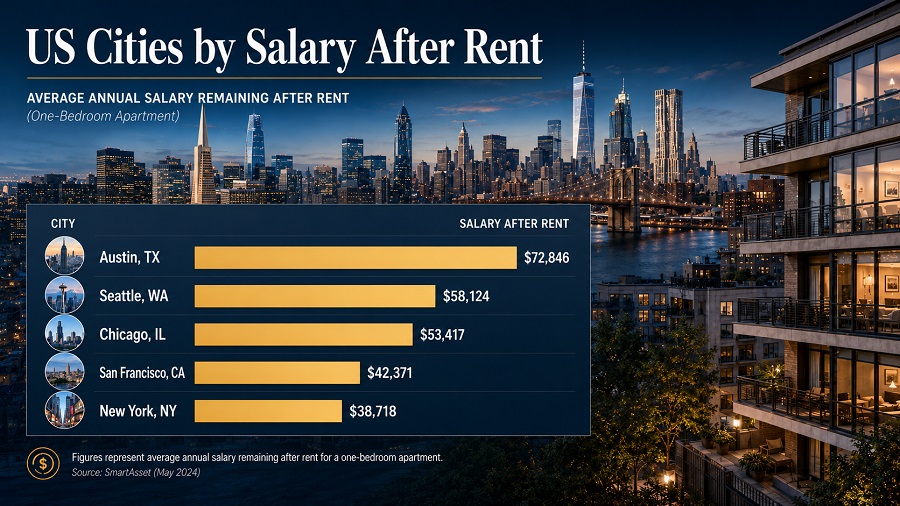
U.S. cities where salaries stretch furthest after rent Salary after rent compares estimated monthly take-home pay with the monthly rent

Where rent pressure is highest in the 2026 estimate snapshot Median rent is one of the clearest housing-cost indicators because

Housing affordability · Rent burden · Census ACS snapshot Where Rent Takes the Largest Share of Income in Major U.S.
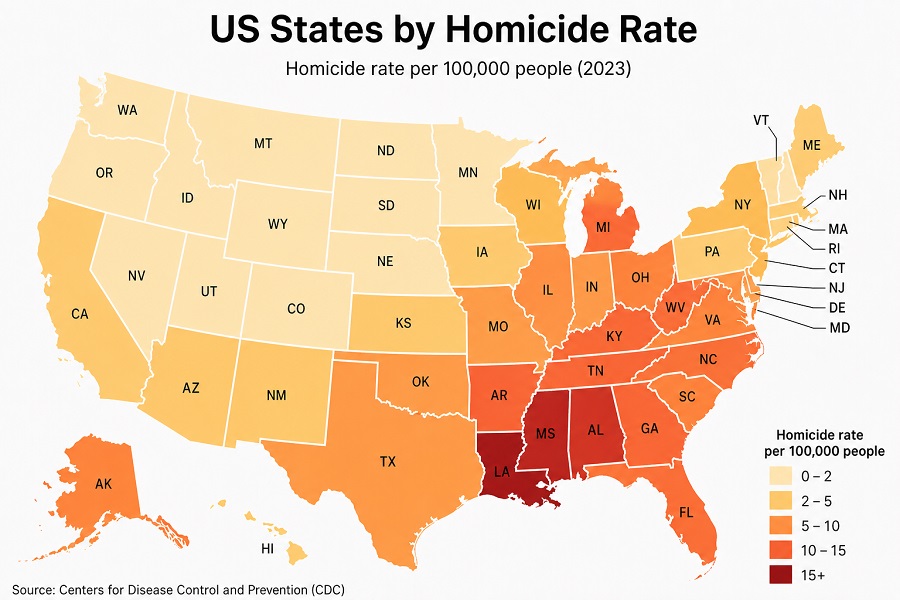
Crime and public safety · Latest available data US States by Homicide Rate: 2026 Snapshot Based on 2024 FBI Data
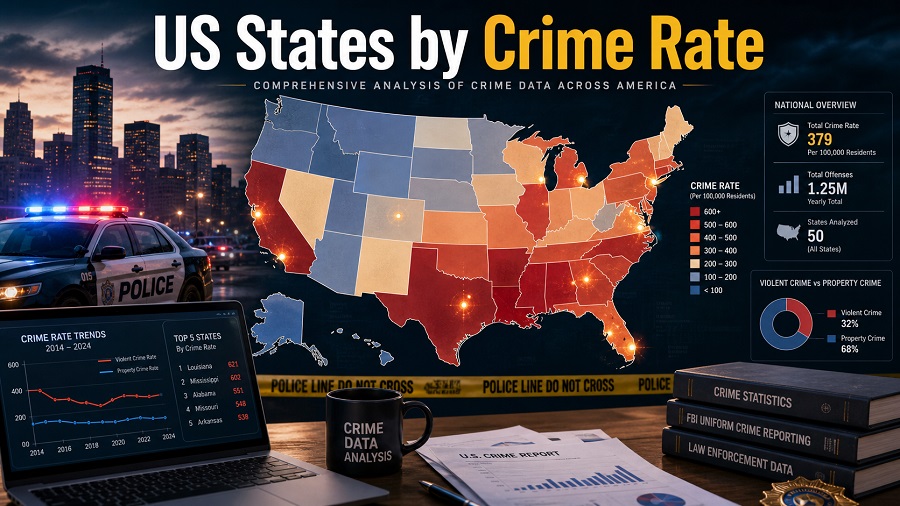
Crime and public safety · Latest available data US States by Violent Crime Rate: 2024 FBI Estimates, 2026 Snapshot Article
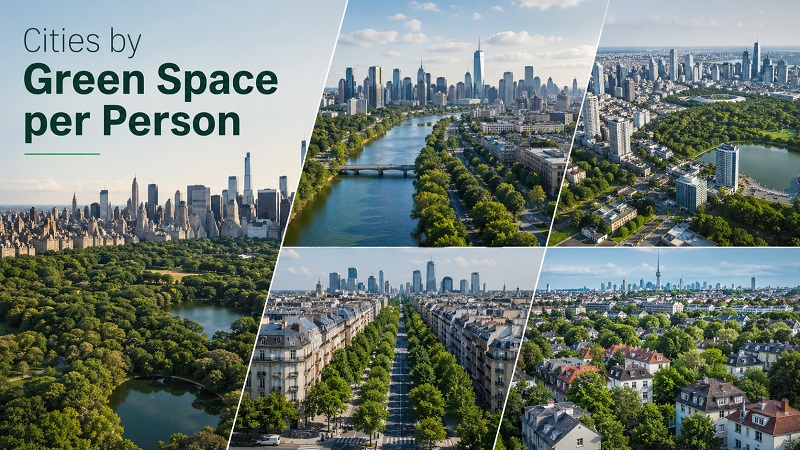
Cities · Urban life · Quality of living Green space per person: the cities where urban nature has the most
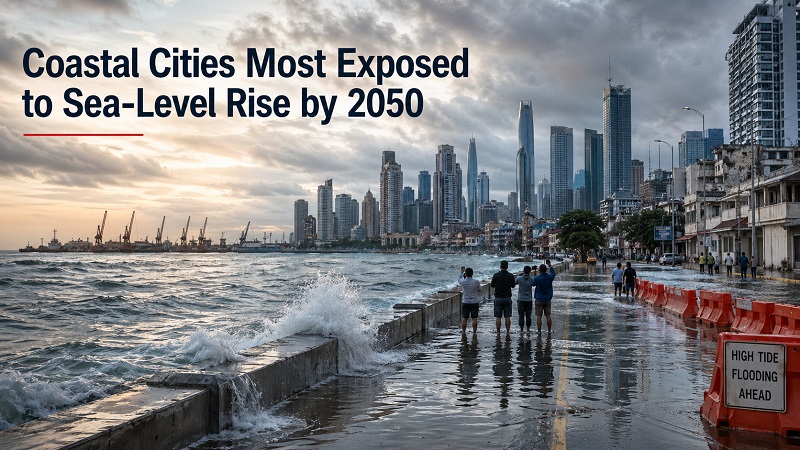
Climate risk · Coastal cities · 2050 outlook Coastal cities where sea-level rise could put the most people and assets
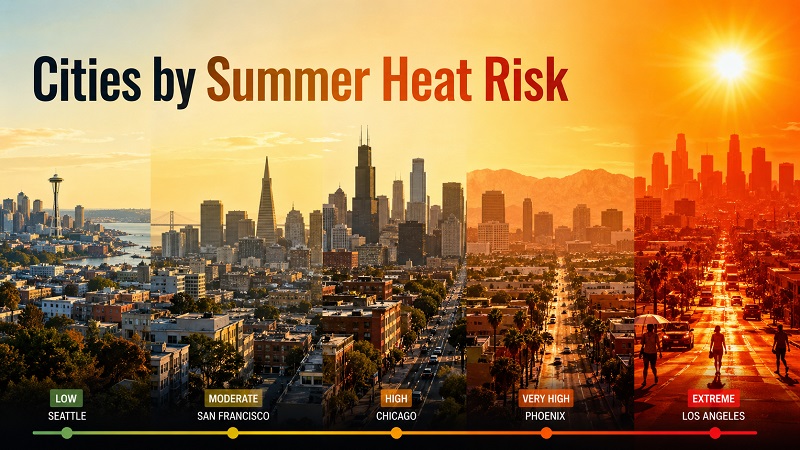
Cities · Climate risk · 2026 summer edition Where summer heat is becoming a practical city risk Summer heat risk

Travel costs · Hotel prices · 2026 planning edition Where hotel stays are most expensive in the 2026 travel-planning edition

Cities · Urban tourism · 2026 comparison Updated: April 25, 2026. Data frame: 2025 city-arrivals headline data, with StatRanker modelled

Remote work comparison · 2026 Where remote workers get the strongest balance of internet, cost and long-stay practicality The strongest
