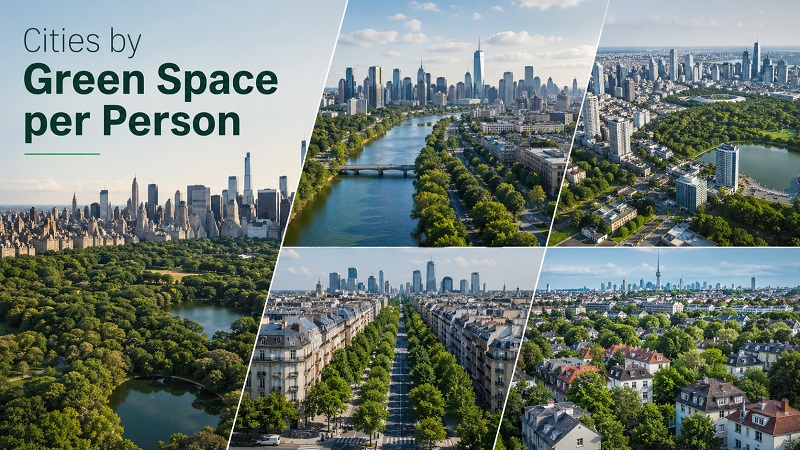
Top 100 Cities by Green Space per Person, 2026
Green space per person: the cities where urban nature has the most room
Green space per person compares the estimated area of public parks, urban forests, recreational green land and accessible natural areas with the resident population of each city. It is measured in square meters per resident, so it gives a simple way to compare how much public green infrastructure a city provides relative to the number of people using it.
The 2026 edition uses city-level information from municipal park records, land-cover datasets and population figures available up to April 2026. Because cities define boundaries and public green space differently, the ranking should be read as a comparable estimate, not a legal park inventory for each city.
What stands out at the top of the ranking
The upper part of the ranking is dominated by northern European, Canadian and Australasian cities where municipal boundaries include large forests, protected park systems, waterfront reserves or planned green belts. Oslo, Helsinki, Stockholm and Auckland benefit from a mix of natural landscapes and relatively low population pressure compared with the largest global megacities.
Compact capitals and dense Asian megacities appear lower even when their parks are well maintained. Singapore is an important example: it scores strongly for planned greenery and park connectivity, but its high population density limits green space per resident compared with cities that have larger land reserves. This is why the ranking should be interpreted together with park accessibility, tree cover, air quality and walkability.
Top 10 cities by green space per person
The leaders are not simply cities with attractive parks. They are cities where green land is large relative to the resident population and where forests, water-edge parks, recreational reserves or planned open-space systems sit inside the comparable urban boundary.
Oslo combines compact urban districts with extensive forests, waterfront recreation areas and protected natural land near the built-up core.
The city’s planned grid, linear parks and green infrastructure network lift its per-resident open-space figure above most larger British cities.
Helsinki benefits from coastal parks, islands, forests and a planning model that keeps everyday access to nature close to residential districts.
Large nature reserves and waterfront landscapes help Stockholm combine metropolitan scale with a high amount of green space per resident.
Auckland’s volcanic cones, regional parks and coastal reserves support a high green-space estimate despite continued urban growth.
The North Saskatchewan River Valley and extensive parkland system give Edmonton one of the strongest green-space-per-resident profiles in North America.
Greenbelt land, river corridors and large public parks make Ottawa a high performer among national capitals.
Brisbane’s parklands, river corridors and lower-density urban structure support a relatively high per-capita green-space figure.
Gothenburg ranks highly because accessible green areas are supported by nearby forests, recreational reserves and a less compressed urban form.
Copenhagen combines planned parks, waterfront open space and metropolitan green wedges, keeping its per-person value high for a dense European capital.
Top 100 cities by green space per person, 2026 edition
The table shows StatRanker estimates of public green space per resident, rounded for comparison. City values are not official municipal figures for every city, so they should be compared as benchmarks rather than precise legal totals.
| Rank | City | Country | Green space per person |
|---|---|---|---|
| 1 | Oslo | Norway | 281 m² |
| 2 | Milton Keynes | United Kingdom | 265 m² |
| 3 | Helsinki | Finland | 242 m² |
| 4 | Stockholm | Sweden | 219 m² |
| 5 | Auckland | New Zealand | 214 m² |
| 6 | Edmonton | Canada | 203 m² |
| 7 | Ottawa | Canada | 196 m² |
| 8 | Brisbane | Australia | 192 m² |
| 9 | Gothenburg | Sweden | 188 m² |
| 10 | Copenhagen | Denmark | 176 m² |
| 11 | Canberra | Australia | 171 m² |
| 12 | Portland | United States | 166 m² |
| 13 | Vancouver | Canada | 162 m² |
| 14 | Zurich | Switzerland | 158 m² |
| 15 | Hamburg | Germany | 154 m² |
| 16 | Wellington | New Zealand | 151 m² |
| 17 | Vienna | Austria | 148 m² |
| 18 | Munich | Germany | 144 m² |
| 19 | Warsaw | Poland | 139 m² |
| 20 | Prague | Czechia | 136 m² |
| 21 | Ljubljana | Slovenia | 132 m² |
| 22 | Dublin | Ireland | 128 m² |
| 23 | Rotterdam | Netherlands | 124 m² |
| 24 | Amsterdam | Netherlands | 121 m² |
| 25 | Montreal | Canada | 118 m² |
| 26 | Minneapolis | United States | 116 m² |
| 27 | Seattle | United States | 114 m² |
| 28 | Singapore | Singapore | 112 m² |
| 29 | Berlin | Germany | 110 m² |
| 30 | Madrid | Spain | 106 m² |
| 31 | Barcelona | Spain | 104 m² |
| 32 | Melbourne | Australia | 101 m² |
| 33 | Sydney | Australia | 98 m² |
| 34 | Toronto | Canada | 95 m² |
| 35 | Boston | United States | 92 m² |
| 36 | San Francisco | United States | 89 m² |
| 37 | Denver | United States | 86 m² |
| 38 | Phoenix | United States | 83 m² |
| 39 | Cape Town | South Africa | 81 m² |
| 40 | Curitiba | Brazil | 78 m² |
| 41 | Belo Horizonte | Brazil | 75 m² |
| 42 | Santiago | Chile | 72 m² |
| 43 | Medellin | Colombia | 70 m² |
| 44 | Bogota | Colombia | 68 m² |
| 45 | Buenos Aires | Argentina | 65 m² |
| 46 | Montevideo | Uruguay | 63 m² |
| 47 | Lima | Peru | 61 m² |
| 48 | Mexico City | Mexico | 58 m² |
| 49 | New York City | United States | 56 m² |
| 50 | Abu Dhabi | United Arab Emirates | 55 m² |
| 51 | Chicago | United States | 54 m² |
| 52 | London | United Kingdom | 52 m² |
| 53 | Paris | France | 50 m² |
| 54 | Milan | Italy | 48 m² |
| 55 | Rome | Italy | 47 m² |
| 56 | Athens | Greece | 45 m² |
| 57 | Lisbon | Portugal | 44 m² |
| 58 | Istanbul | Turkey | 42 m² |
| 59 | Tel Aviv | Israel | 41 m² |
| 60 | Ankara | Turkey | 40 m² |
| 61 | Moscow | Russia | 39 m² |
| 62 | Dubai | United Arab Emirates | 39 m² |
| 63 | Saint Petersburg | Russia | 38 m² |
| 64 | Doha | Qatar | 37 m² |
| 65 | Seoul | South Korea | 36 m² |
| 66 | Tokyo | Japan | 35 m² |
| 67 | Yokohama | Japan | 34 m² |
| 68 | Riyadh | Saudi Arabia | 34 m² |
| 69 | Kigali | Rwanda | 34 m² |
| 70 | Osaka | Japan | 33 m² |
| 71 | Taipei | Taiwan | 32 m² |
| 72 | Hong Kong | China | 31 m² |
| 73 | Shenzhen | China | 30 m² |
| 74 | Nairobi | Kenya | 30 m² |
| 75 | Guangzhou | China | 29 m² |
| 76 | Shanghai | China | 28 m² |
| 77 | Beijing | China | 27 m² |
| 78 | Bangkok | Thailand | 26 m² |
| 79 | Kuala Lumpur | Malaysia | 25 m² |
| 80 | Jakarta | Indonesia | 24 m² |
| 81 | Manila | Philippines | 23 m² |
| 82 | Ho Chi Minh City | Vietnam | 22 m² |
| 83 | Accra | Ghana | 22 m² |
| 84 | Hanoi | Vietnam | 21 m² |
| 85 | Tunis | Tunisia | 21 m² |
| 86 | Delhi | India | 20 m² |
| 87 | Dakar | Senegal | 19 m² |
| 88 | Mumbai | India | 19 m² |
| 89 | Bengaluru | India | 18 m² |
| 90 | Addis Ababa | Ethiopia | 18 m² |
| 91 | Hyderabad | India | 17 m² |
| 92 | Chennai | India | 16 m² |
| 93 | Casablanca | Morocco | 16 m² |
| 94 | Karachi | Pakistan | 15 m² |
| 95 | Lahore | Pakistan | 14 m² |
| 96 | Dhaka | Bangladesh | 13 m² |
| 97 | Kathmandu | Nepal | 12 m² |
| 98 | Cairo | Egypt | 11 m² |
| 99 | Alexandria | Egypt | 10 m² |
| 100 | Lagos | Nigeria | 9 m² |
Updated April 25, 2026. StatRanker estimates use municipal park and open-space data where available, Copernicus and EEA land-cover logic for European comparability, UN-Habitat public-space definitions and national or city population denominators. Values are rounded to the nearest square meter per resident.
Top 20 cities by green space per person
The chart highlights the gap between forest-rich or low-density cities and large metropolitan areas where land is more intensively used. The bars below repeat the Top 10 values in a simple static format.
Methodology
Green space per person is calculated as total comparable public green space divided by the resident population of the city. The metric is expressed as square meters per resident. Public green space includes municipal parks, public gardens, recreational grassland, accessible urban forests, protected natural areas inside the city boundary and green corridors when they are open to public use.
The 2026 edition uses the latest available city-level data up to April 2026. For European cities, land-cover logic follows the structure used by Copernicus Urban Atlas and European Environment Agency datasets, which classify comparable urban land-use categories. For non-European cities, municipal open-data portals, park department records, national statistical offices and published metropolitan datasets were used where available. Population denominators were aligned to the closest comparable city or metropolitan boundary used for the green-space area.
Private gardens, agricultural land outside the city boundary, restricted institutional land, water bodies and inaccessible land were excluded unless the source classified them as public open or recreational green space. Values were converted to square meters, divided by population and rounded to the nearest whole square meter. Where sources used different boundary definitions, city boundaries and population counts were matched as closely as possible.
The main limitation is comparability. Some cities publish detailed park inventories, while others rely on satellite-derived land-cover classifications or broader public-space categories. A second limitation is distribution: a city can score highly because it has a large forest or peripheral reserve, even if some neighbourhoods have little local park access. The ranking is designed for broad city comparison, not for auditing an individual city’s official park inventory. For that reason, it should be used with access-to-parks, tree-cover, heat-risk and walkability indicators.
Key insights
- Low density matters. Cities with lower population pressure and large municipal land reserves often achieve high square-meter-per-person values even when their park systems are not famous internationally.
- Forests can change the ranking. Urban forests and protected natural areas inside the boundary can push a city above dense capitals with more intensively used but smaller parks.
- Access is different from quantity. A city may have a high average while still leaving some residents far from safe, shaded and well-maintained green space.
- Climate risk raises the value of green infrastructure. Parks and trees help reduce heat-island effects, support stormwater absorption and create cooler public space during heat waves.
- Dense cities need a different strategy. In compact megacities, small parks, schoolyards, green roofs, street trees and waterfront paths can matter as much as large parks for everyday quality of life.
What this means for readers
For residents, green space per person is a practical signal of how much room a city has for walking, exercise, shade, informal sport and daily recovery from dense urban life. It does not replace neighbourhood-level access, but it helps show whether a city has enough public green infrastructure relative to population pressure.
For families and people considering relocation, the metric adds context to housing costs, school access, commute patterns and air quality. A high-ranking city may offer more weekend recreation and cooler public areas in summer, while a lower-ranking city may still be attractive if parks are well distributed and transport access is strong.
For investors, planners and local governments, the ranking highlights where green infrastructure is becoming part of competitiveness. Cities with limited open space may need to protect remaining land, convert underused parcels, expand tree canopy and improve safe walking access to parks rather than relying only on headline park acreage.
How to read the ranking
A high value means that a city has more public green land relative to its population. It does not necessarily mean that every resident has a park within a short walk, that parks are evenly distributed or that green areas are safe and well maintained.
A lower value should also be interpreted carefully. Dense cities may have less green space per resident but strong public transport, high-quality small parks, shaded streets and waterfront promenades. The most useful reading combines this ranking with city density, summer heat risk, PM2.5 exposure, walkability and public transport quality.
FAQ: green space per person
What does green space per person actually mean?
It means the estimated amount of public green land divided by the number of residents. A value of 100 m² per person means that, on average, the city has 100 square meters of comparable public green space for each resident.
Is a city with more green space per person always better to live in?
No. Quantity is only one part of urban quality of life. A city also needs safe access, good maintenance, shade, lighting, playgrounds, sports areas, public transport and fair distribution across neighbourhoods.
Why do some smaller cities rank above famous global capitals?
Smaller or lower-density cities often have more land relative to population. If their boundaries include forests, large parks or protected natural areas, their per-person value can be much higher than that of a dense capital.
Does this ranking include private gardens?
No. Private gardens are not counted as public green space. The ranking is designed around public or publicly accessible green areas such as parks, public gardens, urban forests and recreational reserves.
How is green space different from tree cover?
Tree cover measures canopy or vegetation visible from above. Green space per person measures land area that is classified as public green or recreational space. A street with many trees may improve comfort but not necessarily count as a public park.
Why can two sources give different numbers for the same city?
Sources may use different boundaries, population denominators and land categories. One dataset may include metropolitan forests, while another only counts municipal parks. That is why the table uses rounded comparable estimates.
What is a good amount of green space per person?
There is no single universal threshold that works for every city. Dense cities may need smaller but more accessible parks, while lower-density cities can rely more on larger natural areas. The better question is whether residents can reach safe, useful and shaded green space in everyday life.
How should I use this ranking if I am choosing where to live?
Use it as a first filter, not a final answer. Compare it with rent, wages, public transport, safety, air quality, heat risk and neighbourhood-level park access before making a relocation decision.
Sources
The ranking combines official and authoritative sources for definitions, land-cover comparability, public-space context and population denominators. City-specific figures are rounded comparable estimates because there is no single global official registry of green space per person for all cities.
- World Health Organization — Urban green spaces and health Provides the health and quality-of-life context linking urban green space with physical activity, heat exposure, air pollution, stress reduction and social cohesion.
https://iris.who.int/items/fa2eb466-1013-4773-a999-f029730d7898 - UN-Habitat — Open spaces and green areas, SDG 11.7.1 Explains public-space definitions and the access-to-open-space framework, including why citywide quantity should be interpreted with accessibility.
https://data.unhabitat.org/pages/open-spaces-and-green-areas - Copernicus Land Monitoring Service — Urban Atlas Provides the land-cover reference for comparable urban green-area classification in European functional urban areas.
https://land.copernicus.eu/en/products/urban-atlas - European Environment Agency — Urban Atlas data products Supports European city land-use comparability and reference-year handling in urban land-cover datasets.
https://www.eea.europa.eu/data-and-maps/data/copernicus-land-monitoring-service-urban-atlas/urban-atlas-updates - OECD — Regions and Cities at a Glance / urban policy publications Provides metropolitan context, urban policy framing and evidence on the relationship between density, climate pressure and quality-of-life infrastructure.
https://www.oecd.org/en/publications/oecd-regions-and-cities-at-a-glance-2024_f42db3bf-en.html - Municipal open data portals and national statistical offices Provide park acreage, open-space inventories, population estimates or land-use statistics where cities publish them directly.