


Top 100 Countries by Installed Solar Capacity, 2026
Renewable energy · installed solar capacity · 2026 snapshot Countries and Territories by Installed Solar Capacity: 2026 Snapshot Based on
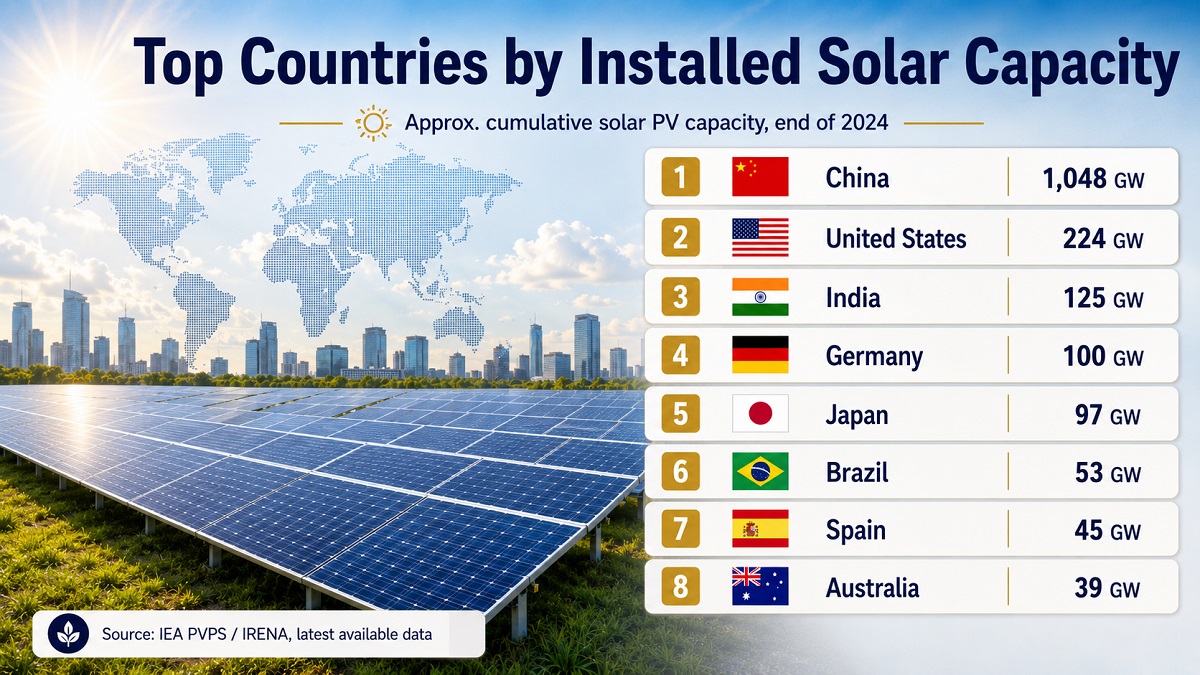
Renewable energy · installed solar capacity · 2026 snapshot Countries and Territories by Installed Solar Capacity: 2026 Snapshot Based on
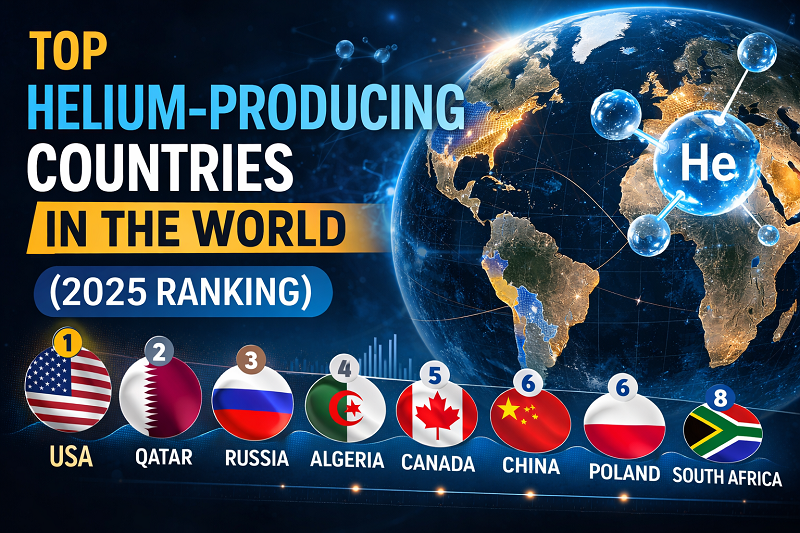
Table Methodology FAQ Sources Helium is one of the smallest commodity markets in volume terms, but it sits inside a
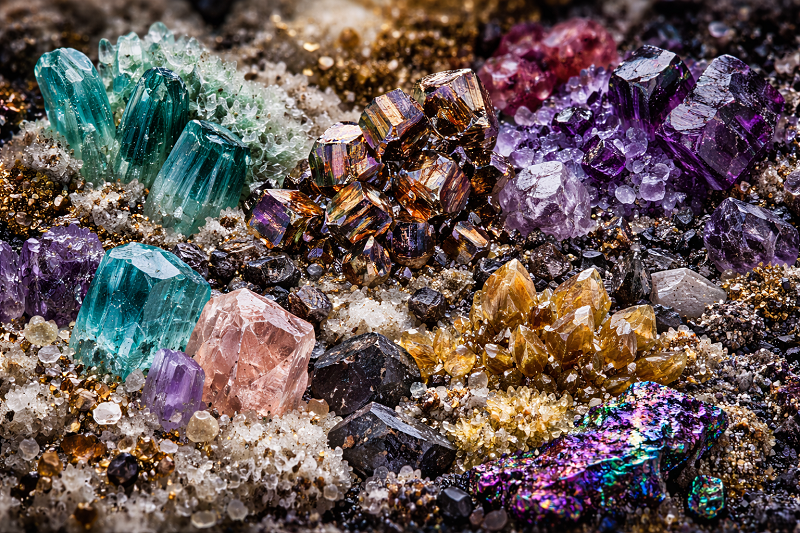
Rare earth mine production remains one of the most concentrated mineral supply chains in the world. Mineral Commodity Summaries 2026
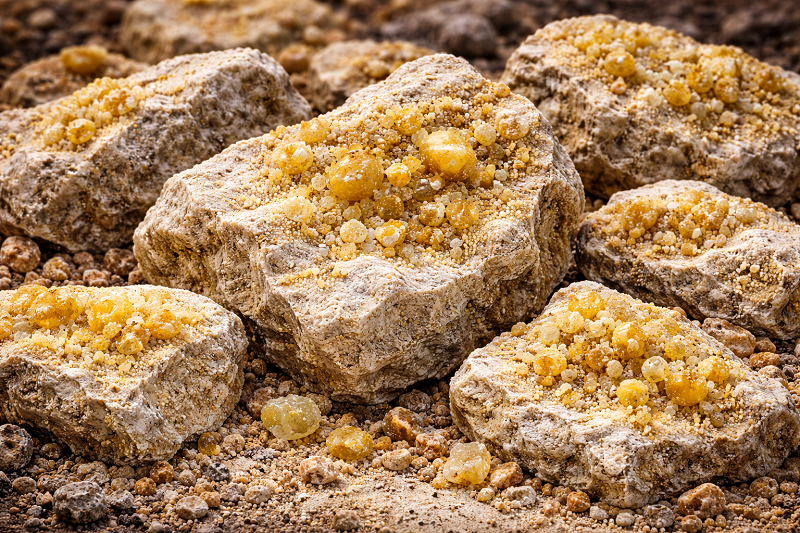
USGS data February 2026 · Mineral Commodity Summaries 2026 Phosphate Rock Mine Production by Country: 2025 USGS Ranking China produced
Uranium mining · country output · 2026 snapshot Which countries mine the most uranium? Kazakhstan is the largest uranium mining
Mining · aluminium value chain · 2025 edition Bauxite mine production and aluminium raw-material supply This ranking compares countries by
This ranking summarizes natural graphite mine output by country using the latest USGS 2024e estimates. Values are shown in kilotons
Cobalt Mine Production Leaders in the 2025 USGS Snapshot Updated: April 29, 2026 · Data year: 2025e · Primary source:
Nickel · mine production Data year: 2023 Unit: thousand tonnes of Ni metal content (kt) Source: BGS World Mineral Production
Critical minerals · lithium · 2024 data Lithium production leaders by Li content, 2024 snapshot The table ranks countries by

Resources & Critical Minerals · Mine Production A comparative overview of global copper mine output by country, with concentration analysis,
