

Top 100 Countries by Installed Solar Capacity, 2026
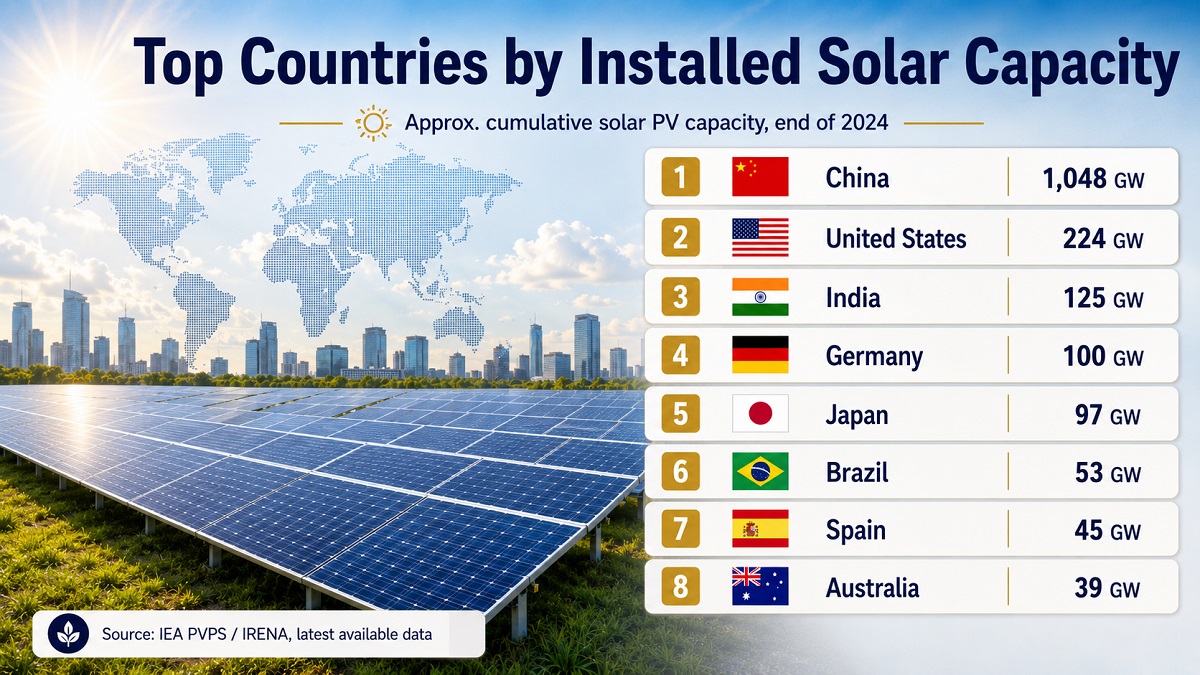
Countries and Territories by Installed Solar Capacity: 2026 Snapshot Based on 2024 IRENA Data
The ranking uses IRENA Renewable Capacity Statistics 2025, which reports installed and connected solar energy capacity at the end of 2024. The page is a 2026 snapshot based on the latest complete public dataset.
The metric is installed solar energy capacity in megawatts. Higher values rank higher. The table uses IRENA country and area rows for solar energy, not annual solar additions, electricity generation, solar share of power, per-capita capacity or only solar photovoltaic capacity.
The table includes 100 entries selected from IRENA country and area rows with numeric 2024 values. All figures come straight from IRENA's published 2024 capacity table, with no forecasts or estimates added.
Continue exploring
More StatRanker rankings on climate, environment, resources and sustainability.
Iron Ore Mine Production by Country 2026: 2025 USGS Estimates
Open rankingCoal Consumption by Country 2026: Official EIA 2024 Ranking
Open rankingElectricity Consumption by Country 2026: Top 50 EIA 2024 Ranking
Open rankingChina ranks first by installed solar energy capacity at the end of 2024.
The United States is second, far below China but ahead of all other listed entries.
Top 100 countries and territories with reported IRENA 2024 solar capacity values.
IRENA Renewable Capacity Statistics 2025; 100 countries and territories with reported 2024 figures.
Overview
Installed solar energy capacity measures the maximum net generating capacity of solar power plants and other connected solar installations. It is a stock measure at the end of the year, so it captures the cumulative solar build-out already connected to power systems rather than how much electricity those systems generated during the year.
The top of the ranking is highly concentrated. China leads by a wide margin, with about five times the installed solar capacity of the United States. Behind them come large power systems like India, Japan and Germany, alongside fast-growing markets such as Brazil, Spain, Australia and Italy.
This is not a measure of climate ambition or how sunny a country is. A country with stronger sunlight can rank lower if grid capacity, policy design, financing, land access, interconnection queues or electricity demand have limited deployment.
Top 10 countries by installed solar energy capacity
The Top 10 is not only a list of the sunniest places; it is also a list of large electricity markets, mature incentive systems and countries with major utility-scale or distributed solar deployment.
| Rank | Country | Capacity | Source / Note |
|---|---|---|---|
| 1 | China | 887,930 MW | IRENA Renewable Capacity Statistics 2025; installed and connected solar capacity at the end of 2024, in MW. |
| 2 | United States | 177,470 MW | IRENA Renewable Capacity Statistics 2025; installed and connected solar capacity at the end of 2024, in MW. |
| 3 | India | 97,384 MW | IRENA Renewable Capacity Statistics 2025; installed and connected solar capacity at the end of 2024, in MW. |
| 4 | Japan | 91,610 MW | IRENA Renewable Capacity Statistics 2025; installed and connected solar capacity at the end of 2024, in MW. |
| 5 | Germany | 89,943 MW | IRENA Renewable Capacity Statistics 2025; installed and connected solar capacity at the end of 2024, in MW. |
| 6 | Brazil | 53,113 MW | IRENA Renewable Capacity Statistics 2025; installed and connected solar capacity at the end of 2024, in MW. |
| 7 | Spain | 38,587 MW | IRENA Renewable Capacity Statistics 2025; installed and connected solar capacity at the end of 2024, in MW. |
| 8 | Australia | 38,472 MW | IRENA Renewable Capacity Statistics 2025; installed and connected solar capacity at the end of 2024, in MW. |
| 9 | Italy | 36,013 MW | IRENA Renewable Capacity Statistics 2025; installed and connected solar capacity at the end of 2024, in MW. |
| 10 | Korea Rep | 26,645 MW | IRENA Renewable Capacity Statistics 2025; installed and connected solar capacity at the end of 2024, in MW. |
Capacity is shown in megawatts and rounded as published in the IRENA table.
Chart: Top 20 installed solar energy capacity entries
The chart uses the same scale for every entry. China is an outlier, so lower-ranked bars appear much shorter.
Methodology
The metric is installed solar energy capacity, measured in megawatts. Values refer to 2024 and are used here as a 2026 snapshot because IRENA Renewable Capacity Statistics 2025 is the latest complete public capacity dataset for this indicator.
Metric and unit
Installed solar energy capacity, MW. IRENA defines renewable power capacity as maximum net generating capacity of power plants and other installations using renewable energy sources to produce electricity.
Ranking direction
Higher installed capacity ranks higher. Ranks were calculated from the numeric 2024 value in descending order.
Coverage and exclusions
The ranking includes the top 100 country and area rows with numeric 2024 solar energy capacity values. Regional aggregates, world totals and the European Union aggregate are excluded.
Reported figures only
Every figure is a reported value taken from IRENA's published 2024 capacity table. No forecasts or modeled estimates are included.
Installed capacity is not annual generation, not electricity share, not annual additions and not per-capita capacity. It is also not a pure solar-resource ranking: deployment depends on power demand, grid connection, permitting, financing, policy design, land availability and distributed-generation rules.
Values are shown as whole megawatts as published in the IRENA capacity table. IRENA notes that capacity data are generally installed and connected capacity at the end of the calendar year, and that its underlying data can come from questionnaires, official statistics, industry association reports, other reports and news articles.
Main ranking: Top 100 countries and territories by installed solar energy capacity
Use the controls below to search, filter by region and reorder the table.
| Rank | Country | Capacity | Source / Note |
|---|---|---|---|
| 1 | China | 887,930 MW | IRENA Renewable Capacity Statistics 2025; installed and connected solar capacity at the end of 2024, in MW. |
| 2 | United States | 177,470 MW | IRENA Renewable Capacity Statistics 2025; installed and connected solar capacity at the end of 2024, in MW. |
| 3 | India | 97,384 MW | IRENA Renewable Capacity Statistics 2025; installed and connected solar capacity at the end of 2024, in MW. |
| 4 | Japan | 91,610 MW | IRENA Renewable Capacity Statistics 2025; installed and connected solar capacity at the end of 2024, in MW. |
| 5 | Germany | 89,943 MW | IRENA Renewable Capacity Statistics 2025; installed and connected solar capacity at the end of 2024, in MW. |
| 6 | Brazil | 53,113 MW | IRENA Renewable Capacity Statistics 2025; installed and connected solar capacity at the end of 2024, in MW. |
| 7 | Spain | 38,587 MW | IRENA Renewable Capacity Statistics 2025; installed and connected solar capacity at the end of 2024, in MW. |
| 8 | Australia | 38,472 MW | IRENA Renewable Capacity Statistics 2025; installed and connected solar capacity at the end of 2024, in MW. |
| 9 | Italy | 36,013 MW | IRENA Renewable Capacity Statistics 2025; installed and connected solar capacity at the end of 2024, in MW. |
| 10 | Korea Rep | 26,645 MW | IRENA Renewable Capacity Statistics 2025; installed and connected solar capacity at the end of 2024, in MW. |
| 11 | Netherlands | 24,048 MW | IRENA Renewable Capacity Statistics 2025; installed and connected solar capacity at the end of 2024, in MW. |
| 12 | France | 21,528 MW | IRENA Renewable Capacity Statistics 2025; installed and connected solar capacity at the end of 2024, in MW. |
| 13 | Poland | 20,199 MW | IRENA Renewable Capacity Statistics 2025; installed and connected solar capacity at the end of 2024, in MW. |
| 14 | Türkiye | 19,883 MW | IRENA Renewable Capacity Statistics 2025; installed and connected solar capacity at the end of 2024, in MW. |
| 15 | Viet Nam | 18,667 MW | IRENA Renewable Capacity Statistics 2025; installed and connected solar capacity at the end of 2024, in MW. |
| 16 | United Kingdom | 17,603 MW | IRENA Renewable Capacity Statistics 2025; installed and connected solar capacity at the end of 2024, in MW. |
| 17 | Chinese Taipei | 14,281 MW | IRENA Renewable Capacity Statistics 2025; installed and connected solar capacity at the end of 2024, in MW. |
| 18 | Mexico | 11,992 MW | IRENA Renewable Capacity Statistics 2025; installed and connected solar capacity at the end of 2024, in MW. |
| 19 | Chile | 11,054 MW | IRENA Renewable Capacity Statistics 2025; installed and connected solar capacity at the end of 2024, in MW. |
| 20 | Belgium | 9,752 MW | IRENA Renewable Capacity Statistics 2025; installed and connected solar capacity at the end of 2024, in MW. |
| 21 | Greece | 9,269 MW | IRENA Renewable Capacity Statistics 2025; installed and connected solar capacity at the end of 2024, in MW. |
| 22 | Austria | 8,481 MW | IRENA Renewable Capacity Statistics 2025; installed and connected solar capacity at the end of 2024, in MW. |
| 23 | Switzerland | 7,794 MW | IRENA Renewable Capacity Statistics 2025; installed and connected solar capacity at the end of 2024, in MW. |
| 24 | Hungary | 7,699 MW | IRENA Renewable Capacity Statistics 2025; installed and connected solar capacity at the end of 2024, in MW. |
| 25 | South Africa | 6,671 MW | IRENA Renewable Capacity Statistics 2025; installed and connected solar capacity at the end of 2024, in MW. |
| 26 | Canada | 6,105 MW | IRENA Renewable Capacity Statistics 2025; installed and connected solar capacity at the end of 2024, in MW. |
| 27 | United Arab Emirates | 6,011 MW | IRENA Renewable Capacity Statistics 2025; installed and connected solar capacity at the end of 2024, in MW. |
| 28 | Portugal | 5,808 MW | IRENA Renewable Capacity Statistics 2025; installed and connected solar capacity at the end of 2024, in MW. |
| 29 | Israel | 5,605 MW | IRENA Renewable Capacity Statistics 2025; installed and connected solar capacity at the end of 2024, in MW. |
| 30 | Ukraine | 5,500 MW | IRENA Renewable Capacity Statistics 2025; installed and connected solar capacity at the end of 2024, in MW. |
| 31 | Sweden | 4,963 MW | IRENA Renewable Capacity Statistics 2025; installed and connected solar capacity at the end of 2024, in MW. |
| 32 | Romania | 4,688 MW | IRENA Renewable Capacity Statistics 2025; installed and connected solar capacity at the end of 2024, in MW. |
| 33 | Saudi Arabia | 4,340 MW | IRENA Renewable Capacity Statistics 2025; installed and connected solar capacity at the end of 2024, in MW. |
| 34 | Czechia | 4,159 MW | IRENA Renewable Capacity Statistics 2025; installed and connected solar capacity at the end of 2024, in MW. |
| 35 | Denmark | 3,945 MW | IRENA Renewable Capacity Statistics 2025; installed and connected solar capacity at the end of 2024, in MW. |
| 36 | Bulgaria | 3,908 MW | IRENA Renewable Capacity Statistics 2025; installed and connected solar capacity at the end of 2024, in MW. |
| 37 | Thailand | 3,384 MW | IRENA Renewable Capacity Statistics 2025; installed and connected solar capacity at the end of 2024, in MW. |
| 38 | Philippines | 2,971 MW | IRENA Renewable Capacity Statistics 2025; installed and connected solar capacity at the end of 2024, in MW. |
| 39 | Egypt | 2,590 MW | IRENA Renewable Capacity Statistics 2025; installed and connected solar capacity at the end of 2024, in MW. |
| 40 | Lithuania | 2,567 MW | IRENA Renewable Capacity Statistics 2025; installed and connected solar capacity at the end of 2024, in MW. |
| 41 | Russian Federation | 2,554 MW | IRENA Renewable Capacity Statistics 2025; installed and connected solar capacity at the end of 2024, in MW. |
| 42 | Malaysia | 2,306 MW | IRENA Renewable Capacity Statistics 2025; installed and connected solar capacity at the end of 2024, in MW. |
| 43 | Uzbekistan | 2,275 MW | IRENA Renewable Capacity Statistics 2025; installed and connected solar capacity at the end of 2024, in MW. |
| 44 | Jordan | 2,077 MW | IRENA Renewable Capacity Statistics 2025; installed and connected solar capacity at the end of 2024, in MW. |
| 45 | Argentina | 1,741 MW | IRENA Renewable Capacity Statistics 2025; installed and connected solar capacity at the end of 2024, in MW. |
| 46 | Qatar | 1,680 MW | IRENA Renewable Capacity Statistics 2025; installed and connected solar capacity at the end of 2024, in MW. |
| 47 | Sri Lanka | 1,450 MW | IRENA Renewable Capacity Statistics 2025; installed and connected solar capacity at the end of 2024, in MW. |
| 48 | Dominican Republic | 1,423 MW | IRENA Renewable Capacity Statistics 2025; installed and connected solar capacity at the end of 2024, in MW. |
| 49 | Pakistan | 1,395 MW | IRENA Renewable Capacity Statistics 2025; installed and connected solar capacity at the end of 2024, in MW. |
| 50 | Colombia | 1,392 MW | IRENA Renewable Capacity Statistics 2025; installed and connected solar capacity at the end of 2024, in MW. |
| 51 | Ireland | 1,340 MW | IRENA Renewable Capacity Statistics 2025; installed and connected solar capacity at the end of 2024, in MW. |
| 52 | Estonia | 1,326 MW | IRENA Renewable Capacity Statistics 2025; installed and connected solar capacity at the end of 2024, in MW. |
| 53 | Slovenia | 1,309 MW | IRENA Renewable Capacity Statistics 2025; installed and connected solar capacity at the end of 2024, in MW. |
| 54 | Finland | 1,203 MW | IRENA Renewable Capacity Statistics 2025; installed and connected solar capacity at the end of 2024, in MW. |
| 55 | Kazakhstan | 1,196 MW | IRENA Renewable Capacity Statistics 2025; installed and connected solar capacity at the end of 2024, in MW. |
| 56 | Singapore | 1,157 MW | IRENA Renewable Capacity Statistics 2025; installed and connected solar capacity at the end of 2024, in MW. |
| 57 | Lebanon | 1,005 MW | IRENA Renewable Capacity Statistics 2025; installed and connected solar capacity at the end of 2024, in MW. |
| 58 | Puerto Rico | 963 MW | IRENA Renewable Capacity Statistics 2025; installed and connected solar capacity at the end of 2024, in MW. |
| 59 | Morocco | 934 MW | IRENA Renewable Capacity Statistics 2025; installed and connected solar capacity at the end of 2024, in MW. |
| 60 | Cambodia | 878 MW | IRENA Renewable Capacity Statistics 2025; installed and connected solar capacity at the end of 2024, in MW. |
| 61 | Slovakia | 867 MW | IRENA Renewable Capacity Statistics 2025; installed and connected solar capacity at the end of 2024, in MW. |
| 62 | Croatia | 860 MW | IRENA Renewable Capacity Statistics 2025; installed and connected solar capacity at the end of 2024, in MW. |
| 63 | Bangladesh | 846 MW | IRENA Renewable Capacity Statistics 2025; installed and connected solar capacity at the end of 2024, in MW. |
| 64 | North Macedonia | 833 MW | IRENA Renewable Capacity Statistics 2025; installed and connected solar capacity at the end of 2024, in MW. |
| 65 | Indonesia | 815 MW | IRENA Renewable Capacity Statistics 2025; installed and connected solar capacity at the end of 2024, in MW. |
| 66 | Norway | 802 MW | IRENA Renewable Capacity Statistics 2025; installed and connected solar capacity at the end of 2024, in MW. |
| 67 | Iran | 782 MW | IRENA Renewable Capacity Statistics 2025; installed and connected solar capacity at the end of 2024, in MW. |
| 68 | Tunisia | 773 MW | IRENA Renewable Capacity Statistics 2025; installed and connected solar capacity at the end of 2024, in MW. |
| 69 | Panama | 743 MW | IRENA Renewable Capacity Statistics 2025; installed and connected solar capacity at the end of 2024, in MW. |
| 70 | Cyprus | 724 MW | IRENA Renewable Capacity Statistics 2025; installed and connected solar capacity at the end of 2024, in MW. |
| 71 | Oman | 672 MW | IRENA Renewable Capacity Statistics 2025; installed and connected solar capacity at the end of 2024, in MW. |
| 72 | El Salvador | 648 MW | IRENA Renewable Capacity Statistics 2025; installed and connected solar capacity at the end of 2024, in MW. |
| 73 | New Zealand | 570 MW | IRENA Renewable Capacity Statistics 2025; installed and connected solar capacity at the end of 2024, in MW. |
| 74 | Honduras | 554 MW | IRENA Renewable Capacity Statistics 2025; installed and connected solar capacity at the end of 2024, in MW. |
| 75 | Peru | 528 MW | IRENA Renewable Capacity Statistics 2025; installed and connected solar capacity at the end of 2024, in MW. |
| 76 | Luxembourg | 523 MW | IRENA Renewable Capacity Statistics 2025; installed and connected solar capacity at the end of 2024, in MW. |
| 77 | Armenia | 485 MW | IRENA Renewable Capacity Statistics 2025; installed and connected solar capacity at the end of 2024, in MW. |
| 78 | Latvia | 466 MW | IRENA Renewable Capacity Statistics 2025; installed and connected solar capacity at the end of 2024, in MW. |
| 79 | Algeria | 462 MW | IRENA Renewable Capacity Statistics 2025; installed and connected solar capacity at the end of 2024, in MW. |
| 80 | Yemen | 410 MW | IRENA Renewable Capacity Statistics 2025; installed and connected solar capacity at the end of 2024, in MW. |
| 81 | Kenya | 369 MW | IRENA Renewable Capacity Statistics 2025; installed and connected solar capacity at the end of 2024, in MW. |
| 82 | Angola | 362 MW | IRENA Renewable Capacity Statistics 2025; installed and connected solar capacity at the end of 2024, in MW. |
| 83 | Moldova Rep | 344 MW | IRENA Renewable Capacity Statistics 2025; installed and connected solar capacity at the end of 2024, in MW. |
| 84 | Hong Kong SAR, China | 333 MW | IRENA Renewable Capacity Statistics 2025; installed and connected solar capacity at the end of 2024, in MW. |
| 85 | Uruguay | 330 MW | IRENA Renewable Capacity Statistics 2025; installed and connected solar capacity at the end of 2024, in MW. |
| 86 | Albania | 307 MW | IRENA Renewable Capacity Statistics 2025; installed and connected solar capacity at the end of 2024, in MW. |
| 87 | Azerbaijan | 293 MW | IRENA Renewable Capacity Statistics 2025; installed and connected solar capacity at the end of 2024, in MW. |
| 88 | Cuba | 292 MW | IRENA Renewable Capacity Statistics 2025; installed and connected solar capacity at the end of 2024, in MW. |
| 89 | Senegal | 273 MW | IRENA Renewable Capacity Statistics 2025; installed and connected solar capacity at the end of 2024, in MW. |
| 90 | Belarus | 265 MW | IRENA Renewable Capacity Statistics 2025; installed and connected solar capacity at the end of 2024, in MW. |
| 91 | Serbia | 241 MW | IRENA Renewable Capacity Statistics 2025; installed and connected solar capacity at the end of 2024, in MW. |
| 92 | Reunion | 239 MW | IRENA Renewable Capacity Statistics 2025; installed and connected solar capacity at the end of 2024, in MW. |
| 93 | Malta | 233 MW | IRENA Renewable Capacity Statistics 2025; installed and connected solar capacity at the end of 2024, in MW. |
| 94 | Myanmar | 216 MW | IRENA Renewable Capacity Statistics 2025; installed and connected solar capacity at the end of 2024, in MW. |
| 95 | New Caledonia | 215 MW | IRENA Renewable Capacity Statistics 2025; installed and connected solar capacity at the end of 2024, in MW. |
| 96 | Bosnia and Herzegovina | 212 MW | IRENA Renewable Capacity Statistics 2025; installed and connected solar capacity at the end of 2024, in MW. |
| 97 | Burkina Faso | 206 MW | IRENA Renewable Capacity Statistics 2025; installed and connected solar capacity at the end of 2024, in MW. |
| 98 | Palestine | 197 MW | IRENA Renewable Capacity Statistics 2025; installed and connected solar capacity at the end of 2024, in MW. |
| 99 | Zambia | 196 MW | IRENA Renewable Capacity Statistics 2025; installed and connected solar capacity at the end of 2024, in MW. |
| 100 | Sudan | 190 MW | IRENA Renewable Capacity Statistics 2025; installed and connected solar capacity at the end of 2024, in MW. |
Source: IRENA Renewable Capacity Statistics 2025, Solar energy table, 2024 column. Regional aggregates and world totals are not included in the ranking rows.
Insights
China leads by a wide margin
China leads with 887,930 MW against 177,470 MW for the United States — roughly five times the second-ranked country.
The Top 10 mixes large systems and mature solar markets
India, Japan, Germany, Brazil, Spain, Australia and Italy show that ranking high requires more than sunlight; electricity demand, grid access, policy design and investment capacity all matter.
Asia, Europe and the Americas dominate the upper ranking
The top 20 contains major entries from Asia, Europe, North America, South America and Oceania. Africa’s highest-ranked entry is South Africa, which appears below the global top tier by total installed capacity.
China changes chart readability
Because China is so far ahead, most other Top 20 bars look small when every bar shares one scale. The gap is real, not a quirk of the chart.
What It Means
This ranking shows where solar infrastructure has already been installed and connected. It is a way to compare the scale of national solar build-out and to keep installed capacity separate from annual electricity production.
A high rank does not automatically mean the highest solar share in electricity generation. Capacity must be converted into actual power output through solar resource, system performance, curtailment, storage, grid availability and dispatch conditions. A country can have large capacity but different generation outcomes.
Read this mainly as a measure of scale. China, the United States and India represent very large solar systems. Smaller countries can be policy leaders or have high solar shares while still ranking lower by absolute MW because their electricity systems are smaller.
FAQ
What exactly is being ranked?
The ranking orders countries and territories by installed solar energy capacity in megawatts at the end of 2024, using IRENA Renewable Capacity Statistics 2025.
Is this official 2026 capacity data?
No. It is a 2026 snapshot based on the latest available complete 2024 IRENA data. The target data year is 2024.
Does the table rank solar electricity generation?
No. Installed capacity measures connected generation capacity in MW. Generation depends on sunlight, weather, plant performance, curtailment, storage, grid conditions and how the electricity system dispatches solar output.
Does “solar energy” mean only solar photovoltaic?
No. The table uses IRENA’s Solar energy category. That is broader than a strict solar photovoltaic-only table and can include solar energy capacity reported under IRENA’s solar classification.
Why do some sunny countries rank lower?
Solar resource is only one factor. Grid connection, investment, land access, policy incentives, permitting, demand size, storage and power-market rules strongly affect how much solar capacity is actually installed.
Why are countries and territories included together?
IRENA publishes data for countries, areas and territories. This page keeps the IRENA country/area structure and identifies the ranking as countries and territories rather than sovereign states only.
Are these figures estimates or forecasts?
No. All 100 rows are reported values from IRENA’s published 2024 capacity table. There are no forecasts or modeled estimates.
Sources
IRENA Renewable Capacity Statistics 2025
Primary country-level source for installed solar energy capacity values used in the ranking table. The relevant table is Solar energy, CAP (MW), 2015–2024.
IRENA Statistics / Data
Download environment for IRENA renewable energy statistics, including renewable capacity datasets and related tables.
IRENA notes to the capacity tables
Used for the methodological definition of renewable power capacity, end-of-year installed and connected capacity, MW rounding and source-indicator logic.
https://www.irena.org/Publications/2025/Mar/Renewable-Capacity-Statistics-2025
Related rankings
More StatRanker rankings on climate, environment, resources and sustainability.
