

Top 100 Countries by Economic Complexity, 2026 Snapshot
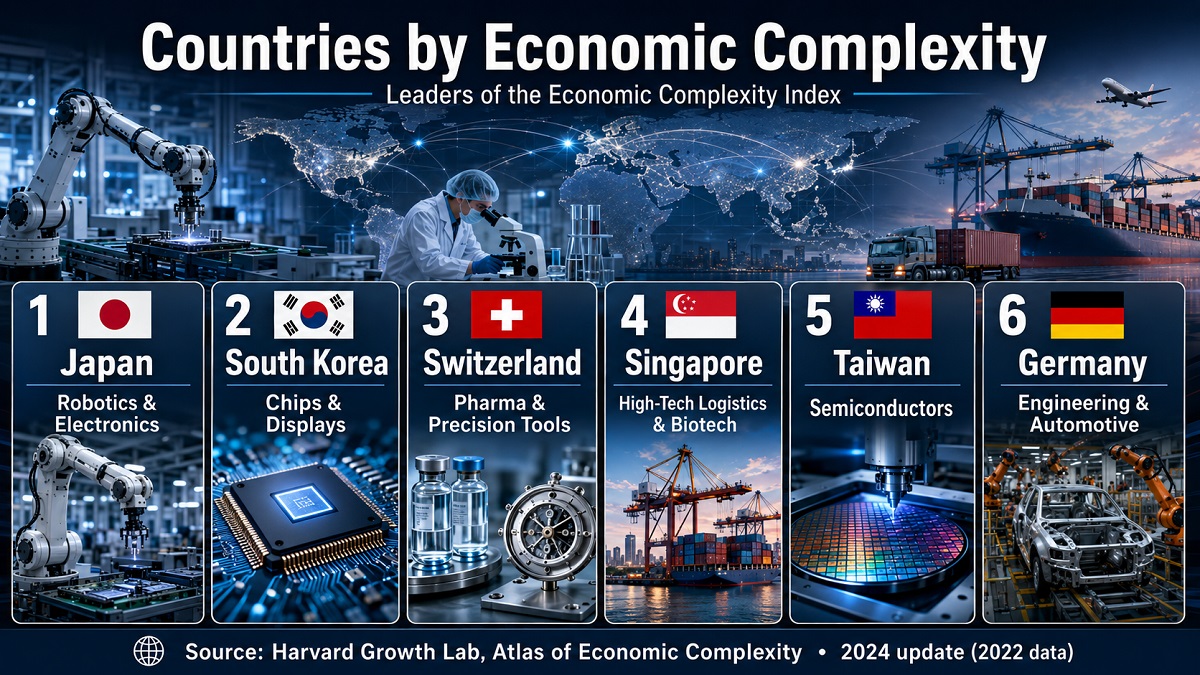
Top 100 Countries and Economies by Economic Complexity: 2026 Snapshot Based on 2023 Harvard Atlas ECI Data
This ranking compares countries and economies by the Economic Complexity Index (ECI), a source-published index score designed to capture the diversity and sophistication of an economy’s export basket. The page is a 2026 snapshot, while the numeric values are the latest available 2023 ECI scores from the Harvard Growth Lab Atlas country rankings.
The unit is an ECI index score. Higher values indicate more complex productive capabilities, so the ranking direction is descending: larger ECI scores rank higher. The table includes 100 source-published rows marked as official_value. In this page, official_value means a value published by the named source dataset, not a separate government statistical release.
No official forecasts, modeled projections, CAGR assumptions or estimated 2026 values are included. Coverage is limited to economies with numeric 2023 ECI values in the selected Atlas ranking table. The table is not a GDP ranking, not a living-standards ranking and not a forecast of future growth.
Continue exploring
More StatRanker rankings on trade flows, exports, imports and economic scale.
ECI 2.52, the highest score in the 2023 Atlas ranking used for this 2026 snapshot.
Rank 100 in this table with ECI −0.66. Economies below rank 100 are not included.
The table includes 100 economies with numeric 2023 ECI values in the selected Harvard Atlas ranking snapshot.
2026 snapshot based on latest available 2023 Harvard Atlas ECI values.
100 official_value rows, 0 official_forecast rows and 0 modeled_projection rows.
Overview
Economic complexity is strongest where economies export a wide range of goods that relatively few other economies can make competitively. The top of the table is therefore concentrated in advanced manufacturing, electronics, machinery, precision instruments, chemicals and diversified industrial supply chains.
The upper tier is led by Singapore, Switzerland, Japan, Taiwan, South Korea and Germany. Europe has a large presence in the Top 20, while Asia-Pacific economies hold several of the highest technology-heavy positions. Large commodity exporters can rank much lower than their income level because natural-resource exports do not necessarily imply broad productive know-how.
The ranking is most useful as a structural view of export capability. It should be read together with GDP per capita, export composition, services data, education, innovation and institutional indicators.
Top Table
The first ten economies all have ECI values above 1.67. This group is dominated by export baskets with dense industrial, technological or high-skill service linkages.
| Rank | Economy | ECI | Region / Note |
|---|---|---|---|
| 1 | Singapore | 2.52 | Asia-Pacific; official_value; Harvard Atlas ECI 2023. |
| 2 | Switzerland | 2.51 | Europe; official_value; Harvard Atlas ECI 2023. |
| 3 | Japan | 2.43 | Asia-Pacific; official_value; Harvard Atlas ECI 2023. |
| 4 | Taiwan | 2.24 | Asia-Pacific; official_value; Harvard Atlas ECI 2023. |
| 5 | South Korea | 2.23 | Asia-Pacific; official_value; Harvard Atlas ECI 2023. |
| 6 | Germany | 2.01 | Europe; official_value; Harvard Atlas ECI 2023. |
| 7 | United Kingdom | 1.81 | Europe; official_value; Harvard Atlas ECI 2023. |
| 8 | Ireland | 1.72 | Europe; official_value; Harvard Atlas ECI 2023. |
| 9 | Slovenia | 1.69 | Europe; official_value; Harvard Atlas ECI 2023. |
| 10 | Austria | 1.67 | Europe; official_value; Harvard Atlas ECI 2023. |
The top table is a subset of the main ranking. Equal rounded ECI values are left in the source order used by the dataset snapshot.
Chart: Top 20 countries and economies by ECI
The chart compares the 20 highest ECI values in the ranking table. Bars are scaled against the highest value, Singapore’s 2.52.
Methodology
The metric is the Economic Complexity Index, an index score derived from the diversity of an economy’s export basket and the ubiquity of the products it exports. In practical terms, an economy scores higher when it exports many products that are also exported by relatively few other diversified economies.
Metric
Economic Complexity Index, measured as a source-published index score. Higher values rank higher.
Snapshot
2026 page snapshot based on the latest available 2023 Harvard Growth Lab Atlas ECI ranking values. Data access date: June 7, 2026.
Source hierarchy
Primary dataset: Harvard Growth Lab Atlas country rankings. Method context is supported by the Hidalgo-Hausmann economic-complexity framework.
Status rules
All rows are official_value in the StatRanker table schema, meaning source-published dataset values. No official_forecast or modeled_projection rows are included.
Ranks are calculated from the numeric ECI value in descending order. Values are shown to two decimals as published or rounded in the source ranking snapshot. Missing economies, economies without numeric values and entries outside the Top 100 are excluded. When rounded values are equal, the source order is retained rather than inventing a tie-breaker.
The metric does not measure GDP, household income, export volume, innovation output, institutional quality or welfare. It also does not fully capture domestic services, non-traded capabilities or informal productive activity. Resource-rich economies can appear lower than their income level because concentrated commodity exports may not imply a broad base of complex capabilities.
ECI should be interpreted as a structural export-capability indicator. It is strongest for comparing tradable-goods complexity and weaker for economies where advanced services, domestic platforms or non-merchandise capabilities are central to value creation.
Main Ranking Table
Search by economy, filter the ranking by region or status, and switch the visible order by rank, ECI value or economy name. The ranking is based on source-published 2023 ECI values from the Harvard Growth Lab Atlas snapshot.
| Rank | Economy | ECI | Region / Note |
|---|---|---|---|
| 1 | Singapore | 2.52 | official_value Asia-Pacific; Harvard Atlas ECI 2023. |
| 2 | Switzerland | 2.51 | official_value Europe; Harvard Atlas ECI 2023. |
| 3 | Japan | 2.43 | official_value Asia-Pacific; Harvard Atlas ECI 2023. |
| 4 | Taiwan | 2.24 | official_value Asia-Pacific; Harvard Atlas ECI 2023. |
| 5 | South Korea | 2.23 | official_value Asia-Pacific; Harvard Atlas ECI 2023. |
| 6 | Germany | 2.01 | official_value Europe; Harvard Atlas ECI 2023. |
| 7 | United Kingdom | 1.81 | official_value Europe; Harvard Atlas ECI 2023. |
| 8 | Ireland | 1.72 | official_value Europe; Harvard Atlas ECI 2023. |
| 9 | Slovenia | 1.69 | official_value Europe; Harvard Atlas ECI 2023. |
| 10 | Austria | 1.67 | official_value Europe; Harvard Atlas ECI 2023. |
| 11 | Czech Republic | 1.66 | official_value Europe; Harvard Atlas ECI 2023. |
| 12 | Sweden | 1.64 | official_value Europe; Harvard Atlas ECI 2023. |
| 13 | Hungary | 1.60 | official_value Europe; Harvard Atlas ECI 2023. |
| 14 | Hong Kong | 1.58 | official_value Asia-Pacific; Harvard Atlas ECI 2023. |
| 15 | United States | 1.51 | official_value Americas; Harvard Atlas ECI 2023. |
| 16 | China | 1.47 | official_value Asia-Pacific; Harvard Atlas ECI 2023. |
| 17 | Mexico | 1.41 | official_value Americas; Harvard Atlas ECI 2023. |
| 18 | Finland | 1.41 | official_value Europe; Harvard Atlas ECI 2023. |
| 19 | Italy | 1.40 | official_value Europe; Harvard Atlas ECI 2023. |
| 20 | Israel | 1.36 | official_value Middle East & North Africa; Harvard Atlas ECI 2023. |
| 21 | Slovakia | 1.31 | official_value Europe; Harvard Atlas ECI 2023. |
| 22 | Netherlands | 1.29 | official_value Europe; Harvard Atlas ECI 2023. |
| 23 | France | 1.26 | official_value Europe; Harvard Atlas ECI 2023. |
| 24 | Denmark | 1.19 | official_value Europe; Harvard Atlas ECI 2023. |
| 25 | Belgium | 1.07 | official_value Europe; Harvard Atlas ECI 2023. |
| 26 | Romania | 1.04 | official_value Europe; Harvard Atlas ECI 2023. |
| 27 | Malaysia | 1.03 | official_value Asia-Pacific; Harvard Atlas ECI 2023. |
| 28 | Philippines | 0.92 | official_value Asia-Pacific; Harvard Atlas ECI 2023. |
| 29 | Thailand | 0.89 | official_value Asia-Pacific; Harvard Atlas ECI 2023. |
| 30 | Estonia | 0.85 | official_value Europe; Harvard Atlas ECI 2023. |
| 31 | Cyprus | 0.73 | official_value Europe; Harvard Atlas ECI 2023. |
| 32 | Croatia | 0.72 | official_value Europe; Harvard Atlas ECI 2023. |
| 33 | Poland | 0.71 | official_value Europe; Harvard Atlas ECI 2023. |
| 34 | Spain | 0.61 | official_value Europe; Harvard Atlas ECI 2023. |
| 35 | United Arab Emirates | 0.61 | official_value Middle East & North Africa; Harvard Atlas ECI 2023. |
| 36 | Lithuania | 0.59 | official_value Europe; Harvard Atlas ECI 2023. |
| 37 | Portugal | 0.57 | official_value Europe; Harvard Atlas ECI 2023. |
| 38 | Latvia | 0.54 | official_value Europe; Harvard Atlas ECI 2023. |
| 39 | Bosnia and Herzegovina | 0.53 | official_value Europe; Harvard Atlas ECI 2023. |
| 40 | Serbia | 0.53 | official_value Europe; Harvard Atlas ECI 2023. |
| 41 | Bulgaria | 0.46 | official_value Europe; Harvard Atlas ECI 2023. |
| 42 | Turkey | 0.46 | official_value Eurasia; Harvard Atlas ECI 2023. |
| 43 | Eswatini | 0.46 | official_value Sub-Saharan Africa; Harvard Atlas ECI 2023. |
| 44 | India | 0.45 | official_value Asia-Pacific; Harvard Atlas ECI 2023. |
| 45 | Jordan | 0.44 | official_value Middle East & North Africa; Harvard Atlas ECI 2023. |
| 46 | Belarus | 0.39 | official_value Europe; Harvard Atlas ECI 2023. |
| 47 | Greece | 0.36 | official_value Europe; Harvard Atlas ECI 2023. |
| 48 | Vietnam | 0.35 | official_value Asia-Pacific; Harvard Atlas ECI 2023. |
| 49 | Bahrain | 0.34 | official_value Middle East & North Africa; Harvard Atlas ECI 2023. |
| 50 | Canada | 0.29 | official_value Americas; Harvard Atlas ECI 2023. |
| 51 | Tunisia | 0.25 | official_value Middle East & North Africa; Harvard Atlas ECI 2023. |
| 52 | Norway | 0.23 | official_value Europe; Harvard Atlas ECI 2023. |
| 53 | Dominican Republic | 0.18 | official_value Americas; Harvard Atlas ECI 2023. |
| 54 | North Macedonia | 0.13 | official_value Europe; Harvard Atlas ECI 2023. |
| 55 | Trinidad and Tobago | 0.12 | official_value Americas; Harvard Atlas ECI 2023. |
| 56 | Armenia | 0.11 | official_value Eurasia; Harvard Atlas ECI 2023. |
| 57 | Lebanon | 0.09 | official_value Middle East & North Africa; Harvard Atlas ECI 2023. |
| 58 | Kyrgyzstan | 0.09 | official_value Eurasia; Harvard Atlas ECI 2023. |
| 59 | Costa Rica | 0.07 | official_value Americas; Harvard Atlas ECI 2023. |
| 60 | Saudi Arabia | 0.07 | official_value Middle East & North Africa; Harvard Atlas ECI 2023. |
| 61 | Yemen | 0.01 | official_value Middle East & North Africa; Harvard Atlas ECI 2023. |
| 62 | El Salvador | −0.10 | official_value Americas; Harvard Atlas ECI 2023. |
| 63 | Ukraine | −0.10 | official_value Europe; Harvard Atlas ECI 2023. |
| 64 | Kuwait | −0.13 | official_value Middle East & North Africa; Harvard Atlas ECI 2023. |
| 65 | Colombia | −0.14 | official_value Americas; Harvard Atlas ECI 2023. |
| 66 | Oman | −0.15 | official_value Middle East & North Africa; Harvard Atlas ECI 2023. |
| 67 | Mali | −0.15 | official_value Sub-Saharan Africa; Harvard Atlas ECI 2023. |
| 68 | New Zealand | −0.18 | official_value Oceania; Harvard Atlas ECI 2023. |
| 69 | Uruguay | −0.22 | official_value Americas; Harvard Atlas ECI 2023. |
| 70 | Uzbekistan | −0.23 | official_value Eurasia; Harvard Atlas ECI 2023. |
| 71 | Egypt | −0.24 | official_value Middle East & North Africa; Harvard Atlas ECI 2023. |
| 72 | Indonesia | −0.24 | official_value Asia-Pacific; Harvard Atlas ECI 2023. |
| 73 | Nepal | −0.25 | official_value Asia-Pacific; Harvard Atlas ECI 2023. |
| 74 | Mauritius | −0.27 | official_value Sub-Saharan Africa; Harvard Atlas ECI 2023. |
| 75 | Guatemala | −0.28 | official_value Americas; Harvard Atlas ECI 2023. |
| 76 | Moldova | −0.28 | official_value Europe; Harvard Atlas ECI 2023. |
| 77 | South Africa | −0.28 | official_value Sub-Saharan Africa; Harvard Atlas ECI 2023. |
| 78 | Iran | −0.29 | official_value Middle East & North Africa; Harvard Atlas ECI 2023. |
| 79 | Sri Lanka | −0.30 | official_value Asia-Pacific; Harvard Atlas ECI 2023. |
| 80 | Cambodia | −0.33 | official_value Asia-Pacific; Harvard Atlas ECI 2023. |
| 81 | Burkina Faso | −0.33 | official_value Sub-Saharan Africa; Harvard Atlas ECI 2023. |
| 82 | Albania | −0.34 | official_value Europe; Harvard Atlas ECI 2023. |
| 83 | Qatar | −0.35 | official_value Middle East & North Africa; Harvard Atlas ECI 2023. |
| 84 | Jamaica | −0.37 | official_value Americas; Harvard Atlas ECI 2023. |
| 85 | Gabon | −0.41 | official_value Sub-Saharan Africa; Harvard Atlas ECI 2023. |
| 86 | Argentina | −0.41 | official_value Americas; Harvard Atlas ECI 2023. |
| 87 | Kenya | −0.43 | official_value Sub-Saharan Africa; Harvard Atlas ECI 2023. |
| 88 | Chile | −0.44 | official_value Americas; Harvard Atlas ECI 2023. |
| 89 | Kazakhstan | −0.44 | official_value Eurasia; Harvard Atlas ECI 2023. |
| 90 | Georgia | −0.50 | official_value Eurasia; Harvard Atlas ECI 2023. |
| 91 | Morocco | −0.50 | official_value Middle East & North Africa; Harvard Atlas ECI 2023. |
| 92 | Honduras | −0.51 | official_value Americas; Harvard Atlas ECI 2023. |
| 93 | Brazil | −0.52 | official_value Americas; Harvard Atlas ECI 2023. |
| 94 | Paraguay | −0.56 | official_value Americas; Harvard Atlas ECI 2023. |
| 95 | Azerbaijan | −0.57 | official_value Eurasia; Harvard Atlas ECI 2023. |
| 96 | Laos | −0.58 | official_value Asia-Pacific; Harvard Atlas ECI 2023. |
| 97 | Uganda | −0.63 | official_value Sub-Saharan Africa; Harvard Atlas ECI 2023. |
| 98 | Algeria | −0.65 | official_value Middle East & North Africa; Harvard Atlas ECI 2023. |
| 99 | Pakistan | −0.65 | official_value Asia-Pacific; Harvard Atlas ECI 2023. |
| 100 | Russia | −0.66 | official_value Eurasia; Harvard Atlas ECI 2023. |
Source snapshot: Harvard Growth Lab Atlas country rankings, Economic Complexity Index, 2023 values used as a 2026 analytical snapshot. Data access date: June 7, 2026. All rows are source-published values; no forecasts, modeled projections or estimated 2026 values are included.
Insights
Key Insight
High ECI is concentrated in economies with deep manufacturing and technology-linked export baskets. The top six are Singapore, Switzerland, Japan, Taiwan, South Korea and Germany, which reflects dense roles in electronics, machinery, chemicals, precision goods and advanced supply chains.
Notable Pattern
Europe is heavily represented through the upper and middle tiers, while Asia-Pacific economies occupy several of the very highest positions. The pattern shows that both long-established industrial bases and export-oriented technology hubs can score highly.
Regional Concentration
The Top 20 includes a strong European cluster, an Asia-Pacific technology cluster, two Americas entries and one Middle East entry. The Americas appear mainly through the United States and Mexico near the top tier, while many commodity-linked economies sit lower.
Outlier
Eswatini appears in the upper half of the Top 100 with an ECI of 0.46. This does not mean it is richer than larger economies; it means the selected export basket is less ubiquitous than its size alone would suggest.
What It Means
ECI is useful for reading the productive structure behind an economy. A high score suggests that an economy participates in a wide set of complex tradable activities and may have capabilities that can support movement into related high-value sectors.
The ranking should not be read as a direct measure of wealth, welfare or quality of life. It is possible for a high-income resource exporter to rank lower than a smaller industrial economy because the index rewards diversified and less ubiquitous export capabilities rather than income level alone.
Official_value rows in this page are source-published 2023 dataset values. The table does not contain projections, so it does not claim that the listed ECI scores are measured 2026 values or forecasts for future productive capability.
FAQ
Which economy ranks first by ECI in this 2026 snapshot?
Singapore ranks first with an ECI score of 2.52 in the 2023 Harvard Atlas values used for this page snapshot.
Does ECI measure GDP or living standards?
No. ECI measures export-basket complexity, not GDP, income, wages, household welfare or public-service quality.
Why can a rich resource exporter rank lower?
An economy can be wealthy because of oil, gas or minerals while still having a relatively narrow export basket, which lowers its ECI.
Does ECI measure services?
The standard country-level ECI is primarily tied to tradable goods data. It can understate capability in economies where advanced services are important but not fully reflected in merchandise exports.
Why are there territories or economies in a country ranking?
Economic-complexity datasets often rank economies with separately reported trade data. The table therefore uses “countries and economies” where the source provides a numeric ECI value.
Are there forecasts or modeled projections in this ranking?
No. Every row is a source-published 2023 ECI value. No official forecasts, modeled projections, CAGR assumptions or estimated 2026 values are included.
Sources
Harvard Growth Lab — The Atlas of Economic Complexity, Country Rankings
Primary source for the ECI ranking values used in the table. Purpose: country/economy-level Economic Complexity Index values and rank order. Data access date for this page: June 7, 2026.
Harvard Growth Lab — Atlas Data Downloads
Dataset environment for Atlas trade and economic-complexity downloads. Purpose: source context, data availability and reproducibility checks.
Hidalgo & Hausmann — The Building Blocks of Economic Complexity
Foundational methodology paper for the Economic Complexity Index framework. Purpose: definition and interpretation of ECI as a productive-knowledge measure.
Observatory of Economic Complexity — Country Complexity Rankings
Secondary complexity-ranking environment used for methodology comparison only. Purpose: confirming that ECI rankings can differ by source classification and dataset version.
Related rankings
More StatRanker rankings on trade flows, exports, imports and economic scale.
