

Top 50 U.S. Metropolitan Areas by GDP
Top 50 U.S. Metropolitan Areas by GDP
This 2026 snapshot ranks 50 U.S. metropolitan statistical areas by nominal gross domestic product. Values are 2024 current-dollar GDP totals, stored as millions of U.S. dollars in the row data attributes and displayed in billions for readability. The table is a compiled research dataset based on four source types: official BEA county GDP, OMB statistical-area standards, Census/OMB county-based MSA delineation files and a secondary public comparison table used only for order checks.
The important distinction is official county input versus compiled metro output. The GDP components are official BEA county-level values, while the metropolitan totals shown here are compiled county-to-MSA sums based on the selected OMB/Census delineation. This page does not present the values as a standalone BEA 2024 metropolitan GDP release.
Coverage is limited to 50 verified rows. The table contains 50 compiled official-source rows, 0 official forecasts and 0 modeled projections. No 2026 forecast, CAGR or growth assumption is applied.
Continue exploring
More StatRanker pages connected by topic, category or ranking theme.
Global Microchip Production in 2025: A Comprehensive Overview
Open rankingPPP GDP of the world 2025
Open rankingEconomic Diversification: The Path from Resource Dependency
Open ranking$2,442,500 million in 2024 nominal GDP for New York-Newark-Jersey City.
$92,356 million in 2024 nominal GDP for Omaha, NE-IA MSA.
Top N equals the number of confirmed rows. This page does not claim Top 100 coverage.
50 compiled official-source rows, 0 official forecasts and 0 modeled projections.
Overview
Metropolitan GDP measures the value of production inside a regional economy. It is useful for comparing market scale, business activity, logistics weight, technology clusters, energy hubs and government-centered economies. It is not a direct measure of household income, affordability, productivity per worker or quality of life.
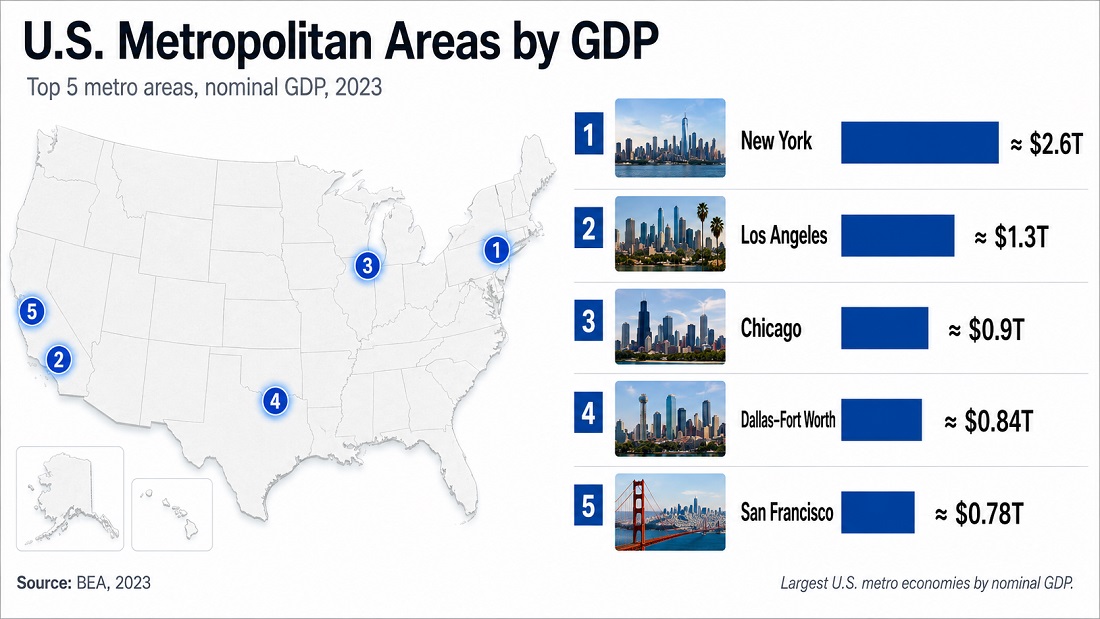
The upper end of the ranking is highly concentrated. New York-Newark-Jersey City is the only metro above $2.4 trillion, Los Angeles-Long Beach-Anaheim is the only other entry above $1.3 trillion, and Chicago remains the largest Midwest metro in this table. San Francisco and Dallas-Fort Worth sit close to one another around the $800 billion mark, showing that very different regional economies can reach a similar total-output scale.
Top 10 U.S. metro economies
The first ten rows show three broad patterns: very large national command centers, large Sun Belt business hubs and high-output innovation regions. The values are total nominal GDP, so population size and industry mix both affect position.
| Rank | Metro area | Value | Source / method note |
|---|---|---|---|
| 1 | New York-Newark-Jersey City, NY-NJ-PA | $2,442.5B | compiled official-source value; BEA county GDP to OMB/Census MSA sum; 2024 current USD. |
| 2 | Los Angeles-Long Beach-Anaheim, CA | $1,354.7B | compiled official-source value; BEA county GDP to OMB/Census MSA sum; 2024 current USD. |
| 3 | Chicago-Naperville-Elgin, IL-IN-WI | $923.1B | compiled official-source value; BEA county GDP to OMB/Census MSA sum; 2024 current USD. |
| 4 | San Francisco-Oakland-Berkeley, CA | $801.3B | compiled official-source value; BEA county GDP to OMB/Census MSA sum; 2024 current USD. |
| 5 | Dallas-Fort Worth-Arlington, TX | $800.6B | compiled official-source value; BEA county GDP to OMB/Census MSA sum; 2024 current USD. |
| 6 | Houston-The Woodlands-Sugar Land, TX | $757.8B | compiled official-source value; BEA county GDP to OMB/Census MSA sum; 2024 current USD. |
| 7 | Washington-Arlington-Alexandria, DC-VA-MD-WV | $749.1B | compiled official-source value; BEA county GDP to OMB/Census MSA sum; 2024 current USD. |
| 8 | Boston-Cambridge-Newton, MA-NH | $644.8B | compiled official-source value; BEA county GDP to OMB/Census MSA sum; 2024 current USD. |
| 9 | Atlanta-Sandy Springs-Roswell, GA | $604.3B | compiled official-source value; BEA county GDP to OMB/Census MSA sum; 2024 current USD. |
| 10 | Seattle-Tacoma-Bellevue, WA | $604.1B | compiled official-source value; BEA county GDP to OMB/Census MSA sum; 2024 current USD. |
Values are displayed in billions for readability. The stored unit is millions of current U.S. dollars.
Chart: Top 20 metro GDP values
The chart uses New York-Newark-Jersey City as the 100% reference bar. Los Angeles is about 55% of New York’s value, Chicago is below 40%, and most entries after the Bay Area, Dallas-Fort Worth, Houston and Washington are under 30% of the New York benchmark.
Chart fallback: the Top 20 values range from $2,442.5B for New York-Newark-Jersey City to $275.4B for Baltimore-Columbia-Towson.
Methodology
Metric: compiled nominal gross domestic product for U.S. metropolitan statistical areas. Unit: millions of current U.S. dollars. Direction: descending, so larger GDP ranks higher. Target year: 2024. Snapshot label: 2026, because the page presents the latest available 2024 local-area GDP base in a 2026 publication context.
Source hierarchy
BEA county-level GDP is the official statistical base. OMB statistical standards and Census/OMB delineation files define county-based MSA membership. Public comparison material is used only as a secondary order check, not as the source of the numeric values.
Calculation path
Compiled MSA GDP = sum of BEA 2024 current-dollar GDP values for all counties assigned to the selected metropolitan statistical area in the county-based MSA delineation file.
Status rule
The row status reflects official county-level GDP input, not a separately published BEA metropolitan GDP table. The displayed value is treated as a compiled official-source value because it sums unchanged BEA 2024 county GDP figures into OMB/Census MSA boundaries.
Inclusion rule
Only 50 verified rows are included. The page does not add unverified metros to force a Top 100 headline.
Mini audit note
Audit path: New York-Newark-Jersey City equals the sum of 2024 BEA current-dollar GDP for counties assigned to the MSA in the OMB/Census delineation file. County-level line items are not printed because the public table is limited to four columns; the calculation uses unchanged county-level source values.
Rounding: each row stores the numeric data-value in millions of current U.S. dollars and displays values in billions with one decimal place. Example: 2,442,500 million is displayed as $2,442.5B. Because the metric is current-dollar GDP, it reflects both output and price-level changes.
Main limits: MSA boundaries can change; county-to-MSA aggregation depends on the selected delineation file; nominal GDP does not adjust for local price levels; total GDP favors large population centers; and a high metro GDP does not prove high wages, affordability, productivity per worker or household wealth.
Main ranking table: Top 50 U.S. metropolitan areas by GDP
Filter the existing HTML table by metro name, region, status, sort order or visible rank range. Without JavaScript, all 50 rows remain visible.
| Rank | Metro area | Value | Source / method note |
|---|---|---|---|
| 1 | New York-Newark-Jersey City, NY-NJ-PA | $2,442.5B | compiled official-source value; BEA county GDP to OMB/Census MSA sum; 2024 current USD; Northeast. |
| 2 | Los Angeles-Long Beach-Anaheim, CA | $1,354.7B | compiled official-source value; BEA county GDP to OMB/Census MSA sum; 2024 current USD; West. |
| 3 | Chicago-Naperville-Elgin, IL-IN-WI | $923.1B | compiled official-source value; BEA county GDP to OMB/Census MSA sum; 2024 current USD; Midwest. |
| 4 | San Francisco-Oakland-Berkeley, CA | $801.3B | compiled official-source value; BEA county GDP to OMB/Census MSA sum; 2024 current USD; West. |
| 5 | Dallas-Fort Worth-Arlington, TX | $800.6B | compiled official-source value; BEA county GDP to OMB/Census MSA sum; 2024 current USD; South. |
| 6 | Houston-The Woodlands-Sugar Land, TX | $757.8B | compiled official-source value; BEA county GDP to OMB/Census MSA sum; 2024 current USD; South. |
| 7 | Washington-Arlington-Alexandria, DC-VA-MD-WV | $749.1B | compiled official-source value; BEA county GDP to OMB/Census MSA sum; 2024 current USD; Multi-region. |
| 8 | Boston-Cambridge-Newton, MA-NH | $644.8B | compiled official-source value; BEA county GDP to OMB/Census MSA sum; 2024 current USD; Northeast. |
| 9 | Atlanta-Sandy Springs-Roswell, GA | $604.3B | compiled official-source value; BEA county GDP to OMB/Census MSA sum; 2024 current USD; South. |
| 10 | Seattle-Tacoma-Bellevue, WA | $604.1B | compiled official-source value; BEA county GDP to OMB/Census MSA sum; 2024 current USD; West. |
| 11 | Philadelphia-Camden-Wilmington, PA-NJ-DE-MD | $582.1B | compiled official-source value; BEA county GDP to OMB/Census MSA sum; 2024 current USD; Multi-region. |
| 12 | Miami-Fort Lauderdale-West Palm Beach, FL | $575.0B | compiled official-source value; BEA county GDP to OMB/Census MSA sum; 2024 current USD; South. |
| 13 | San Jose-Sunnyvale-Santa Clara, CA | $441.8B | compiled official-source value; BEA county GDP to OMB/Census MSA sum; 2024 current USD; West. |
| 14 | Phoenix-Mesa-Scottsdale, AZ | $435.5B | compiled official-source value; BEA county GDP to OMB/Census MSA sum; 2024 current USD; West. |
| 15 | Minneapolis-St. Paul-Bloomington, MN-WI | $369.3B | compiled official-source value; BEA county GDP to OMB/Census MSA sum; 2024 current USD; Midwest. |
| 16 | Detroit-Warren-Dearborn, MI | $348.0B | compiled official-source value; BEA county GDP to OMB/Census MSA sum; 2024 current USD; Midwest. |
| 17 | San Diego-Carlsbad, CA | $331.9B | compiled official-source value; BEA county GDP to OMB/Census MSA sum; 2024 current USD; West. |
| 18 | Denver-Aurora-Lakewood, CO | $330.2B | compiled official-source value; BEA county GDP to OMB/Census MSA sum; 2024 current USD; West. |
| 19 | Charlotte-Concord-Gastonia, NC-SC | $277.1B | compiled official-source value; BEA county GDP to OMB/Census MSA sum; 2024 current USD; South. |
| 20 | Baltimore-Columbia-Towson, MD | $275.4B | compiled official-source value; BEA county GDP to OMB/Census MSA sum; 2024 current USD; South. |
| 21 | Riverside-San Bernardino-Ontario, CA | $272.7B | compiled official-source value; BEA county GDP to OMB/Census MSA sum; 2024 current USD; West. |
| 22 | Austin-Round Rock, TX | $268.4B | compiled official-source value; BEA county GDP to OMB/Census MSA sum; 2024 current USD; South. |
| 23 | Tampa-St. Petersburg-Clearwater, FL | $261.6B | compiled official-source value; BEA county GDP to OMB/Census MSA sum; 2024 current USD; South. |
| 24 | St. Louis, MO-IL | $236.8B | compiled official-source value; BEA county GDP to OMB/Census MSA sum; 2024 current USD; Midwest. |
| 25 | Orlando-Kissimmee-Sanford, FL | $233.2B | compiled official-source value; BEA county GDP to OMB/Census MSA sum; 2024 current USD; South. |
| 26 | Portland-Vancouver-Hillsboro, OR-WA | $225.3B | compiled official-source value; BEA county GDP to OMB/Census MSA sum; 2024 current USD; West. |
| 27 | Nashville-Davidson–Murfreesboro–Franklin, TN | $223.0B | compiled official-source value; BEA county GDP to OMB/Census MSA sum; 2024 current USD; South. |
| 28 | Indianapolis-Carmel-Anderson, IN | $199.2B | compiled official-source value; BEA county GDP to OMB/Census MSA sum; 2024 current USD; Midwest. |
| 29 | Cincinnati, OH-KY-IN | $198.9B | compiled official-source value; BEA county GDP to OMB/Census MSA sum; 2024 current USD; Midwest. |
| 30 | Pittsburgh, PA | $194.2B | compiled official-source value; BEA county GDP to OMB/Census MSA sum; 2024 current USD; Northeast. |
| 31 | Sacramento–Roseville–Arden-Arcade, CA | $189.6B | compiled official-source value; BEA county GDP to OMB/Census MSA sum; 2024 current USD; West. |
| 32 | Kansas City, MO-KS | $185.7B | compiled official-source value; BEA county GDP to OMB/Census MSA sum; 2024 current USD; Midwest. |
| 33 | San Antonio-New Braunfels, TX | $182.1B | compiled official-source value; BEA county GDP to OMB/Census MSA sum; 2024 current USD; South. |
| 34 | Columbus, OH | $182.1B | compiled official-source value; BEA county GDP to OMB/Census MSA sum; 2024 current USD; Midwest. |
| 35 | Las Vegas-Henderson-Paradise, NV | $178.4B | compiled official-source value; BEA county GDP to OMB/Census MSA sum; 2024 current USD; West. |
| 36 | Cleveland-Elyria, OH | $173.1B | compiled official-source value; BEA county GDP to OMB/Census MSA sum; 2024 current USD; Midwest. |
| 37 | Salt Lake City, UT | $147.5B | compiled official-source value; BEA county GDP to OMB/Census MSA sum; 2024 current USD; West. |
| 38 | Raleigh, NC | $133.1B | compiled official-source value; BEA county GDP to OMB/Census MSA sum; 2024 current USD; South. |
| 39 | Milwaukee-Waukesha-West Allis, WI | $130.9B | compiled official-source value; BEA county GDP to OMB/Census MSA sum; 2024 current USD; Midwest. |
| 40 | Jacksonville, FL | $129.1B | compiled official-source value; BEA county GDP to OMB/Census MSA sum; 2024 current USD; South. |
| 41 | Virginia Beach-Norfolk-Newport News, VA-NC | $127.5B | compiled official-source value; BEA county GDP to OMB/Census MSA sum; 2024 current USD; South. |
| 42 | Hartford-East Hartford-Middletown, CT | $122.8B | compiled official-source value; BEA county GDP to OMB/Census MSA sum; 2024 current USD; Northeast. |
| 43 | Richmond, VA | $117.0B | compiled official-source value; BEA county GDP to OMB/Census MSA sum; 2024 current USD; South. |
| 44 | Bridgeport-Stamford-Norwalk, CT | $116.0B | compiled official-source value; BEA county GDP to OMB/Census MSA sum; 2024 current USD; Northeast. |
| 45 | Providence-Warwick, RI-MA | $111.8B | compiled official-source value; BEA county GDP to OMB/Census MSA sum; 2024 current USD; Northeast. |
| 46 | Memphis, TN-MS-AR | $102.9B | compiled official-source value; BEA county GDP to OMB/Census MSA sum; 2024 current USD; Multi-region. |
| 47 | New Orleans-Metairie, LA | $102.4B | compiled official-source value; BEA county GDP to OMB/Census MSA sum; 2024 current USD; South. |
| 48 | Oklahoma City, OK | $100.1B | compiled official-source value; BEA county GDP to OMB/Census MSA sum; 2024 current USD; South. |
| 49 | Louisville/Jefferson County, KY-IN | $97.8B | compiled official-source value; BEA county GDP to OMB/Census MSA sum; 2024 current USD; Multi-region. |
| 50 | Omaha, NE-IA MSA | $92.4B | compiled official-source value; BEA county GDP to OMB/Census MSA sum; 2024 current USD; Midwest. |
Table note: values are nominal 2024 GDP in millions of current U.S. dollars, displayed as billions. Row notes distinguish the official county GDP base from the compiled metropolitan total.
Insights
New York sits in a separate scale tier
New York-Newark-Jersey City is about 1.8 times the Los Angeles value and about 2.6 times the Chicago value in this compiled 2024 table.
Texas places two metros in the top six
Dallas-Fort Worth and Houston both exceed $750 billion. The table shows their total-output scale, not the relative contribution of any one industry.
The South appears throughout the Top 50
Southern metros appear in the top tier, middle tier and lower end of the table, including Dallas-Fort Worth, Houston, Atlanta, Miami, Charlotte, Austin, Tampa, Orlando, Nashville, Raleigh, Richmond and Oklahoma City.
San Jose ranks high for a smaller metro
San Jose-Sunnyvale-Santa Clara ranks 13th, ahead of many larger metros by population. The ranking reflects total output, not population size alone.
What It Means
A high metro GDP means the region produces a large amount of economic output. For companies, it can signal a large customer base, deep labor markets, supplier density and major infrastructure. For public-sector readers, it helps identify where national output is concentrated.
The metric should not be used as a direct living-standard ranking. A metro can rank high because it has many people, high-value industries or both. Conversely, a smaller metro can have strong income growth, high household incomes or high quality of life without appearing near the top of a total-output table.
The important interpretation point is official county input versus compiled metro output. This page does not forecast 2026 GDP. It is a 2026 snapshot based on the latest available 2024 county GDP base and compiled metropolitan aggregation. No growth assumption has been applied to move 2024 values forward.
FAQ
Which U.S. metro area has the largest GDP in this table?
New York-Newark-Jersey City ranks first with $2,442.5 billion in 2024 nominal GDP.
Is this a Top 100 ranking?
No. This is a Top 50 ranking because the verified compiled dataset contains 50 metropolitan statistical areas. The page does not add rows only to force a larger title.
Does the 2026 snapshot mean the GDP values are from 2026?
No. The page is a 2026 publication snapshot based on the latest available 2024 county GDP base. No 2026 modeled projection is used.
Are these values directly published as BEA metropolitan GDP?
No. The numeric base is official BEA county GDP. The displayed metropolitan totals are compiled by summing counties assigned to each MSA under the selected OMB/Census delineation.
Why use current-dollar GDP?
Current-dollar GDP shows the nominal scale of regional output in the year measured. It is appropriate for comparing the dollar size of metro economies, but it does not remove inflation or local price-level differences.
Why do some multi-state metro areas have a Multi-region label?
Some MSAs cross state or regional lines. The label is used where a single regional category would hide that boundary issue.
Does a high metro GDP mean residents are richer?
Not necessarily. Total GDP is an aggregate output measure. Household income, income distribution, cost of living, wealth and quality of life require separate metrics.
Sources
Official data source: U.S. Bureau of Economic Analysis — GDP by County and Metropolitan Area
Used as the official current-dollar GDP base. This page uses unchanged 2024 county-level GDP values as the numerical input for compiled metro totals.
BEA GDP by county, metro and other areasBoundary source: U.S. Census Bureau — Metropolitan and Micropolitan Delineation Files
Used to identify counties assigned to metropolitan statistical areas under OMB/Census delineations.
Census delineation filesStandards source: Office of Management and Budget — Statistical Area Standards
Used for the statistical-area framework behind metropolitan delineations and county-based aggregation.
OMB statistical programs and standardsSecondary order check: public metropolitan GDP comparison table
Used only to compare general ordering and identify possible transcription issues. It is not treated as the primary numeric source.
Public comparison tableRelated rankings
More StatRanker pages connected by topic, category or ranking theme.
