


Top 100 Countries by Cost of Housing vs
Housing affordability by country · house price-to-income ratio · Numbeo 2026 Countries Where Home Prices Are Highest Compared With Income

Housing affordability by country · house price-to-income ratio · Numbeo 2026 Countries Where Home Prices Are Highest Compared With Income

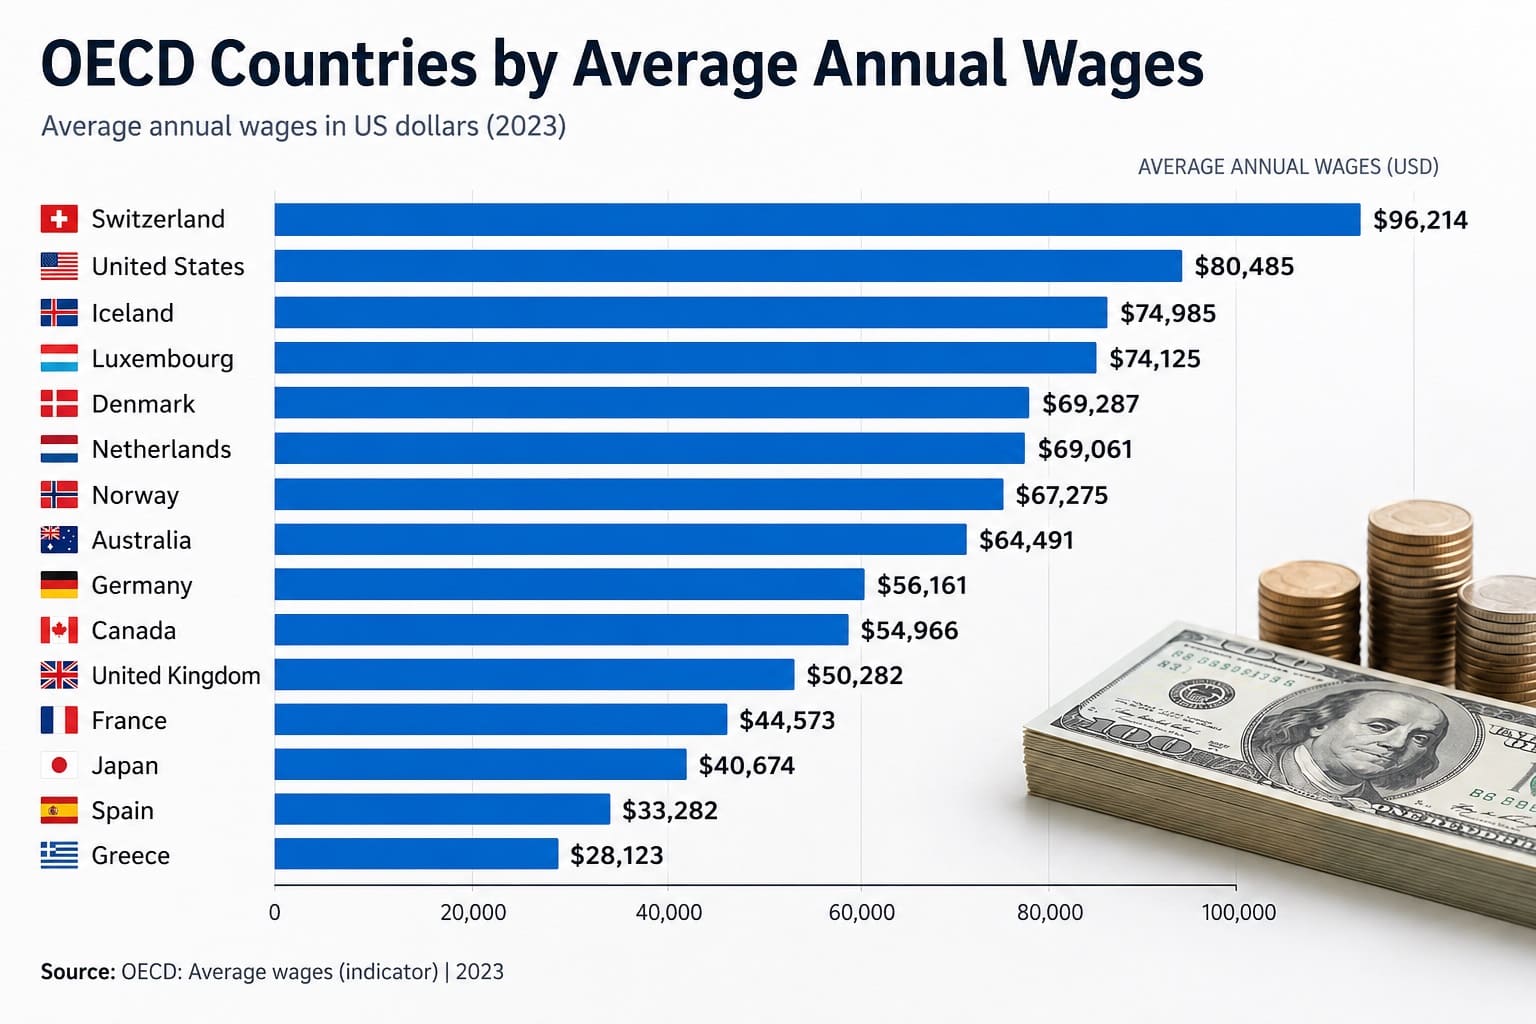
Wages and incomes · OECD labour taxation · 2026 snapshot How much gross pay OECD workers keep after tax The
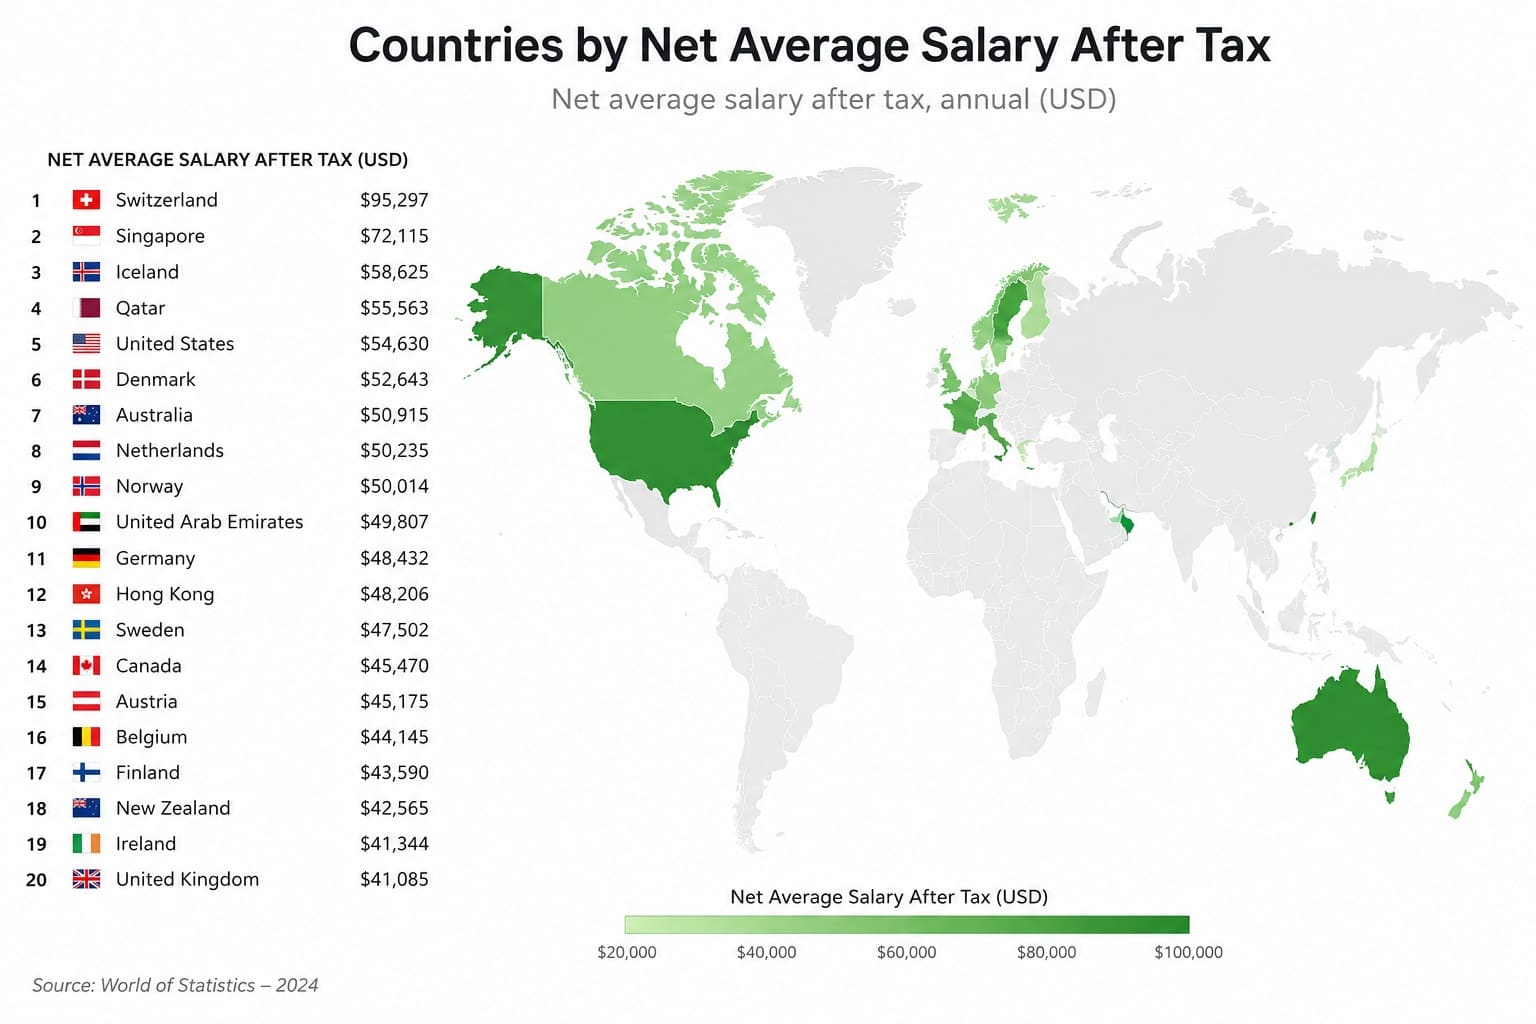
Wages and incomes · salary after tax · 2026 snapshot Numbeo-Based Salary Snapshot: Average Monthly Pay After Tax Switzerland ranks
Foreign trade · exports · 2026 snapshot Global Export Leaders by Country and Economy China leads this export ranking with
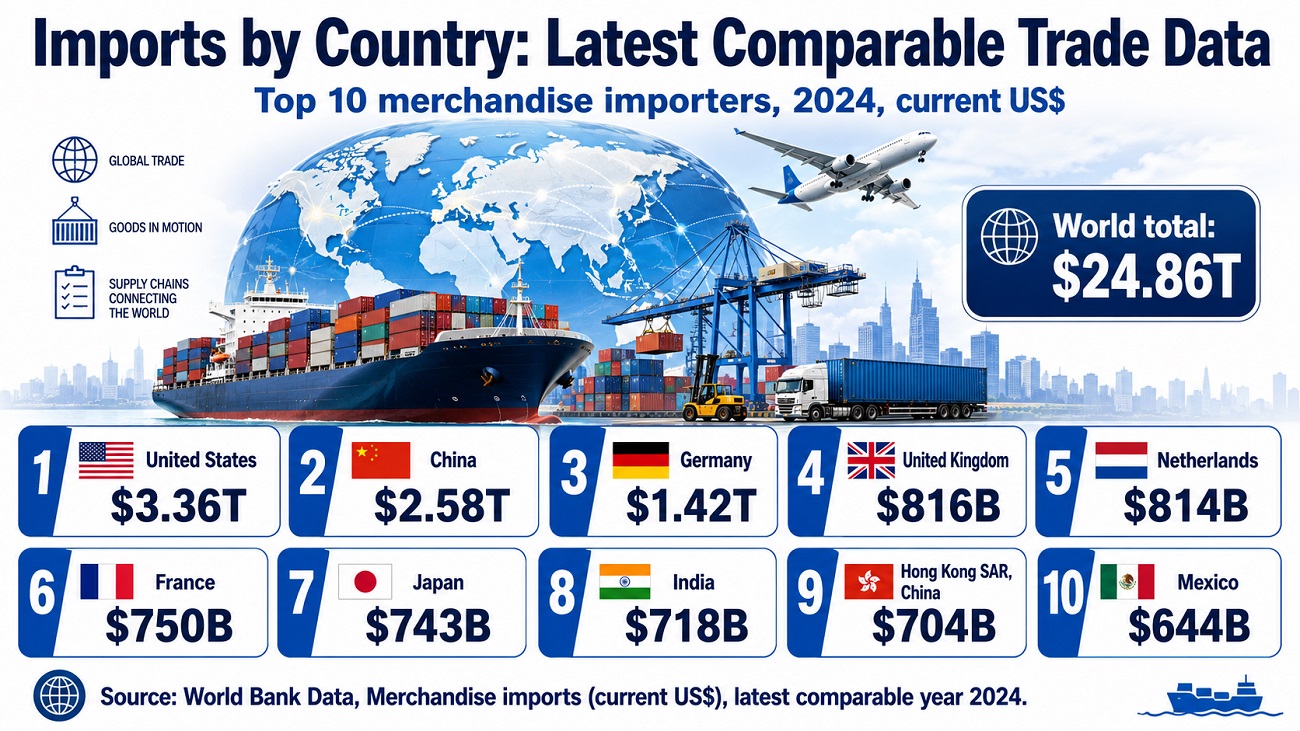
Foreign trade · imports · 2026 snapshot Top Importing Countries by Goods and Services Imports The United States is the
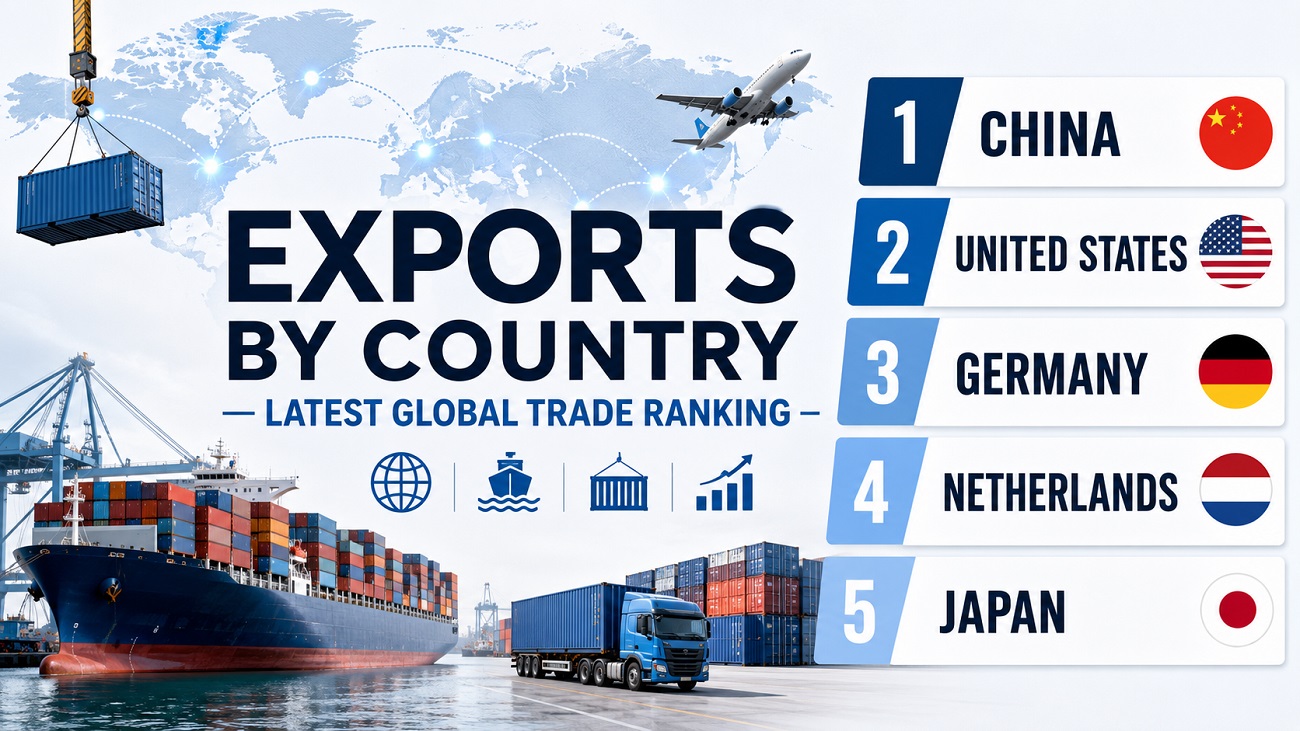
Foreign trade · exports · 2026 snapshot Exports by Country: Top 50 Ranking Snapshot Based on Latest Available World Bank
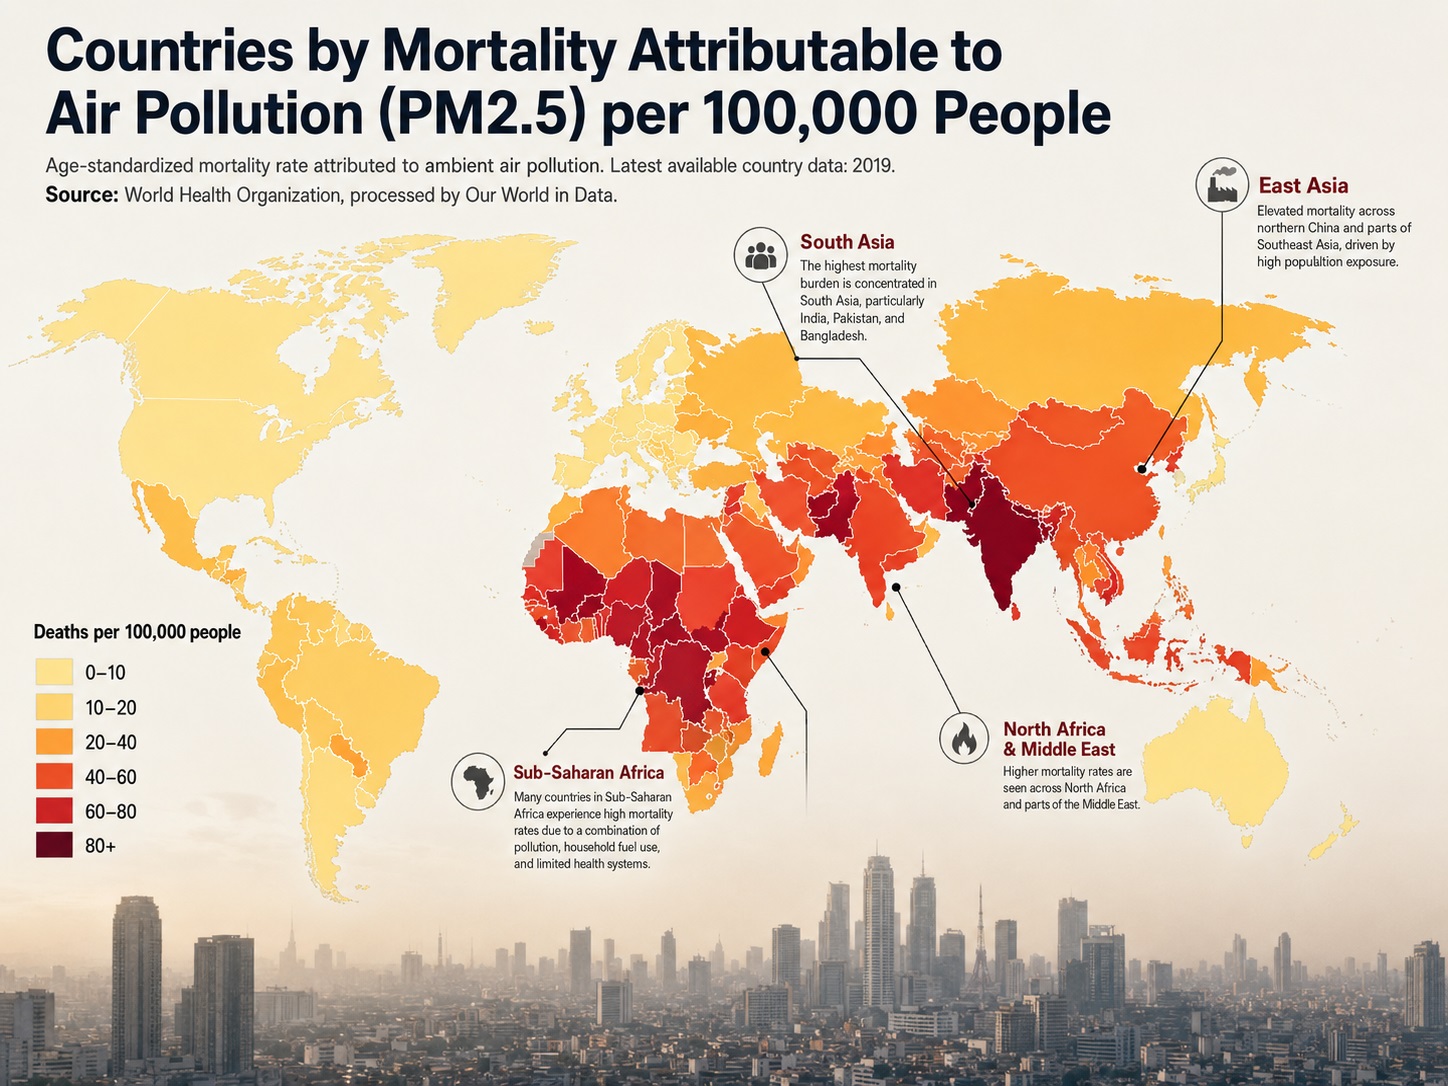
Health · air pollution burden · 2026 snapshot based on 2019 data Air-pollution-attributable mortality by country: 2026 snapshot based on

Economy · Macroeconomics · IMF WEO 2026 forecast 2026 IMF forecast snapshot of the world’s largest PPP economies This ranking

Economy · banking stability · 2026 snapshot Reported Bank Loan Stress by Country This ranking compares countries and areas by

Semiconductor trade · HS 8542 · 2024 official values Global Leaders in Integrated Circuit Exports: 2024 WITS Snapshot This ranking
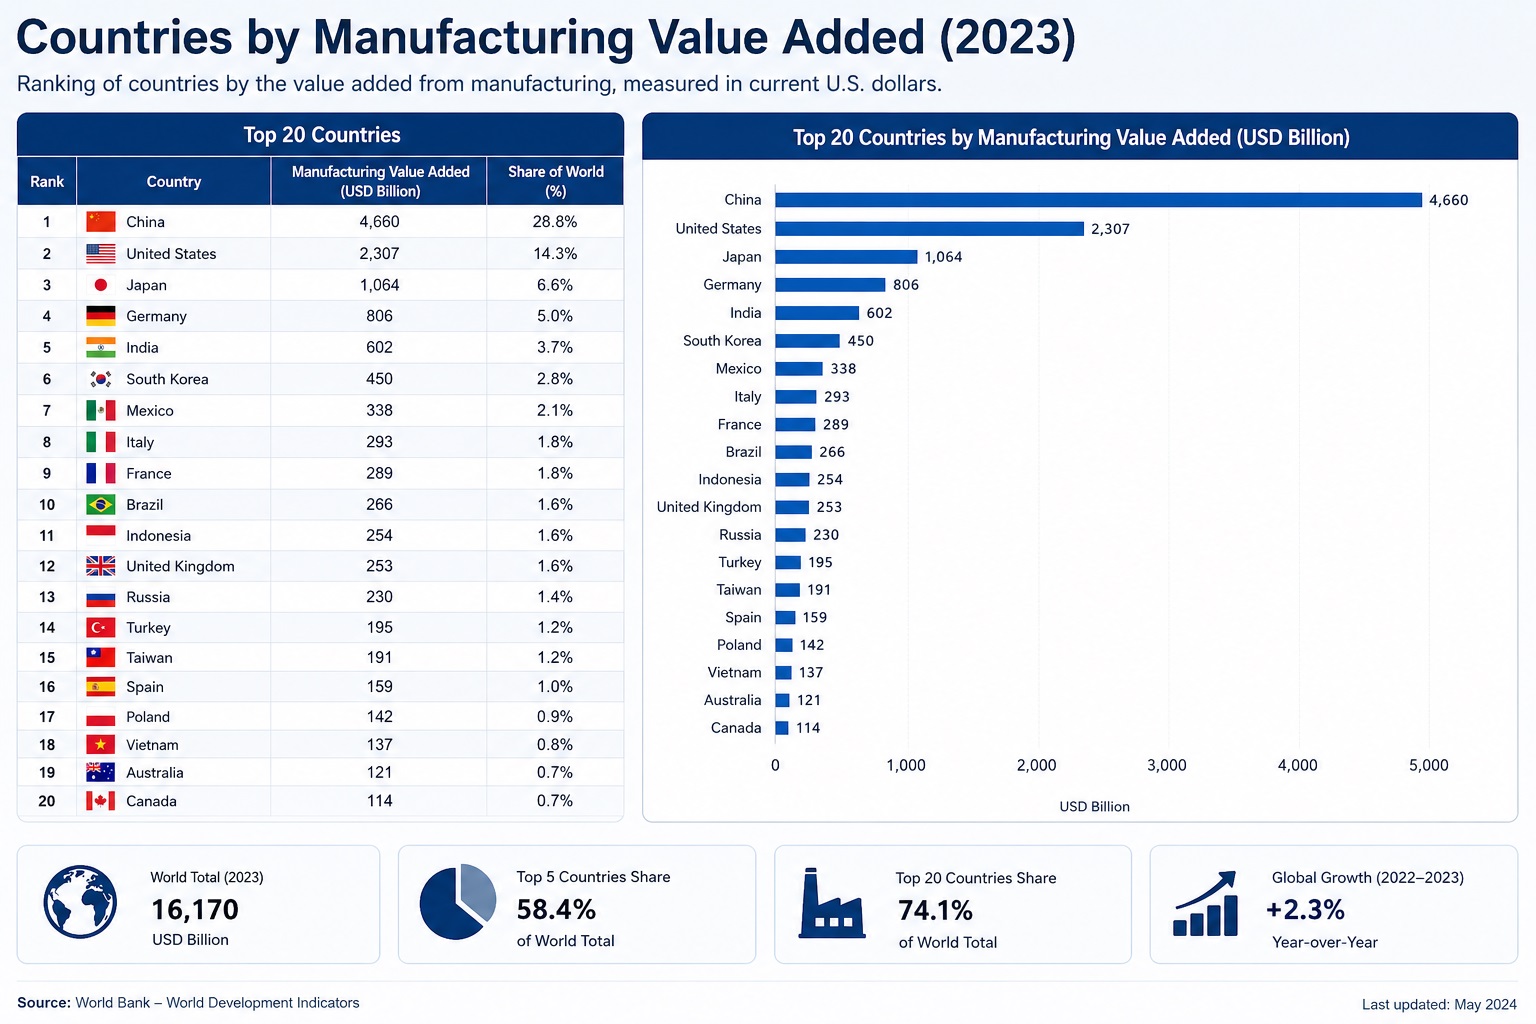
Manufacturing value added · 2026 latest-available World Bank snapshot Top 100 Countries and Economies by Manufacturing Value Added: 2026 Snapshot

Patents · PCT international applications · 2025 WIPO estimate Top 100 countries and origins by PCT international patent applications This
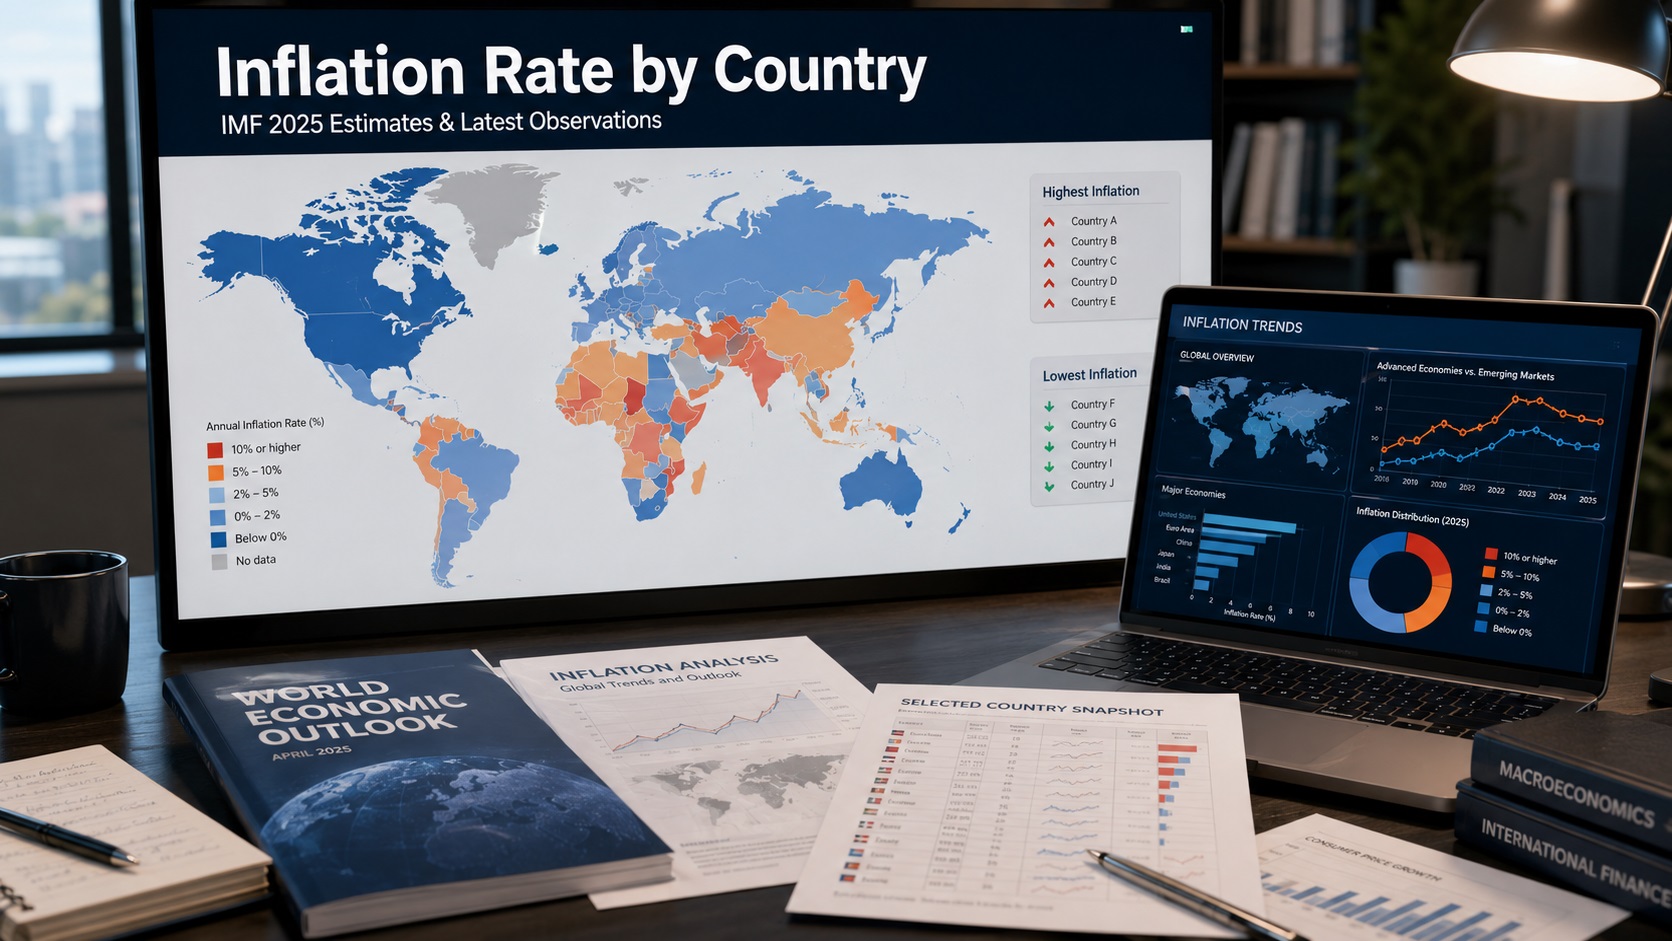
Economy · Inflation and prices · 2025 Top 10 Countries by IMF 2025 Average Inflation Estimate This ranking compares countries
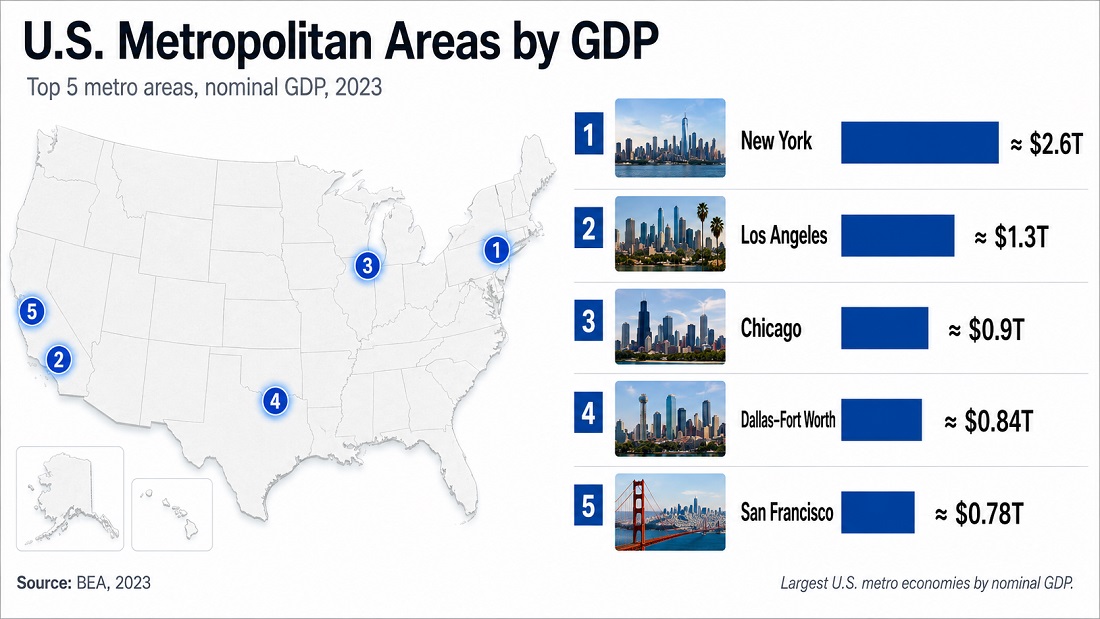
U.S. metropolitan economy · 2026 snapshot based on latest available 2024 county GDP Top 50 U.S. Metropolitan Areas by GDP
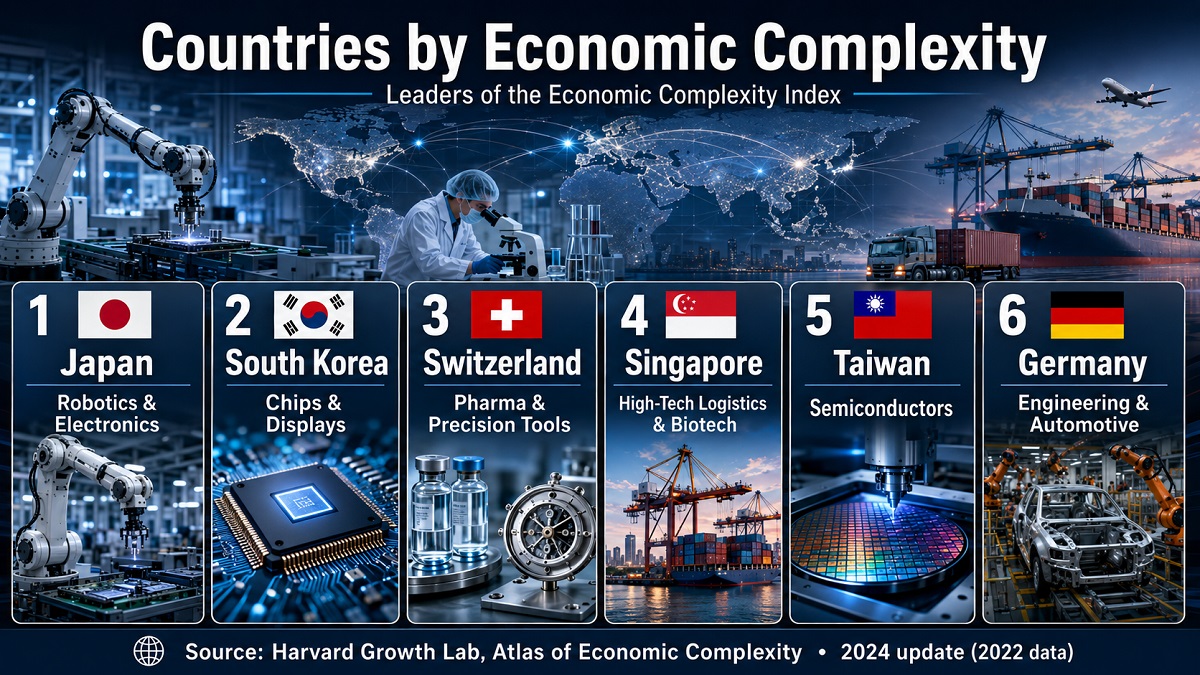
Economy · Productive know-how · 2026 snapshot Top 100 Countries and Economies by Economic Complexity: 2026 Snapshot Based on 2023
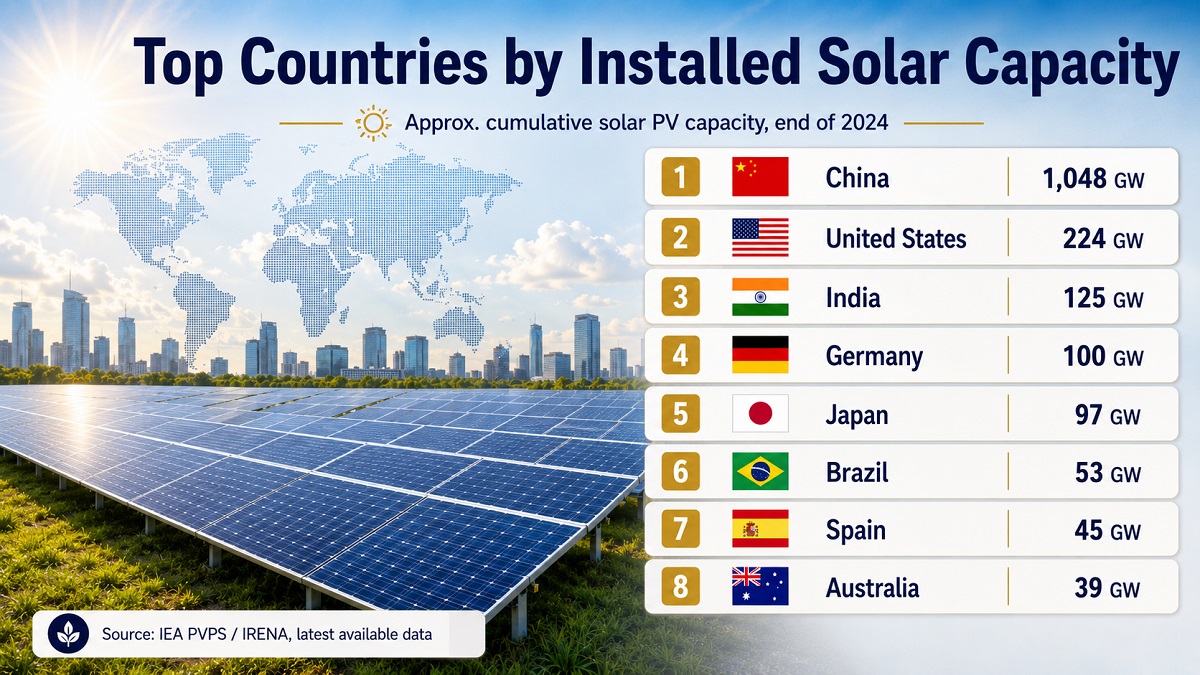
Renewable energy · installed solar capacity · 2026 snapshot Countries and Territories by Installed Solar Capacity: 2026 Snapshot Based on
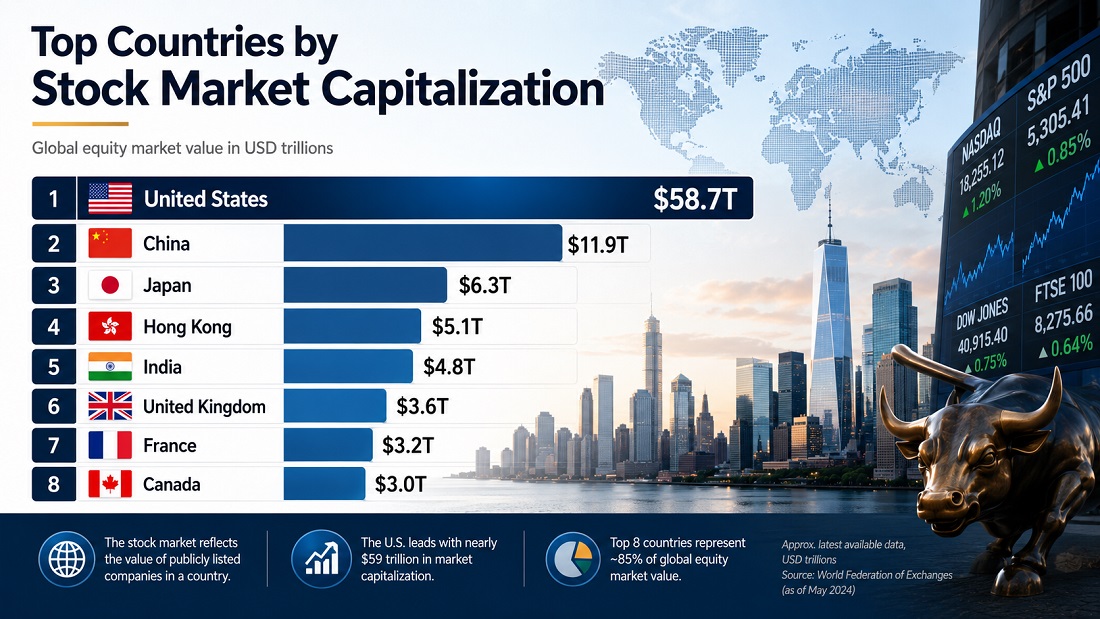
Economy · Investments · 2026 snapshot Countries by Stock Market Capitalization as a Share of GDP This 2026 snapshot ranks

Higher education finance · 2026 snapshot · official values Top 100 U.S. Universities and Related Foundations by Endowment Size, 2026
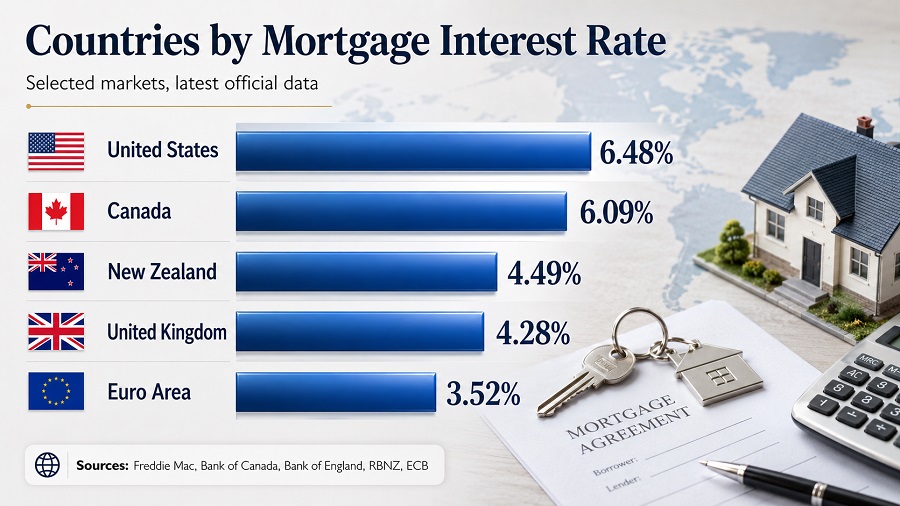
Housing finance · official-source rows · 2026 snapshot Countries by Mortgage Interest Rate, 2026 This ranking compares confirmed country entries
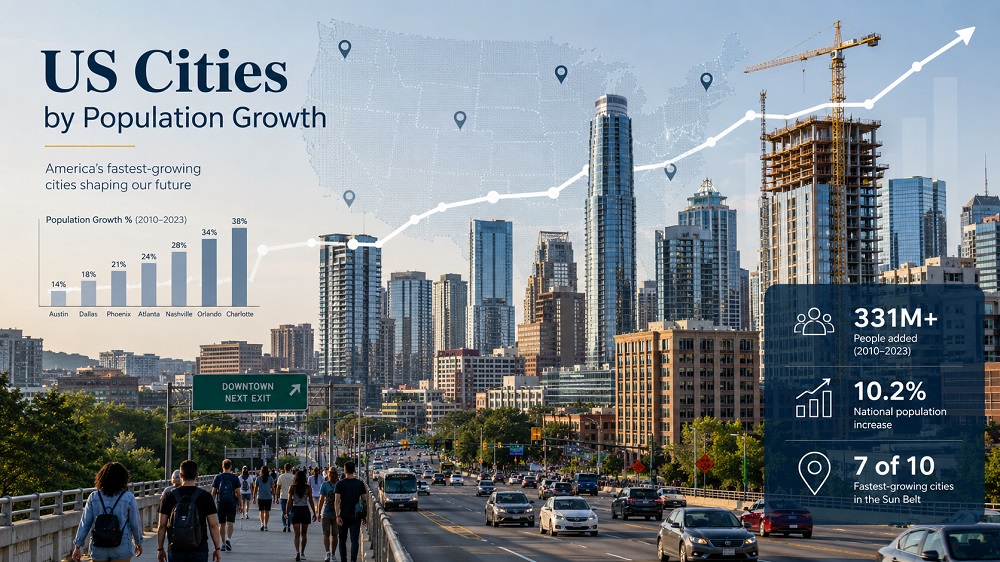
U.S. cities · Census Vintage 2025 · 2026 snapshot U.S. Cities by Population Growth, 2026 This ranking measures one-year population
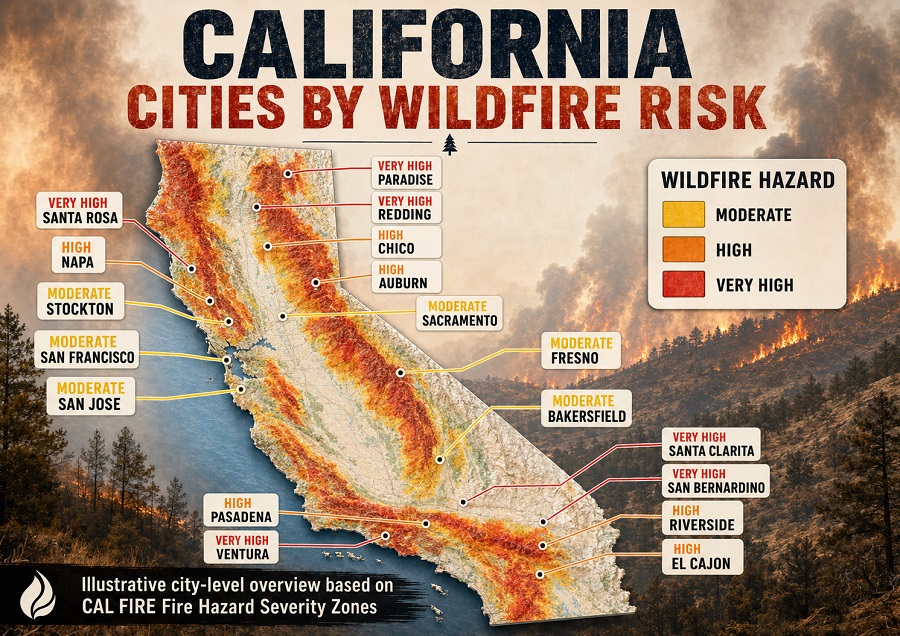
Wildfire risk · California communities · official hazard-map context California communities with the highest modeled wildfire risk to homes This
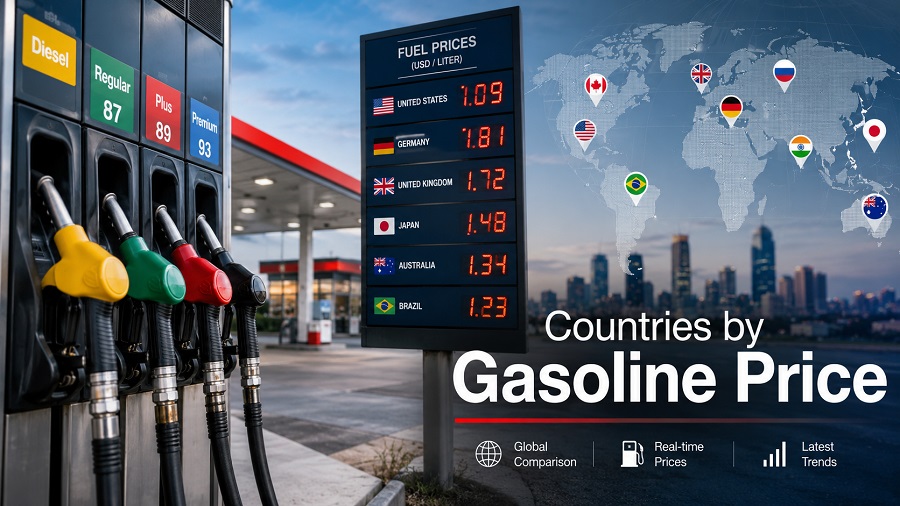
Where gasoline costs the most in 2026 Drivers in Hong Kong paid 4.156 U.S. dollars per liter for gasoline on

Housing affordability ranking Home Price-to-Income Ratio by State: 2026 Affordability Ranking This ranking of US states by home price-to-income ratio
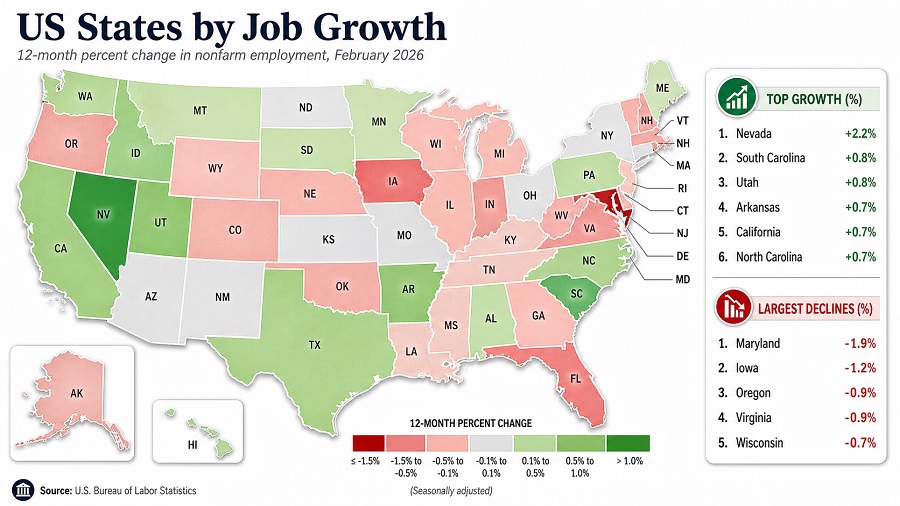
February 2026 Payroll Growth Ranking Across All 50 States US states by job growth · February 2026 BLS data US
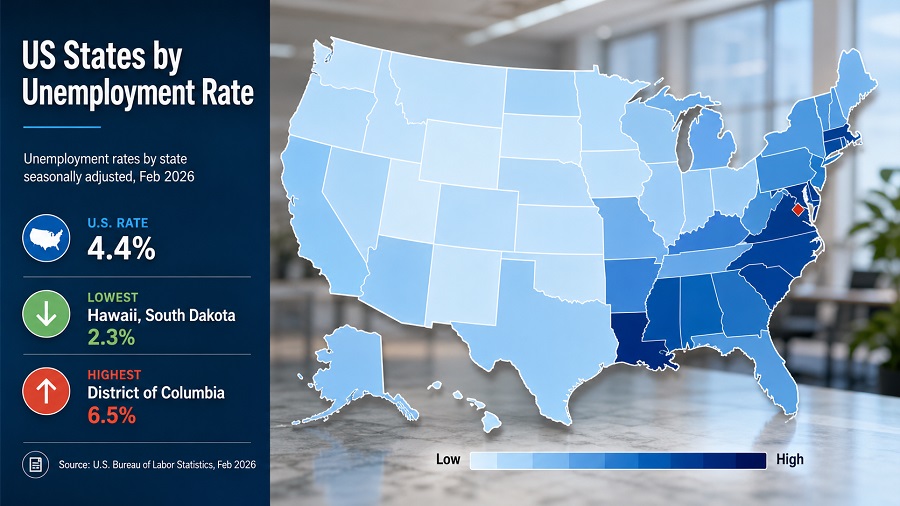
US states by unemployment rate · February 2026 BLS data 50 States and D.C. Ranked by February 2026 Unemployment The
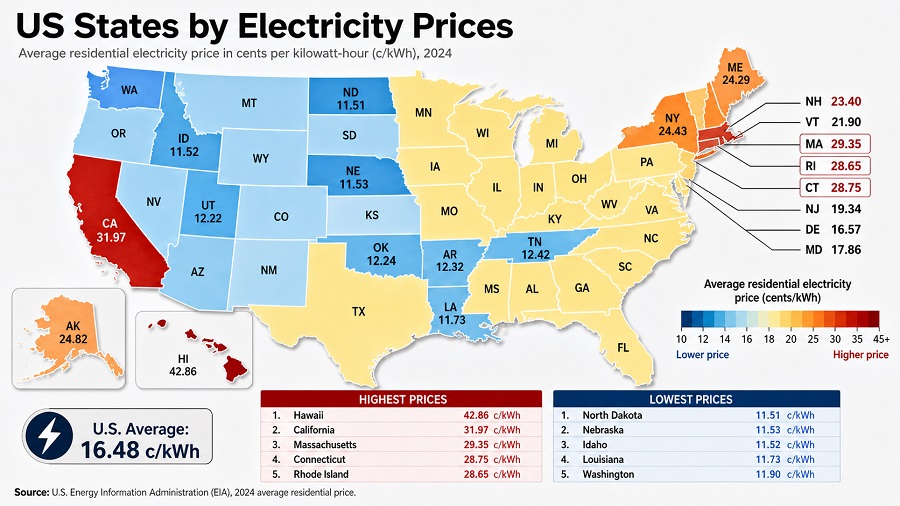
Electricity prices · U.S. states and D.C. · EIA monthly data Electricity Prices by State and D.C. in the Latest
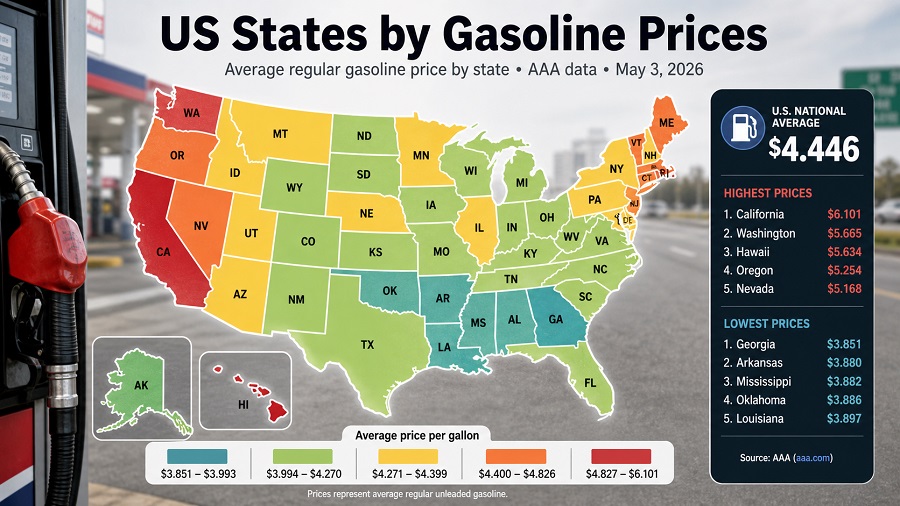
Economy · Inflation and prices · Motor fuel U.S. State Gasoline Prices in the AAA Daily Snapshot Information updated: May
