

US States by Unemployment Rate, 2026
US states by unemployment rate · February 2026 BLS data
50 States and D.C. Ranked by February 2026 Unemployment
The unemployment rate measures the share of the labor force that is without a job, available for work and actively looking for work. For state comparisons, it is one of the clearest high-frequency indicators of labor market stress, hiring conditions and regional economic resilience.
This US states by unemployment rate 2026 ranking uses the latest available official BLS LAUS state data as of May 5, 2026: February 2026 preliminary, seasonally adjusted estimates. It is a 2026 snapshot, not a full-year 2026 average and not a forecast. The table covers all 50 states plus the District of Columbia, which BLS reports alongside states in the state unemployment release.
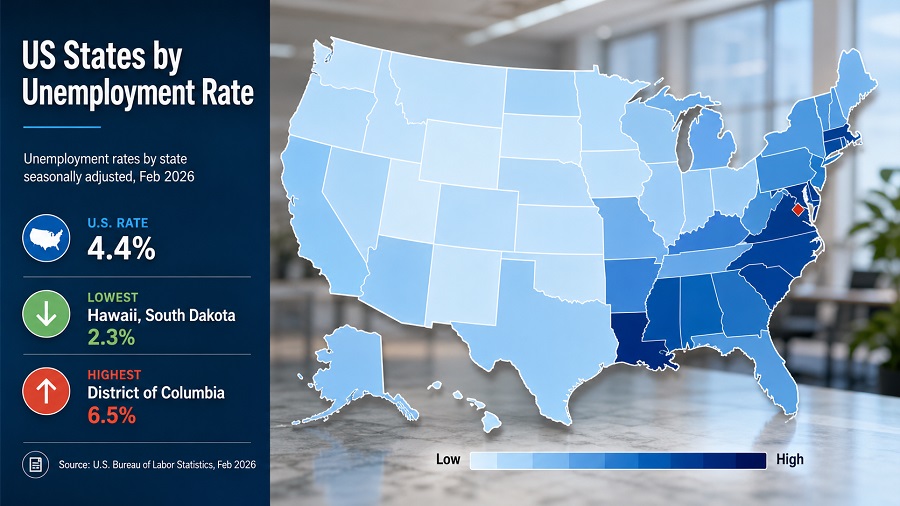
The ranking is sorted from the highest unemployment rate to the lowest. The District of Columbia has the highest state-level rate in this release at 6.5%. Among the 50 states, California and Delaware are highest at 5.4% each, while Hawaii and South Dakota are lowest at 2.3% each.
Using February 2026 BLS preliminary seasonally adjusted data, the highest unemployment rates were in the District of Columbia at 6.5%, California at 5.4%, Delaware at 5.4%, Nevada at 5.3% and Oregon at 5.2%. The lowest rates were in Hawaii and South Dakota at 2.3% each.
US states by unemployment rate 2026: key figures
Official preliminary BLS LAUS estimates, seasonally adjusted. The latest month is subject to revision in the next release.
50 states plus the District of Columbia. Puerto Rico is not included because this ranking focuses on state-level U.S. comparisons.
The rate is calculated as unemployed people divided by the civilian labor force, expressed as a percentage.
The U.S. unemployment rate for February 2026 was 4.4%, which provides the benchmark for interpreting state-level differences.
US states by unemployment rate 2026: what the top of the ranking shows
The upper end of the February 2026 ranking is not concentrated in one region only. The Top 20 highest unemployment rates include Western states such as California, Nevada, Oregon, Washington, Alaska, New Mexico and Arizona; Northeastern states such as New Jersey, Massachusetts, Connecticut, New York and Rhode Island; several Southern jurisdictions including the District of Columbia, Delaware, South Carolina, West Virginia and Florida; and three Midwestern states: Illinois, Michigan and Minnesota.
This distribution matters because the unemployment rate is not just a count of jobless people. It is scaled by each state’s labor force. California has the largest number of unemployed people in the table, but its 5.4% rate is the same as Delaware’s much smaller labor market rate. The rate therefore highlights labor-market intensity, while the unemployed count shows scale.
The bottom of the ranking is also analytically important. Hawaii and South Dakota recorded 2.3%, followed by North Dakota and Vermont at 2.6% and Alabama at 2.7%. Low unemployment can signal strong labor demand, but it can also coexist with slower labor-force growth, aging populations or industry-specific shortages.
Highest unemployment rates by state in 2026: Top 20
The Top 20 ranks the jurisdictions with the highest seasonally adjusted unemployment rates. Year-over-year change is shown in percentage points versus February 2025, using the same BLS Table 1 release.
| Rank | State or D.C. | Feb. 2026 rate | YoY change |
|---|---|---|---|
| 1 | District of Columbia | 6.5% | +0.6 pp |
| 2 | California | 5.4% | 0.0 pp |
| 3 | Delaware | 5.4% | +1.1 pp |
| 4 | Nevada | 5.3% | −0.1 pp |
| 5 | Oregon | 5.2% | +0.3 pp |
| 6 | New Jersey | 5.1% | +0.1 pp |
| 7 | Washington | 5.1% | +0.7 pp |
| 8 | Illinois | 5.0% | +0.3 pp |
| 9 | Michigan | 5.0% | −0.3 pp |
| 10 | South Carolina | 5.0% | +0.9 pp |
| 11 | Massachusetts | 4.8% | +0.5 pp |
| 12 | Alaska | 4.7% | +0.1 pp |
| 13 | Connecticut | 4.7% | +1.0 pp |
| 14 | New Mexico | 4.7% | +0.6 pp |
| 15 | West Virginia | 4.7% | +0.9 pp |
| 16 | Arizona | 4.6% | +0.4 pp |
| 17 | Florida | 4.6% | +1.0 pp |
| 18 | New York | 4.6% | +0.5 pp |
| 19 | Rhode Island | 4.6% | +0.1 pp |
| 20 | Minnesota | 4.5% | +1.0 pp |
The table ranks jurisdictions from the highest unemployment rate to the lowest; ties are ordered alphabetically. Values are preliminary BLS LAUS seasonally adjusted estimates for February 2026.
US state unemployment rate chart: Top 20 in 2026
Bar length is scaled to the highest value in the snapshot, 6.5% for the District of Columbia. The chart highlights how far the highest-rate jurisdictions sit above the national unemployment rate of 4.4%.
The chart shows the 20 highest state-level unemployment rates in February 2026.
Methodology: how the 2026 state unemployment ranking is calculated
The unemployment rate is calculated as the number of unemployed people divided by the civilian labor force. A person is counted as unemployed when they are without a job, available for work and actively seeking employment according to labor-force survey concepts. The rate is expressed as a percentage of the labor force, not as a percentage of the total population.
The ranking uses the BLS Local Area Unemployment Statistics state release for February 2026, seasonally adjusted. The figures are official preliminary estimates, not final annual values. They are used here because they were the latest available state-level 2026 data on May 5, 2026. The March 2026 state release was scheduled for May 6, 2026, so describing these figures as a full-year 2026 average would be inaccurate.
The ranking includes all 50 states plus the District of Columbia because BLS reports D.C. alongside states in the state unemployment release. Puerto Rico appears in the BLS state employment and unemployment release, but it is excluded here because the ranking focuses on the 50 states and the District of Columbia. Jurisdictions are sorted from the highest unemployment rate to the lowest; ties are ordered alphabetically. The table also includes the number of unemployed people as a context metric, but the ranking itself is based on the unemployment rate.
Values are rounded to one decimal place for unemployment rates and to whole persons for unemployed counts, matching the presentation of the BLS release. Because the latest month is preliminary and subject to revision, readers should treat the ranking as a current labor-market snapshot rather than a permanent ordering of state labor conditions.
US states by unemployment rate 2026: full table
Use the controls to search the 2026 state unemployment ranking, filter by Census region, switch between the unemployment rate and unemployed count, or change the sorting.
| Rank | State or D.C. | Rate / unemployed | Region |
|---|---|---|---|
| 1 | District of Columbia | 6.5%26,558 unemployedFeb. 2026 preliminary | South |
| 2 | California | 5.4%1,070,346 unemployedFeb. 2026 preliminary | West |
| 3 | Delaware | 5.4%27,943 unemployedFeb. 2026 preliminary | South |
| 4 | Nevada | 5.3%90,149 unemployedFeb. 2026 preliminary | West |
| 5 | Oregon | 5.2%115,677 unemployedFeb. 2026 preliminary | West |
| 6 | New Jersey | 5.1%248,797 unemployedFeb. 2026 preliminary | Northeast |
| 7 | Washington | 5.1%208,148 unemployedFeb. 2026 preliminary | West |
| 8 | Illinois | 5.0%328,415 unemployedFeb. 2026 preliminary | Midwest |
| 9 | Michigan | 5.0%251,357 unemployedFeb. 2026 preliminary | Midwest |
| 10 | South Carolina | 5.0%133,363 unemployedFeb. 2026 preliminary | South |
| 11 | Massachusetts | 4.8%186,138 unemployedFeb. 2026 preliminary | Northeast |
| 12 | Alaska | 4.7%17,513 unemployedFeb. 2026 preliminary | West |
| 13 | Connecticut | 4.7%90,545 unemployedFeb. 2026 preliminary | Northeast |
| 14 | New Mexico | 4.7%45,971 unemployedFeb. 2026 preliminary | West |
| 15 | West Virginia | 4.7%36,554 unemployedFeb. 2026 preliminary | South |
| 16 | Arizona | 4.6%174,529 unemployedFeb. 2026 preliminary | West |
| 17 | Florida | 4.6%515,916 unemployedFeb. 2026 preliminary | South |
| 18 | New York | 4.6%469,802 unemployedFeb. 2026 preliminary | Northeast |
| 19 | Rhode Island | 4.6%27,186 unemployedFeb. 2026 preliminary | Northeast |
| 20 | Minnesota | 4.5%142,008 unemployedFeb. 2026 preliminary | Midwest |
| 21 | Arkansas | 4.4%63,362 unemployedFeb. 2026 preliminary | South |
| 22 | Louisiana | 4.3%91,743 unemployedFeb. 2026 preliminary | South |
| 23 | Maryland | 4.3%139,102 unemployedFeb. 2026 preliminary | South |
| 24 | Texas | 4.3%685,050 unemployedFeb. 2026 preliminary | South |
| 25 | Kentucky | 4.2%88,829 unemployedFeb. 2026 preliminary | South |
| 26 | Ohio | 4.2%251,333 unemployedFeb. 2026 preliminary | Midwest |
| 27 | Pennsylvania | 4.2%279,587 unemployedFeb. 2026 preliminary | Northeast |
| 28 | Colorado | 3.9%127,272 unemployedFeb. 2026 preliminary | West |
| 29 | Kansas | 3.9%62,010 unemployedFeb. 2026 preliminary | Midwest |
| 30 | Missouri | 3.9%122,487 unemployedFeb. 2026 preliminary | Midwest |
| 31 | Oklahoma | 3.9%79,127 unemployedFeb. 2026 preliminary | South |
| 32 | North Carolina | 3.8%201,100 unemployedFeb. 2026 preliminary | South |
| 33 | Utah | 3.8%69,763 unemployedFeb. 2026 preliminary | West |
| 34 | Idaho | 3.7%36,950 unemployedFeb. 2026 preliminary | West |
| 35 | Mississippi | 3.7%47,972 unemployedFeb. 2026 preliminary | South |
| 36 | Virginia | 3.7%169,116 unemployedFeb. 2026 preliminary | South |
| 37 | Georgia | 3.6%194,230 unemployedFeb. 2026 preliminary | South |
| 38 | Montana | 3.6%21,067 unemployedFeb. 2026 preliminary | West |
| 39 | Tennessee | 3.6%127,572 unemployedFeb. 2026 preliminary | South |
| 40 | Wyoming | 3.6%10,413 unemployedFeb. 2026 preliminary | West |
| 41 | Iowa | 3.4%58,678 unemployedFeb. 2026 preliminary | Midwest |
| 42 | Wisconsin | 3.4%107,322 unemployedFeb. 2026 preliminary | Midwest |
| 43 | Indiana | 3.3%115,441 unemployedFeb. 2026 preliminary | Midwest |
| 44 | Maine | 3.2%22,961 unemployedFeb. 2026 preliminary | Northeast |
| 45 | New Hampshire | 3.2%24,951 unemployedFeb. 2026 preliminary | Northeast |
| 46 | Nebraska | 3.1%33,924 unemployedFeb. 2026 preliminary | Midwest |
| 47 | Alabama | 2.7%64,831 unemployedFeb. 2026 preliminary | South |
| 48 | North Dakota | 2.6%11,218 unemployedFeb. 2026 preliminary | Midwest |
| 49 | Vermont | 2.6%9,107 unemployedFeb. 2026 preliminary | Northeast |
| 50 | Hawaii | 2.3%15,660 unemployedFeb. 2026 preliminary | West |
| 51 | South Dakota | 2.3%11,145 unemployedFeb. 2026 preliminary | Midwest |
Source: U.S. Bureau of Labor Statistics, Local Area Unemployment Statistics, State Employment and Unemployment, February 2026 preliminary seasonally adjusted estimates. Rates are percent of the labor force and refer to place of residence. The latest month is subject to revision.
Insights from the 2026 state unemployment ranking
The highest-rate group is geographically mixed
The Top 20 includes states from every major Census region. This weakens any simple regional explanation and points instead to a mix of local industry structure, public-sector exposure, migration, labor-force growth and state-specific hiring momentum.
Large states dominate the unemployed count, not always the rate
California, Texas, Florida and New York account for very large numbers of unemployed people because their labor forces are large. But the unemployment rate adjusts for labor-force size, which is why smaller jurisdictions can rank near the top when a smaller labor market weakens.
The low-rate states should not be read as automatically stronger in every dimension
A low unemployment rate can reflect strong hiring, but it can also reflect a tight labor supply, slower population growth or fewer available workers. For wage pressure, business expansion and migration analysis, the unemployment rate should be read with labor-force participation, job openings and wage data.
What state unemployment rates mean for workers, employers and policy
For workers, a higher unemployment rate usually means more competition for open jobs and potentially slower wage growth in the short run. For employers, it can signal a deeper available labor pool, although skill mismatches may still be severe in sectors such as health care, construction, education, logistics or advanced manufacturing.
For policymakers, the state unemployment rate helps identify where job-search support, retraining, regional investment or sector-specific stabilization may be most urgent. It is also a fiscal signal: weaker labor markets can reduce income-tax receipts, raise demand for public support and change budget assumptions.
For analysts and investors, the ranking provides an early read on regional economic pressure. A state with rising unemployment may be experiencing softer household demand, public-sector cuts, industry rotation or slower hiring. A state with very low unemployment may face a different problem: labor shortages that constrain business expansion.
FAQ about US states by unemployment rate 2026
Which US state had the highest unemployment rate in 2026?
Among the 50 states, California and Delaware had the highest February 2026 unemployment rate at 5.4% each. Including the District of Columbia, D.C. ranked highest at 6.5%.
Which US states had the lowest unemployment rate in 2026?
Hawaii and South Dakota had the lowest February 2026 unemployment rate at 2.3% each, followed by North Dakota and Vermont at 2.6% and Alabama at 2.7%.
Is this the average unemployment rate for all of 2026?
No. This is a February 2026 snapshot based on the latest available official state-level BLS release as of May 5, 2026. It should not be described as a full-year 2026 average.
Why is the District of Columbia included?
BLS reports the District of Columbia alongside states in the state unemployment release. The main table therefore includes 50 states plus D.C., for 51 rows. The text distinguishes between D.C. and the 50 states where needed.
What does the unemployment rate measure?
The unemployment rate measures unemployed people as a share of the civilian labor force. It does not measure the share of the total population without a job, and it does not include people outside the labor force.
Why can a state have many unemployed people but a lower rate?
The unemployment rate is a ratio. It compares unemployed people with the labor force in the same state. A large state can have hundreds of thousands of unemployed people while still having a rate near the national average if its labor force is also very large.
Are preliminary BLS state unemployment rates revised?
Yes. BLS notes that estimates for the latest month are subject to revision in the following month. That is why this page labels the figures as preliminary and uses snapshot language.
Does a low unemployment rate always mean a better economy?
Not always. A low rate often reflects strong demand for labor, but it can also reflect tight labor supply or demographic constraints. It should be interpreted with labor-force participation, wage trends, job openings and industry employment data.
Sources and data notes for US state unemployment rates
-
U.S. Bureau of Labor Statistics — Unemployment Rates for States
Official state ranking table with seasonally adjusted February 2026 preliminary unemployment rates.
https://www.bls.gov/web/laus/laumstrk.htm -
U.S. Bureau of Labor Statistics — Table 1, Civilian labor force and unemployment by state
Source for state labor force, unemployed counts and unemployment rates used in the main table.
https://www.bls.gov/news.release/laus.t01.htm -
U.S. Bureau of Labor Statistics — State Employment and Unemployment Summary
Context for national comparison, monthly changes and release timing.
https://www.bls.gov/news.release/laus.nr0.htm -
BLS Local Area Unemployment Statistics program
Program background for monthly state, county, metropolitan and local labor-force estimates by place of residence.
https://www.bls.gov/lau/
StatRanker (Website)
administrator
