


US States by Homicide Rate: Latest FBI State Ranking
US States by Homicide Rate: 2026 Snapshot Based on 2024 FBI Data
Article updated: May 3, 2026 · Compiled by StatRanker using FBI UCR / Crime Data Explorer state-rate data.
Thank you for reading this post, don't forget to subscribe!The homicide rate ranks U.S. states by the number of reported murder and nonnegligent manslaughter offenses per 100,000 residents. Because full official state-level 2026 homicide data are not yet available, this 2026 snapshot uses the latest complete FBI state-rate table available for 2024. The ranking covers 50 states, excludes the District of Columbia from the main state table, and keeps the unit consistent across all rows.
Key figures from the 2026 snapshot
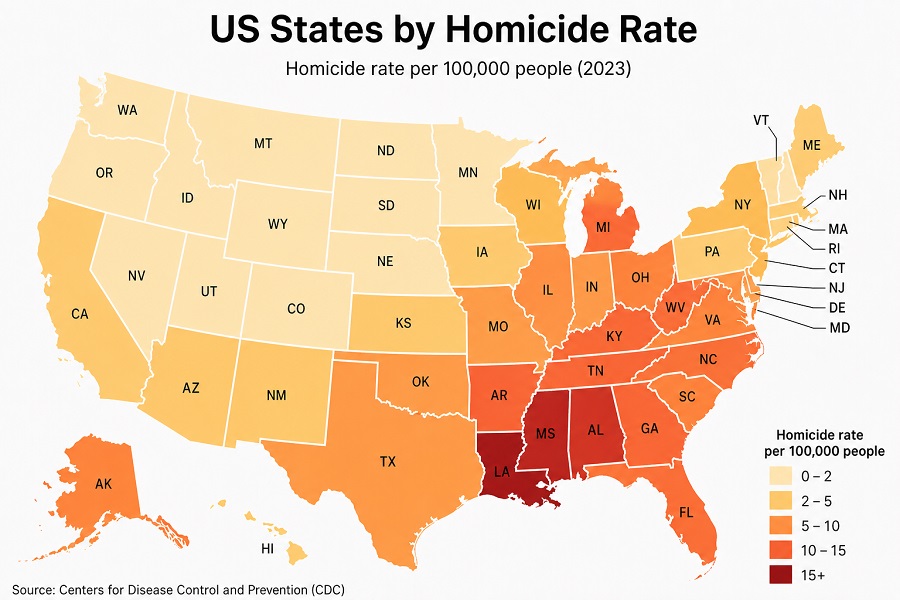
Louisiana ranks first among the 50 states in the latest FBI state-rate snapshot, more than twice the U.S. benchmark of 5.0 per 100,000.
New Hampshire records the lowest state homicide rate in the table, showing how wide the state-level spread remains even within one national legal system.
The main ranking includes states only. The District of Columbia has a much higher rate, but it is not a state and is excluded from the 50-state ranking.
A rate per 100,000 residents allows small and large states to be compared, but it does not show the absolute number of victims or local city-level concentration.
Overview: what the top of the homicide ranking shows
The upper end of the homicide-rate ranking is concentrated in the South, with Louisiana, Alabama, Tennessee, South Carolina, North Carolina, Mississippi, Arkansas and Maryland all appearing in the first ten. New Mexico is the leading non-Southern outlier, while Missouri represents the highest-ranked Midwestern state. State averages can be influenced by local concentrations of violence, firearm exposure, socioeconomic conditions, emergency response and reporting practices, so the ranking should be read as a comparative signal rather than a single-cause explanation.
A high state homicide rate does not mean every community in that state is equally dangerous. It means the state’s reported homicide burden, standardized by population, is higher than elsewhere. Conversely, a low state rate can still contain local hot spots. For readers, the useful interpretation is comparative: the rate shows where lethal violence is proportionally heavier, but local city, county and neighborhood data are needed before drawing conclusions about personal risk.
Top 10 states by homicide rate
The Top 10 is not a list of the largest homicide counts. It is a population-adjusted ranking. That distinction is important because a smaller state can rank high if the number of homicide offenses is large relative to its resident population.
| Rank | State | Region | Homicide rate per 100,000 |
|---|---|---|---|
| 1 | Louisiana | South | 10.8 |
| 2 | New Mexico | West | 10.5 |
| 3 | Alabama | South | 8.7 |
| 4 | Tennessee | South | 7.9 |
| 5 | Missouri | Midwest | 7.8 |
| 6 | North Carolina | South | 7.5 |
| 7 | South Carolina | South | 7.5 |
| 8 | Mississippi | South | 7.4 |
| 9 | Arkansas | South | 7.3 |
| 10 | Maryland | South | 7.2 |
Latest available FBI state-rate snapshot for 2024, used here as the 2026 reference edition. Values are rounded to one decimal place.
Chart: highest homicide rates by state
The chart uses the same Top 10 values as the table and makes the gap between the leading states easier to compare.
Methodology
The ranking uses the FBI homicide-rate field from the latest complete state-level 2024 crime table available through the Uniform Crime Reporting framework. In FBI UCR terminology, the field corresponds to murder and nonnegligent manslaughter. The rate is expressed as reported murder and nonnegligent manslaughter offenses per 100,000 residents, which standardizes reported offenses by population and makes states with different population sizes more comparable. The table is sorted from the highest homicide rate to the lowest; states with equal rounded rates are ordered alphabetically and kept as separate display ranks.
The 2026 label is treated as a latest-available-data edition, not as final 2026 data. Full-year state homicide data for 2026 are not complete at publication time, and crime data are revised as agencies submit, validate or correct records. For that reason, the article uses the latest complete official state-rate year rather than mixing partial monthly data with final annual state tables.
Homicide in this context follows the FBI UCR crime-reporting framework rather than public-health mortality records. That means it is based on law-enforcement reporting of offenses known to police, not death-certificate coding. The measure should therefore be interpreted as a reported-crime rate. It is excellent for comparing law-enforcement crime tables, but it is not identical to CDC homicide mortality rates, which are built from vital statistics.
Limitations: UCR participation is voluntary, reporting systems changed during the transition from SRS to NIBRS, and state averages can hide large city-level differences. Rates are rounded to one decimal place, so very small differences should not be overinterpreted.
Full ranking: 50 U.S. states by homicide rate
Use the controls to compare states by name, region, ranking group or rate order. The ranking itself remains based on the original homicide-rate order.
| Rank | State | Region | Homicide rate per 100,000 |
|---|---|---|---|
| 1 | Louisiana | South | 10.8 |
| 2 | New Mexico | West | 10.5 |
| 3 | Alabama | South | 8.7 |
| 4 | Tennessee | South | 7.9 |
| 5 | Missouri | Midwest | 7.8 |
| 6 | North Carolina | South | 7.5 |
| 7 | South Carolina | South | 7.5 |
| 8 | Mississippi | South | 7.4 |
| 9 | Arkansas | South | 7.3 |
| 10 | Maryland | South | 7.2 |
| 11 | Alaska | West | 6.9 |
| 12 | Georgia | South | 6.9 |
| 13 | Oklahoma | South | 6.3 |
| 14 | Kentucky | South | 6.1 |
| 15 | Nevada | West | 6.1 |
| 16 | Illinois | Midwest | 5.8 |
| 17 | Delaware | South | 5.7 |
| 18 | Indiana | Midwest | 5.5 |
| 19 | West Virginia | South | 5.3 |
| 20 | Michigan | Midwest | 5.2 |
| 21 | Texas | South | 5.2 |
| 22 | Ohio | Midwest | 5.0 |
| 23 | Pennsylvania | Northeast | 5.0 |
| 24 | Arizona | West | 4.9 |
| 25 | Virginia | South | 4.8 |
| 26 | South Dakota | Midwest | 4.7 |
| 27 | California | West | 4.5 |
| 28 | Colorado | West | 4.5 |
| 29 | Wisconsin | Midwest | 4.2 |
| 30 | Florida | South | 3.9 |
| 31 | Kansas | Midwest | 3.8 |
| 32 | Washington | West | 3.8 |
| 33 | Oregon | West | 3.7 |
| 34 | Vermont | Northeast | 3.4 |
| 35 | Minnesota | Midwest | 2.9 |
| 36 | Montana | West | 2.7 |
| 37 | New York | Northeast | 2.7 |
| 38 | North Dakota | Midwest | 2.6 |
| 39 | Utah | West | 2.6 |
| 40 | Connecticut | Northeast | 2.5 |
| 41 | Wyoming | West | 2.4 |
| 42 | Maine | Northeast | 2.3 |
| 43 | New Jersey | Northeast | 2.3 |
| 44 | Iowa | Midwest | 2.1 |
| 45 | Nebraska | Midwest | 2.1 |
| 46 | Rhode Island | Northeast | 2.1 |
| 47 | Massachusetts | Northeast | 1.8 |
| 48 | Hawaii | West | 1.6 |
| 49 | Idaho | West | 1.6 |
| 50 | New Hampshire | Northeast | 1.0 |
FBI 2024 state homicide rates, shown as the latest-available 2026 snapshot. Unit: reported murder and nonnegligent manslaughter offenses per 100,000 residents. Coverage: 50 states. Values rounded to one decimal place.
Insights from the state homicide ranking
The most important pattern is the concentration of high homicide rates in the South. This does not point to a single cause; homicide is usually shaped by several interacting conditions, including firearm exposure, localized retaliatory violence, socioeconomic conditions, domestic violence, law-enforcement clearance patterns and emergency medical response after shootings. State averages compress those conditions into one number, so they are best used as a starting point for deeper local analysis.
The middle of the table is more mixed. States such as Michigan, Texas, Ohio, Pennsylvania, Arizona and Virginia sit near the national benchmark, but their internal geography is very different. A state with one large high-violence metro can rank similarly to a state with broader, lower-level violence spread across smaller cities. The rate alone cannot reveal that structure.
The lower end of the ranking is dominated by New England and several lower-density Western or Midwestern states. New Hampshire, Idaho, Hawaii, Massachusetts, Rhode Island, Nebraska, Iowa, Maine and New Jersey all fall well below the national benchmark. Lower rates may reflect different combinations of demographics, settlement patterns, firearm exposure, policing practices, health systems and social conditions.
What this means for readers
For residents, the homicide rate is a signal of the state-level burden of lethal violence, not a personal safety forecast. A person’s practical risk depends far more on city, neighborhood, age, social network, domestic situation and daily routine than on the statewide average. For local decisions, pair the state rate with city-level FBI Crime Data Explorer data, local police dashboards, county health data and neighborhood-level context.
For policymakers and analysts, the rate is useful because it standardizes by population and makes year-to-year or state-to-state comparisons possible. The best use is not to label a state as safe or unsafe, but to ask why similar states diverge and which interventions reduce homicide without simply shifting violence across jurisdictions.
For researchers and readers comparing crime claims, the main rule is to separate rates from counts. California and Texas can have large numbers of homicide offenses because they are very populous, while smaller states can rank higher by rate if the burden is larger relative to population.
FAQ
Is this a real 2026 homicide ranking?
No. It is a 2026 reference edition based on the latest complete FBI state-rate data available for 2024. The title keeps the current edition year, while the intro, methodology and table note clearly state the actual data year.
Why use a rate per 100,000 residents instead of the number of homicides?
Counts are strongly affected by population size. A rate per 100,000 residents allows a smaller state and a larger state to be compared on the same scale. Counts are still important for workload and victim impact, but rates are better for ranking proportional burden.
Does a high state rate mean the whole state is dangerous?
No. Homicide is usually concentrated in specific cities, counties, neighborhoods or social networks. A state rate is a broad benchmark. It should not be used as a direct substitute for local risk analysis.
Why is the District of Columbia not in the main ranking?
The requested ranking is for U.S. states. The District of Columbia is often included in FBI tables and has a high homicide rate, but it is not one of the 50 states. Excluding it keeps the state ranking consistent.
Are FBI homicide rates the same as CDC homicide death rates?
No. FBI UCR data are law-enforcement crime statistics based on reported offenses. CDC homicide mortality data are public-health records based on death certificates. They usually track related realities, but definitions, timing and classification rules differ.
Sources
The ranking is based on official U.S. crime data sources and supporting population methodology sources. These sources document the FBI definitions, state-rate data and population context used for the ranking.
- FBI Crime Data Explorer. Main access point for FBI UCR data, state tables, downloads and latest releases, including the 2024 state-rate data used for this ranking. https://cde.ucr.cjis.gov/
- FBI Crime Data Explorer — Crime in the United States, 2024 state tables. State-by-state offense and rate data used as the direct basis for the homicide-rate ranking. https://cde.ucr.cjis.gov/LATEST/webapp/#/pages/explorer/crime/crime-trend
- FBI Uniform Crime Reporting Program. Explains UCR collection, law-enforcement submissions and publication through Crime Data Explorer. https://www.fbi.gov/how-we-can-help-you/more-fbi-services-and-information/ucr
- FBI UCR offense-definition reference. Provides the definition basis for murder and nonnegligent manslaughter and related Part I offenses. https://ucr.fbi.gov/crime-in-the-u.s/2017/crime-in-the-u.s.-2017/topic-pages/offense-definitions
- U.S. Census Bureau Population Estimates. Population-estimate series used in public statistical work where rates per resident population are required. https://www.census.gov/data/tables/time-series/demo/popest/2020s-state-total.html
StatRanker (Website)
administrator
