

Top 100 Countries by Integrated Circuit Exports in 2024
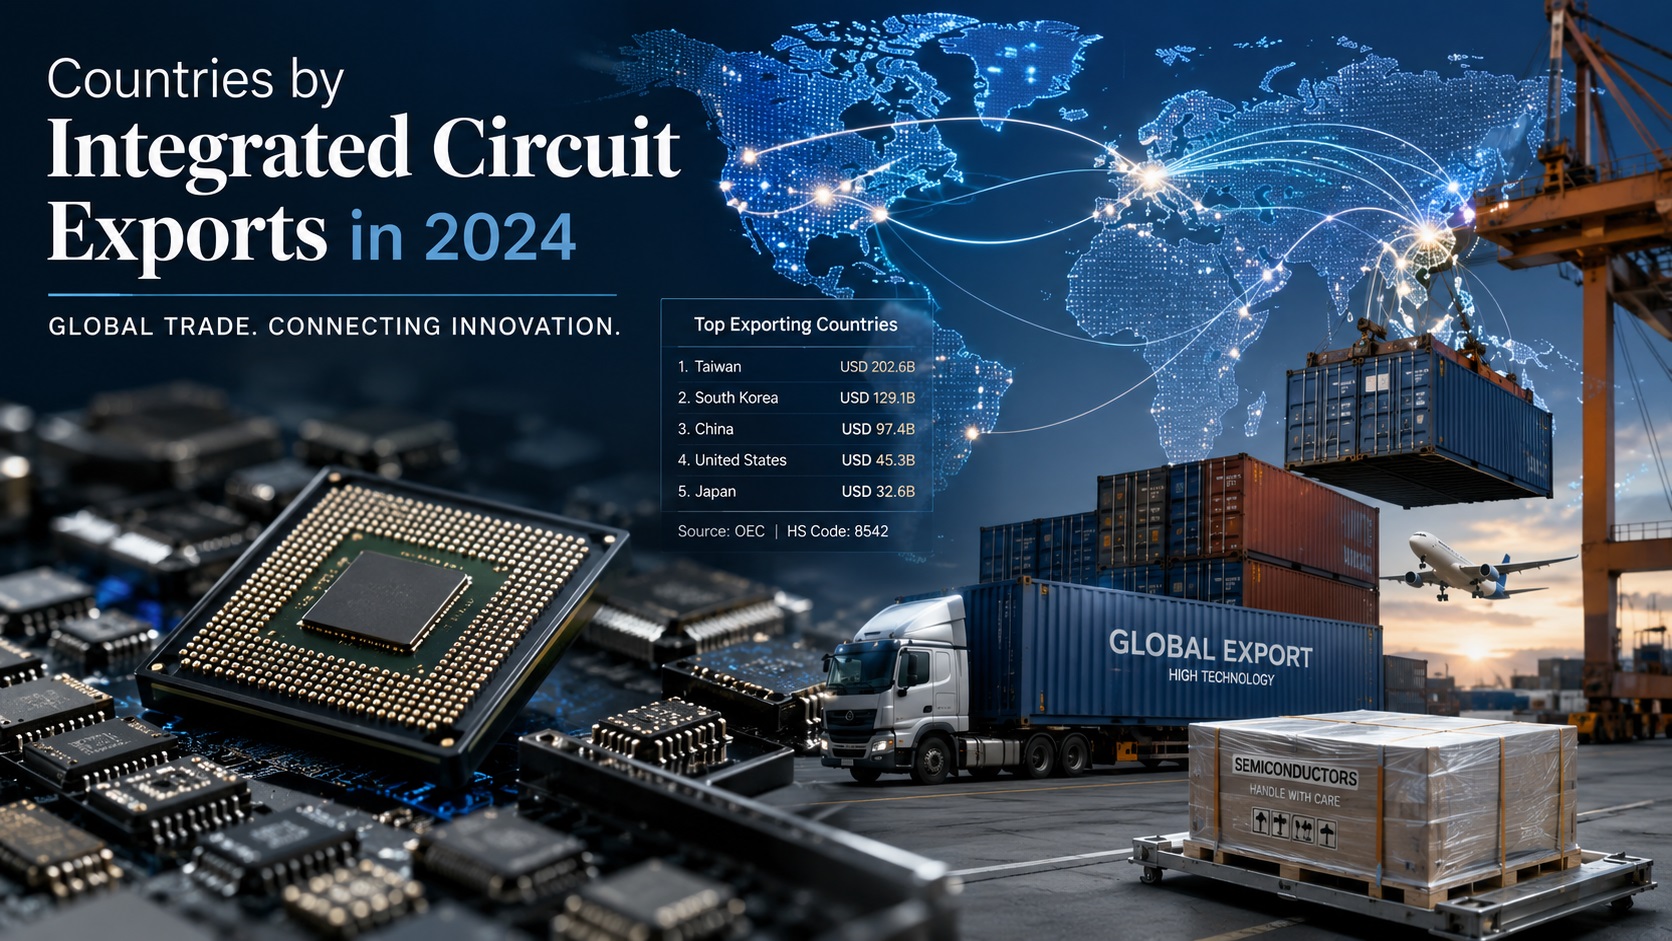
Global Leaders in Integrated Circuit Exports: 2024 WITS Snapshot
This ranking measures exports of electronic integrated circuits and microassemblies under HS code 8542. The metric is gross export value in current U.S. dollars, converted from WITS trade value in 1000 USD to US$ million. Higher values rank higher.
The table is a single-source official-value dataset based on World Bank WITS / UN COMTRADE H0 data for 2024. It covers 100 confirmed country and economy rows; the European Union aggregate shown in WITS is excluded to avoid double-counting EU member states.
This is an integrated circuit exports by country ranking, not a semiconductor production ranking. Trade hubs such as Hong Kong and Singapore can rank very high because chips often move through regional logistics, testing, packaging and re-export channels before reaching final manufacturers.
Continue exploring
More StatRanker rankings on trade flows, exports, imports and economic scale.
US$220,237.87 million in HS 8542 exports; official WITS / UN COMTRADE value for 2024.
US$0.16 million in HS 8542 exports; official WITS / UN COMTRADE value for 2024.
Countries and economies with confirmed 2024 export values; regional aggregates and blank-value rows are excluded.
Current U.S. dollars, converted from WITS values reported in 1000 USD; public-source snapshot accessed June 14, 2026.
100 official values; 0 official forecasts; 0 modeled projections.
Overview
Countries by semiconductor exports are not always the same as countries by chip fabrication capacity. HS 8542 captures exported integrated circuits and microassemblies, so it reflects production, assembly, testing, logistics, re-export flows and global electronics routing.
The first six rows are Hong Kong, Other Asia, nes, China, Korea, Singapore and Malaysia, all deeply linked to Asian electronics supply chains. The United States, Japan and Germany are the largest advanced-industrial exporters near the top of the table, while the lower half shows how quickly export value falls outside the main semiconductor trade hubs.
Other Asia, nes is the WITS reporter label commonly used for Taiwan in this dataset. That label is retained because the table follows source naming rather than replacing official reporter labels with editorial alternatives.
Top 10 exporters of integrated circuits
The Top 10 is dominated by Asian production and logistics economies. The United States and Germany are the only non-Asian entries in the first ten rows, while Japan remains a major exporter through high-value electronics and component supply chains.
| Rank | Entity | Value | Region / Note |
|---|---|---|---|
| 1 | Hong Kong, China | US$220,237.87 mn | Asia; official_value; WITS / UN COMTRADE H0; 2024; HS 8542 exports to World. |
| 2 | Other Asia, nes | US$165,015.68 mn | Asia; official_value; WITS / UN COMTRADE H0; 2024; WITS reporting label commonly used for Taiwan. |
| 3 | China | US$161,590.48 mn | Asia; official_value; WITS / UN COMTRADE H0; 2024; HS 8542 exports to World. |
| 4 | Korea, Rep. | US$120,311.39 mn | Asia; official_value; WITS / UN COMTRADE H0; 2024; HS 8542 exports to World. |
| 5 | Singapore | US$119,229.59 mn | Asia; official_value; WITS / UN COMTRADE H0; 2024; major trade, testing and logistics hub. |
| 6 | Malaysia | US$76,853.17 mn | Asia; official_value; WITS / UN COMTRADE H0; 2024; strong assembly, testing and electronics role. |
| 7 | United States | US$51,242.87 mn | North America; official_value; WITS / UN COMTRADE H0; 2024; HS 8542 exports to World. |
| 8 | Japan | US$32,514.85 mn | Asia; official_value; WITS / UN COMTRADE H0; 2024; HS 8542 exports to World. |
| 9 | Philippines | US$22,625.78 mn | Asia; official_value; WITS / UN COMTRADE H0; 2024; electronics export platform. |
| 10 | Germany | US$18,648.56 mn | Europe; official_value; WITS / UN COMTRADE H0; 2024; largest European country row in this table. |
Source: World Bank WITS / UN COMTRADE H0, HS 8542, exports to World, 2024. Values are converted from 1000 USD to US$ million and rounded to two decimals. Snapshot accessed June 14, 2026.
Chart: Top 20 integrated circuit exporters
The chart uses the same confirmed table values and compares the Top 20 exporters on a horizontal scale. The sharp drop after the first six rows shows how concentrated HS 8542 semiconductor trade is in a small number of economies.
Methodology
The metric is export value for HS 8542, “Electronic integrated circuits and microassemblies.” WITS reports trade value in 1000 USD; this page divides the source value by 1,000 to show US$ million. Ranking direction is descending: a larger export value ranks higher.
The target year is 2024 because it was the latest complete year available in the public WITS table used for this snapshot. All rows are official_value rows from WITS / UN COMTRADE H0. No forecasts, modeled projections, CAGR estimates or averaged values are used.
Source hierarchy
Single-source official dataset: World Bank WITS using UN COMTRADE H0 nomenclature. WITS partner is World and trade flow is Exports.
Extraction path
WITS Advanced Query / Raw Trade Data; nomenclature H0; product HS 8542; reporters all available countries and economies; partner World; flow Exports; year 2024.
Inclusion and exclusion
Country and economy rows with non-blank 2024 values are included. The European Union aggregate is excluded because it overlaps with EU member-state rows.
Rounding
Rows are ranked by unrounded source values. Displayed values are rounded to two decimals in US$ million; chart labels use US$ billion for readability.
Audit path: each row was included only when the WITS table showed a non-blank 2024 reporter value for HS 8542 exports to World. Aggregates and blank-value rows were excluded before sorting. The fixed rank was calculated from the unrounded numeric export value in descending order.
HS 8542 is a narrow trade proxy for integrated circuits. It does not include every semiconductor-related product. HS 8541 covers diodes, transistors and similar semiconductor devices, including some photovoltaic and LED-related goods. This ranking uses HS 8542 only because it gives a clear product boundary for chip exports by country.
Scope note: this ranking compares country and economy export values, not company revenue, wafer capacity, fabrication nodes or domestic semiconductor value added.
Main ranking table: Top 100 by HS 8542 export value
Use the controls to compare countries by region, status and export value while keeping the fixed 2024 rank visible.
| Rank | Entity | Value | Source / Method note |
|---|---|---|---|
| 1 | Hong Kong, China | US$220,237.87 mn | Asia; official_value; WITS / UN COMTRADE H0; 2024; HS 8542 exports to World. |
| 2 | Other Asia, nes | US$165,015.68 mn | Asia; official_value; WITS / UN COMTRADE H0; 2024; WITS reporting label commonly used for Taiwan. |
| 3 | China | US$161,590.48 mn | Asia; official_value; WITS / UN COMTRADE H0; 2024; HS 8542 exports to World. |
| 4 | Korea, Rep. | US$120,311.39 mn | Asia; official_value; WITS / UN COMTRADE H0; 2024; HS 8542 exports to World. |
| 5 | Singapore | US$119,229.59 mn | Asia; official_value; WITS / UN COMTRADE H0; 2024; HS 8542 exports to World. |
| 6 | Malaysia | US$76,853.17 mn | Asia; official_value; WITS / UN COMTRADE H0; 2024; HS 8542 exports to World. |
| 7 | United States | US$51,242.87 mn | North America; official_value; WITS / UN COMTRADE H0; 2024; HS 8542 exports to World. |
| 8 | Japan | US$32,514.85 mn | Asia; official_value; WITS / UN COMTRADE H0; 2024; HS 8542 exports to World. |
| 9 | Philippines | US$22,625.78 mn | Asia; official_value; WITS / UN COMTRADE H0; 2024; HS 8542 exports to World. |
| 10 | Germany | US$18,648.56 mn | Europe; official_value; WITS / UN COMTRADE H0; 2024; HS 8542 exports to World. |
| 11 | Thailand | US$8,739.84 mn | Asia; official_value; WITS / UN COMTRADE H0; 2024; HS 8542 exports to World. |
| 12 | Ireland | US$8,290.84 mn | Europe; official_value; WITS / UN COMTRADE H0; 2024; HS 8542 exports to World. |
| 13 | France | US$6,579.79 mn | Europe; official_value; WITS / UN COMTRADE H0; 2024; HS 8542 exports to World. |
| 14 | Israel | US$5,751.56 mn | Asia; official_value; WITS / UN COMTRADE H0; 2024; HS 8542 exports to World. |
| 15 | Mexico | US$3,673.43 mn | North America; official_value; WITS / UN COMTRADE H0; 2024; HS 8542 exports to World. |
| 16 | Netherlands | US$3,199.52 mn | Europe; official_value; WITS / UN COMTRADE H0; 2024; HS 8542 exports to World. |
| 17 | Belgium | US$2,238.28 mn | Europe; official_value; WITS / UN COMTRADE H0; 2024; HS 8542 exports to World. |
| 18 | Italy | US$2,219.45 mn | Europe; official_value; WITS / UN COMTRADE H0; 2024; HS 8542 exports to World. |
| 19 | Czech Republic | US$1,781.04 mn | Europe; official_value; WITS / UN COMTRADE H0; 2024; HS 8542 exports to World. |
| 20 | United Kingdom | US$1,110.56 mn | Europe; official_value; WITS / UN COMTRADE H0; 2024; HS 8542 exports to World. |
| 21 | Austria | US$1,006.55 mn | Europe; official_value; WITS / UN COMTRADE H0; 2024; HS 8542 exports to World. |
| 22 | Switzerland | US$980.74 mn | Europe; official_value; WITS / UN COMTRADE H0; 2024; HS 8542 exports to World. |
| 23 | Malta | US$881.65 mn | Europe; official_value; WITS / UN COMTRADE H0; 2024; HS 8542 exports to World. |
| 24 | Indonesia | US$746.75 mn | Asia; official_value; WITS / UN COMTRADE H0; 2024; HS 8542 exports to World. |
| 25 | Canada | US$682.60 mn | North America; official_value; WITS / UN COMTRADE H0; 2024; HS 8542 exports to World. |
| 26 | Poland | US$657.30 mn | Europe; official_value; WITS / UN COMTRADE H0; 2024; HS 8542 exports to World. |
| 27 | Spain | US$617.89 mn | Europe; official_value; WITS / UN COMTRADE H0; 2024; HS 8542 exports to World. |
| 28 | Bulgaria | US$579.78 mn | Europe; official_value; WITS / UN COMTRADE H0; 2024; HS 8542 exports to World. |
| 29 | Portugal | US$562.90 mn | Europe; official_value; WITS / UN COMTRADE H0; 2024; HS 8542 exports to World. |
| 30 | Finland | US$459.90 mn | Europe; official_value; WITS / UN COMTRADE H0; 2024; HS 8542 exports to World. |
| 31 | Hungary | US$415.27 mn | Europe; official_value; WITS / UN COMTRADE H0; 2024; HS 8542 exports to World. |
| 32 | Morocco | US$392.04 mn | Africa; official_value; WITS / UN COMTRADE H0; 2024; HS 8542 exports to World. |
| 33 | India | US$360.57 mn | Asia; official_value; WITS / UN COMTRADE H0; 2024; HS 8542 exports to World. |
| 34 | Sweden | US$325.57 mn | Europe; official_value; WITS / UN COMTRADE H0; 2024; HS 8542 exports to World. |
| 35 | Romania | US$322.35 mn | Europe; official_value; WITS / UN COMTRADE H0; 2024; HS 8542 exports to World. |
| 36 | Slovak Republic | US$251.26 mn | Europe; official_value; WITS / UN COMTRADE H0; 2024; HS 8542 exports to World. |
| 37 | Denmark | US$245.43 mn | Europe; official_value; WITS / UN COMTRADE H0; 2024; HS 8542 exports to World. |
| 38 | Brazil | US$212.06 mn | South America; official_value; WITS / UN COMTRADE H0; 2024; HS 8542 exports to World. |
| 39 | Tunisia | US$141.81 mn | Africa; official_value; WITS / UN COMTRADE H0; 2024; HS 8542 exports to World. |
| 40 | Serbia, FR(Serbia/Montenegro) | US$126.85 mn | Europe; official_value; WITS / UN COMTRADE H0; 2024; source reporter name retained. |
| 41 | Australia | US$103.94 mn | Oceania; official_value; WITS / UN COMTRADE H0; 2024; HS 8542 exports to World. |
| 42 | Cambodia | US$93.22 mn | Asia; official_value; WITS / UN COMTRADE H0; 2024; HS 8542 exports to World. |
| 43 | Colombia | US$87.33 mn | South America; official_value; WITS / UN COMTRADE H0; 2024; HS 8542 exports to World. |
| 44 | Latvia | US$77.40 mn | Europe; official_value; WITS / UN COMTRADE H0; 2024; HS 8542 exports to World. |
| 45 | Norway | US$72.21 mn | Europe; official_value; WITS / UN COMTRADE H0; 2024; HS 8542 exports to World. |
| 46 | Turkey | US$69.02 mn | Europe/Asia; official_value; WITS / UN COMTRADE H0; 2024; HS 8542 exports to World. |
| 47 | Estonia | US$60.52 mn | Europe; official_value; WITS / UN COMTRADE H0; 2024; HS 8542 exports to World. |
| 48 | Costa Rica | US$59.27 mn | Central America; official_value; WITS / UN COMTRADE H0; 2024; HS 8542 exports to World. |
| 49 | Greece | US$54.57 mn | Europe; official_value; WITS / UN COMTRADE H0; 2024; HS 8542 exports to World. |
| 50 | Slovenia | US$48.68 mn | Europe; official_value; WITS / UN COMTRADE H0; 2024; HS 8542 exports to World. |
| 51 | Lithuania | US$47.63 mn | Europe; official_value; WITS / UN COMTRADE H0; 2024; HS 8542 exports to World. |
| 52 | Ukraine | US$44.06 mn | Europe; official_value; WITS / UN COMTRADE H0; 2024; HS 8542 exports to World. |
| 53 | South Africa | US$36.73 mn | Africa; official_value; WITS / UN COMTRADE H0; 2024; HS 8542 exports to World. |
| 54 | Saudi Arabia | US$24.12 mn | Asia; official_value; WITS / UN COMTRADE H0; 2024; HS 8542 exports to World. |
| 55 | Egypt, Arab Rep. | US$16.74 mn | Africa; official_value; WITS / UN COMTRADE H0; 2024; HS 8542 exports to World. |
| 56 | Sri Lanka | US$10.98 mn | Asia; official_value; WITS / UN COMTRADE H0; 2024; HS 8542 exports to World. |
| 57 | Croatia | US$10.74 mn | Europe; official_value; WITS / UN COMTRADE H0; 2024; HS 8542 exports to World. |
| 58 | New Zealand | US$9.42 mn | Oceania; official_value; WITS / UN COMTRADE H0; 2024; HS 8542 exports to World. |
| 59 | Honduras | US$8.93 mn | Central America; official_value; WITS / UN COMTRADE H0; 2024; HS 8542 exports to World. |
| 60 | Bosnia and Herzegovina | US$5.86 mn | Europe; official_value; WITS / UN COMTRADE H0; 2024; HS 8542 exports to World. |
| 61 | Qatar | US$5.46 mn | Asia; official_value; WITS / UN COMTRADE H0; 2024; HS 8542 exports to World. |
| 62 | Macao | US$5.37 mn | Asia; official_value; WITS / UN COMTRADE H0; 2024; HS 8542 exports to World. |
| 63 | Luxembourg | US$5.06 mn | Europe; official_value; WITS / UN COMTRADE H0; 2024; HS 8542 exports to World. |
| 64 | Chile | US$4.89 mn | South America; official_value; WITS / UN COMTRADE H0; 2024; HS 8542 exports to World. |
| 65 | Kazakhstan | US$4.08 mn | Asia; official_value; WITS / UN COMTRADE H0; 2024; HS 8542 exports to World. |
| 66 | Jordan | US$3.93 mn | Asia; official_value; WITS / UN COMTRADE H0; 2024; HS 8542 exports to World. |
| 67 | Lebanon | US$3.75 mn | Asia; official_value; WITS / UN COMTRADE H0; 2024; HS 8542 exports to World. |
| 68 | Dominican Republic | US$3.51 mn | Caribbean; official_value; WITS / UN COMTRADE H0; 2024; HS 8542 exports to World. |
| 69 | Peru | US$2.75 mn | South America; official_value; WITS / UN COMTRADE H0; 2024; HS 8542 exports to World. |
| 70 | Guatemala | US$2.55 mn | Central America; official_value; WITS / UN COMTRADE H0; 2024; HS 8542 exports to World. |
| 71 | Armenia | US$2.54 mn | Asia; official_value; WITS / UN COMTRADE H0; 2024; HS 8542 exports to World. |
| 72 | North Macedonia | US$2.30 mn | Europe; official_value; WITS / UN COMTRADE H0; 2024; HS 8542 exports to World. |
| 73 | Kyrgyz Republic | US$2.13 mn | Asia; official_value; WITS / UN COMTRADE H0; 2024; HS 8542 exports to World. |
| 74 | Ecuador | US$2.04 mn | South America; official_value; WITS / UN COMTRADE H0; 2024; HS 8542 exports to World. |
| 75 | Oman | US$2.00 mn | Asia; official_value; WITS / UN COMTRADE H0; 2024; HS 8542 exports to World. |
| 76 | Uruguay | US$1.82 mn | South America; official_value; WITS / UN COMTRADE H0; 2024; HS 8542 exports to World. |
| 77 | Bahrain | US$1.81 mn | Asia; official_value; WITS / UN COMTRADE H0; 2024; HS 8542 exports to World. |
| 78 | Nicaragua | US$1.42 mn | Central America; official_value; WITS / UN COMTRADE H0; 2024; HS 8542 exports to World. |
| 79 | Azerbaijan | US$1.10 mn | Asia; official_value; WITS / UN COMTRADE H0; 2024; HS 8542 exports to World. |
| 80 | Cote d'Ivoire | US$1.07 mn | Africa; official_value; WITS / UN COMTRADE H0; 2024; HS 8542 exports to World. |
| 81 | Uzbekistan | US$0.96 mn | Asia; official_value; WITS / UN COMTRADE H0; 2024; HS 8542 exports to World. |
| 82 | Pakistan | US$0.80 mn | Asia; official_value; WITS / UN COMTRADE H0; 2024; HS 8542 exports to World. |
| 83 | Kuwait | US$0.75 mn | Asia; official_value; WITS / UN COMTRADE H0; 2024; HS 8542 exports to World. |
| 84 | Moldova | US$0.67 mn | Europe; official_value; WITS / UN COMTRADE H0; 2024; HS 8542 exports to World. |
| 85 | Tanzania | US$0.67 mn | Africa; official_value; WITS / UN COMTRADE H0; 2024; HS 8542 exports to World. |
| 86 | Cyprus | US$0.60 mn | Europe/Asia; official_value; WITS / UN COMTRADE H0; 2024; HS 8542 exports to World. |
| 87 | Jamaica | US$0.52 mn | Caribbean; official_value; WITS / UN COMTRADE H0; 2024; HS 8542 exports to World. |
| 88 | Mauritius | US$0.51 mn | Africa; official_value; WITS / UN COMTRADE H0; 2024; HS 8542 exports to World. |
| 89 | Togo | US$0.43 mn | Africa; official_value; WITS / UN COMTRADE H0; 2024; HS 8542 exports to World. |
| 90 | Paraguay | US$0.40 mn | South America; official_value; WITS / UN COMTRADE H0; 2024; HS 8542 exports to World. |
| 91 | Benin | US$0.33 mn | Africa; official_value; WITS / UN COMTRADE H0; 2024; HS 8542 exports to World. |
| 92 | Senegal | US$0.26 mn | Africa; official_value; WITS / UN COMTRADE H0; 2024; HS 8542 exports to World. |
| 93 | Iceland | US$0.25 mn | Europe; official_value; WITS / UN COMTRADE H0; 2024; HS 8542 exports to World. |
| 94 | Zimbabwe | US$0.23 mn | Africa; official_value; WITS / UN COMTRADE H0; 2024; HS 8542 exports to World. |
| 95 | Nigeria | US$0.17 mn | Africa; official_value; WITS / UN COMTRADE H0; 2024; HS 8542 exports to World. |
| 96 | Georgia | US$0.17 mn | Europe/Asia; official_value; WITS / UN COMTRADE H0; 2024; HS 8542 exports to World. |
| 97 | El Salvador | US$0.17 mn | Central America; official_value; WITS / UN COMTRADE H0; 2024; HS 8542 exports to World. |
| 98 | Madagascar | US$0.17 mn | Africa; official_value; WITS / UN COMTRADE H0; 2024; HS 8542 exports to World. |
| 99 | Kenya | US$0.17 mn | Africa; official_value; WITS / UN COMTRADE H0; 2024; HS 8542 exports to World. |
| 100 | Barbados | US$0.16 mn | Caribbean; official_value; WITS / UN COMTRADE H0; 2024; HS 8542 exports to World. |
Table note: all values are official 2024 WITS / UN COMTRADE H0 exports for HS 8542 to World. The European Union aggregate is excluded. Values are displayed in US$ million and rounded to two decimals; ranks use the underlying unrounded values. Snapshot accessed June 14, 2026.
Insights
Key insight
The Top 6 are all Asian economies or trade hubs, showing that integrated-circuit exports are concentrated around East and Southeast Asian supply chains.
Notable pattern
The United States and Germany are the only non-Asian entries in the Top 10, while European countries appear more frequently in the middle of the Top 100.
Regional concentration
Asia dominates the top of the distribution, but the full table includes Europe, North America, Latin America, Africa and Oceania, mostly at much smaller export values.
Outlier
Hong Kong leads the export ranking, but that position should be read as a trade-hub signal rather than direct evidence of domestic wafer fabrication capacity.
What It Means
For readers tracking semiconductor supply chains, this table is most useful as a map of export routing and trade concentration. A high rank can indicate domestic chip output, assembly and testing activity, re-export flows, or a combination of these factors.
For policy and investment analysis, the ranking should be paired with production-capacity, R&D, equipment, workforce and company-level indicators. Export value alone cannot identify technology-node leadership or the share of domestic value added embedded in each shipment.
For trade readers, the ranking helps show where HS 8542 cross-border flows are concentrated in official merchandise trade data. The sharp drop after the leading economies is a useful signal of how narrow the high-value integrated-circuit export base remains.
FAQ
Which country or economy leads integrated circuit exports in 2024?
Hong Kong, China ranks first in this table with US$220,237.87 million in HS 8542 exports. The result reflects gross export value and can include re-export and logistics activity.
Does this ranking measure semiconductor production?
No. It measures exports of HS 8542 goods. Production capacity, wafer starts, foundry output and technology-node leadership require different datasets.
Why does the table use “Other Asia, nes”?
“Other Asia, nes” is the WITS reporter label commonly used for Taiwan in this dataset. The source label is retained to keep the table aligned with the official data extract.
Why is the European Union aggregate excluded?
The European Union aggregate overlaps with EU member-state export rows. Including it would double-count trade values in a country-and-economy ranking.
Why are values shown in US$ million?
WITS reports trade value in 1000 USD. The table divides the source value by 1,000 to display US$ million, which is easier to read across a Top 100 ranking.
Are these forecasts or official values?
All rows are official_value rows from the WITS / UN COMTRADE H0 table for 2024. The page does not use forecasts, modeled projections, CAGR assumptions or averaged estimates.
Can this ranking be used to compare chip technology leadership?
Only indirectly and with caution. HS 8542 exports show trade value for integrated circuits. Technology leadership requires evidence such as fabrication nodes, foundry capacity, patents, equipment access, R&D and company-level output.
Sources
The ranking values come from one official trade data source. The additional source cards explain the product classification and trade-data context used to interpret HS 8542 correctly.
World Bank WITS / UN COMTRADE H0
Primary source for 2024 HS 8542 export values by reporter, partner World and trade flow Exports. Used for ranking values and row status.
WITS Advanced Query / Raw Trade Data
Extraction path: nomenclature H0; product HS 8542; reporters all available countries and economies; partner World; flow Exports; year 2024; source unit 1000 USD converted to US$ million.
UN Comtrade
International merchandise trade database underlying many official product-level trade comparisons used through WITS.
World Customs Organization HS nomenclature
Classification context for Harmonized System product codes, including the distinction between HS 8542 and other semiconductor-related headings.
Related rankings
More StatRanker rankings on trade flows, exports, imports and economic scale.
Top 10 Countries by ICT Services Exports (% of Total Exports) — 2025
Open rankingUK Exports and Imports Since 2020: What Changed, What Held Up, and Why the 2025 Data Matter
Open rankingU.S. Exports and Imports Since 2026: Impact on Global Trade and Economic Growth
Open rankingDigital trade and cross-border services: a new era of exports
Open ranking
StatRanker (Website)
administrator
