

Top 100 Countries by Manufacturing Value Added
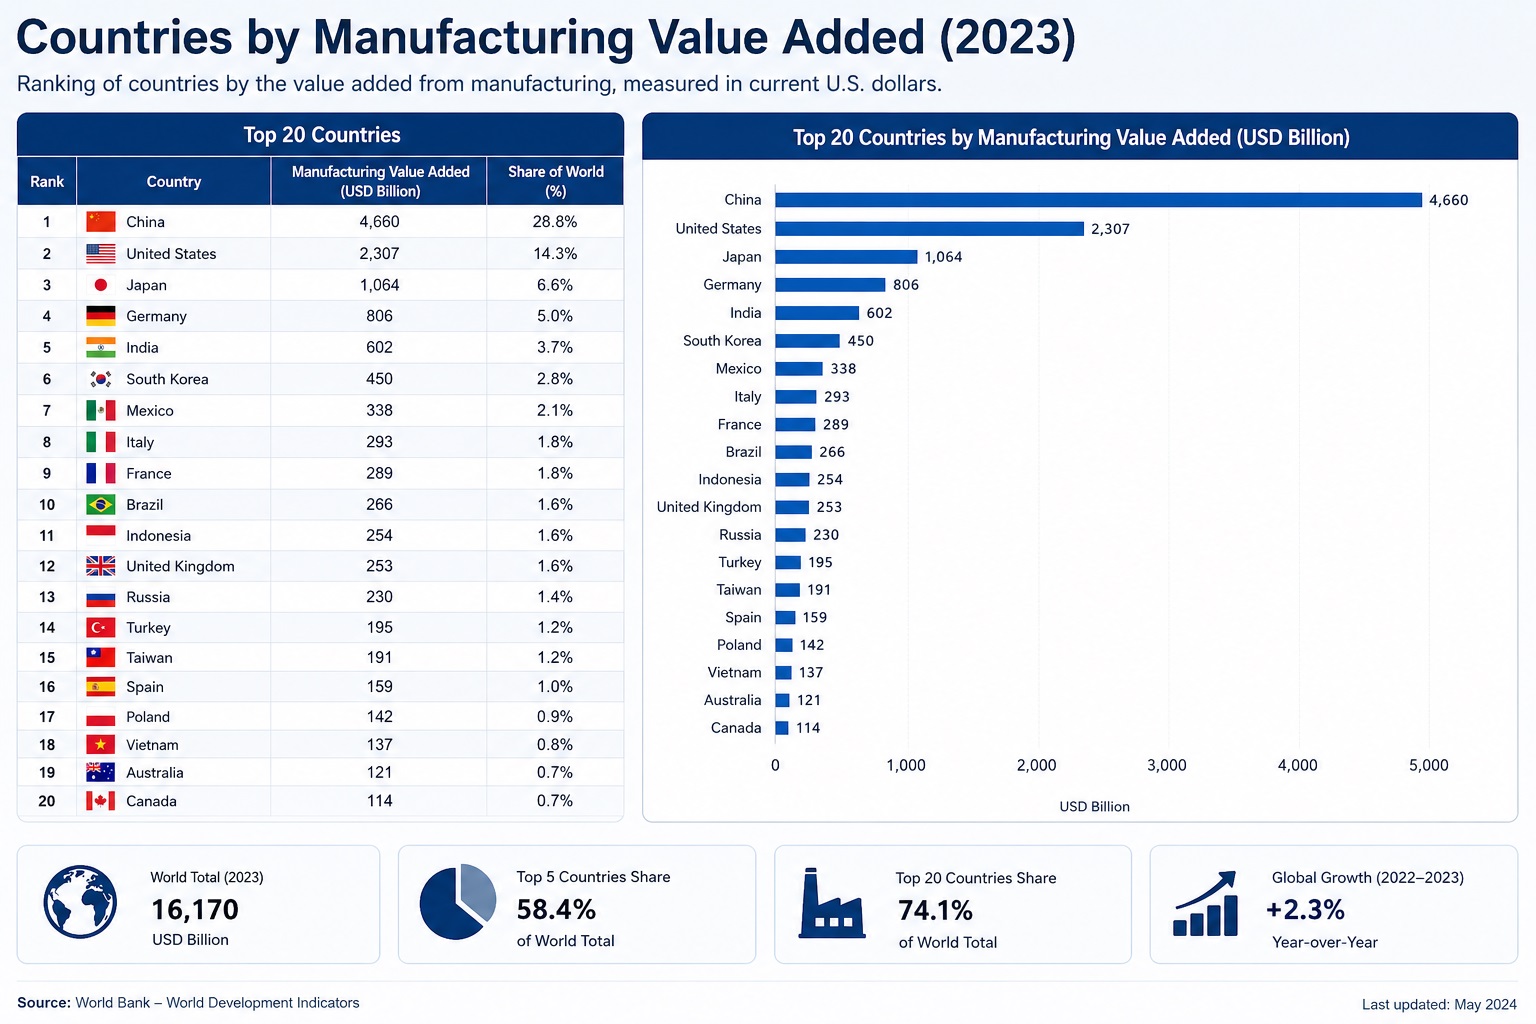
Top 100 Countries and Economies by Manufacturing Value Added: 2026 Snapshot Based on Latest Available World Bank Data, Mostly 2024 Values
Manufacturing value added measures the net output of manufacturing after intermediate inputs are subtracted. This ranking uses the World Bank World Development Indicators series NV.IND.MANF.CD, expressed in current U.S. dollars. Larger values rank higher.
This is a 2026 snapshot based on the latest available World Bank values, not a synchronized single-year industrial census. Most rows use 2024 observations, while some economies have older latest values in the public indicator table. The row-level source year is shown in every table note.
The table uses a single-source official indicator dataset, covers 100 countries and economies with available World Bank manufacturing value added values, displays values in current US$ billions, and ranks entries in descending order. All rows are official values; no forecasts and no modeled projections are included.
Continue exploring
More StatRanker pages connected by topic, category or ranking theme.
TOP 10 Countries by Manufacturing Value Added per Capita (2025)
Open rankingTop 10 Battery Manufacturing Countries by Announced 2030 Capacity
Open rankingTop 100 Defense Companies by Revenue, 2026 Snapshot
Open rankingUS$4,661.4 bn; official World Bank value; latest source year 2024.
US$4.3 bn; official World Bank value; latest source year 2024.
Countries and economies with available World Bank manufacturing value added values; aggregates and blank-value rows are excluded.
Current U.S. dollars; 100 official values; 0 official forecasts; 0 modeled projections.
Audit note: the United States and Canada use 2021 latest values, Japan uses 2023, New Zealand uses 2022, Cuba uses 2020 and Venezuela uses 2011. These older latest years are retained only because the World Bank indicator table reports them as the most recent available value for that economy.
Overview
The top of the ranking is highly concentrated. China and the United States stand far above the rest of the table, while Japan and Germany remain the next large manufacturing systems. The Republic of Korea and India complete the first group above roughly US$490 billion.
The next tier mixes large advanced economies, export-oriented Asian producers and major emerging markets. Mexico, Italy, France, the United Kingdom, Russia, Indonesia, Brazil and Türkiye all sit above US$200 billion in latest available manufacturing value added.
This metric is an output-value measure, not a measure of factory employment, export competitiveness, high-tech intensity or productivity per worker. A country can have a large manufacturing value because of scale, population, domestic demand, exchange-rate level and price structure, not only because of technological sophistication.
Top 10 by manufacturing value added
The Top 10 shows the structure of global manufacturing scale: one very large Asian leader, one very large North American economy, two mature industrial powers in Japan and Germany, then a mix of Asian, North American and European producers. The United States remains second even though its latest World Bank value in this indicator snapshot is older than most other Top 10 entries.
| Rank | Entity | Value | Source / method note |
|---|---|---|---|
| 1 | China | US$4,661.4 bn | Status: official value; World Bank WDI NV.IND.MANF.CD; latest year 2024; current US$; ranked descending. |
| 2 | United States | US$2,497.1 bn | Status: official value; World Bank WDI NV.IND.MANF.CD; latest year 2021; current US$; ranked descending. |
| 3 | Japan | US$867.1 bn | Status: official value; World Bank WDI NV.IND.MANF.CD; latest year 2023; current US$; ranked descending. |
| 4 | Germany | US$843.7 bn | Status: official value; World Bank WDI NV.IND.MANF.CD; latest year 2024; current US$; ranked descending. |
| 5 | Korea, Rep. | US$499.2 bn | Status: official value; World Bank WDI NV.IND.MANF.CD; latest year 2024; current US$; ranked descending. |
| 6 | India | US$493.0 bn | Status: official value; World Bank WDI NV.IND.MANF.CD; latest year 2024; current US$; ranked descending. |
| 7 | Mexico | US$367.6 bn | Status: official value; World Bank WDI NV.IND.MANF.CD; latest year 2024; current US$; ranked descending. |
| 8 | Italy | US$352.9 bn | Status: official value; World Bank WDI NV.IND.MANF.CD; latest year 2024; current US$; ranked descending. |
| 9 | France | US$302.3 bn | Status: official value; World Bank WDI NV.IND.MANF.CD; latest year 2024; current US$; ranked descending. |
| 10 | United Kingdom | US$294.3 bn | Status: official value; World Bank WDI NV.IND.MANF.CD; latest year 2024; current US$; ranked descending. |
Source: World Bank World Development Indicators, indicator NV.IND.MANF.CD. Display values are rounded to one decimal billion from source values reported in current US$ millions.
Chart: Top 20 manufacturing value added leaders
The bar chart compares the Top 20 against China as the largest value in the table. It uses the same latest-available World Bank values as the ranking table and displays them in current US$ billions.
Methodology
The metric is manufacturing value added in current U.S. dollars. Value added is the net output of manufacturing after intermediate inputs are subtracted. The source indicator is World Bank WDI NV.IND.MANF.CD, which is based on national accounts data, OECD national accounts files and World Bank staff estimates.
Ranking direction is descending: a larger current-dollar manufacturing value ranks higher. Aggregates such as World, European Union, OECD members and income groups are excluded. Rows with no available value in the public indicator snapshot are excluded. Countries and economies are retained where the World Bank indicator provides a latest available value.
Year logic
The target snapshot is 2026, based on the latest available World Bank values checked on June 14, 2026. Most rows are 2024; older latest years are shown row by row.
Unit and rounding
The source reports current US$ values in millions. The table displays current US$ billions rounded to one decimal place.
Row type
Every included row is an official latest-available value from the World Bank indicator series. No official forecasts and no modeled projections are used.
Limits
The metric does not measure manufacturing jobs, output volume in constant prices, productivity, technology level, export quality or supply-chain resilience.
Current-dollar comparisons can be affected by inflation, exchange rates, price levels and revision cycles in national accounts. They are useful for measuring the dollar scale of manufacturing value added, but they should not be treated as a direct comparison of physical production volumes or industrial competitiveness.
Main ranking table: Top 100 countries and economies by manufacturing value added
Use the controls to compare economies by region, source year and value. The original rank is fixed by the latest available World Bank manufacturing value added value in current U.S. dollars.
Audit path: this is not a synchronized 2024-only table. Most rows use 2024 World Bank values, but the United States and Canada use 2021 latest values, Japan uses 2023, New Zealand uses 2022, Cuba uses 2020 and Venezuela uses 2011. These rows are retained because they are the latest available values in the selected World Bank indicator series.
| Rank | Entity | Value | Source / method note |
|---|---|---|---|
| 1 | China | US$4,661.4 bn | Status: official value; World Bank WDI NV.IND.MANF.CD; latest year 2024; current US$; rounded from source millions. |
| 2 | United States | US$2,497.1 bn | Status: official value; World Bank WDI NV.IND.MANF.CD; latest year 2021; current US$; rounded from source millions. |
| 3 | Japan | US$867.1 bn | Status: official value; World Bank WDI NV.IND.MANF.CD; latest year 2023; current US$; rounded from source millions. |
| 4 | Germany | US$843.7 bn | Status: official value; World Bank WDI NV.IND.MANF.CD; latest year 2024; current US$; rounded from source millions. |
| 5 | Korea, Rep. | US$499.2 bn | Status: official value; World Bank WDI NV.IND.MANF.CD; latest year 2024; current US$; rounded from source millions. |
| 6 | India | US$493.0 bn | Status: official value; World Bank WDI NV.IND.MANF.CD; latest year 2024; current US$; rounded from source millions. |
| 7 | Mexico | US$367.6 bn | Status: official value; World Bank WDI NV.IND.MANF.CD; latest year 2024; current US$; rounded from source millions. |
| 8 | Italy | US$352.9 bn | Status: official value; World Bank WDI NV.IND.MANF.CD; latest year 2024; current US$; rounded from source millions. |
| 9 | France | US$302.3 bn | Status: official value; World Bank WDI NV.IND.MANF.CD; latest year 2024; current US$; rounded from source millions. |
| 10 | United Kingdom | US$294.3 bn | Status: official value; World Bank WDI NV.IND.MANF.CD; latest year 2024; current US$; rounded from source millions. |
| 11 | Russian Federation | US$288.1 bn | Status: official value; World Bank WDI NV.IND.MANF.CD; latest year 2024; current US$; rounded from source millions. |
| 12 | Indonesia | US$265.1 bn | Status: official value; World Bank WDI NV.IND.MANF.CD; latest year 2024; current US$; rounded from source millions. |
| 13 | Brazil | US$264.7 bn | Status: official value; World Bank WDI NV.IND.MANF.CD; latest year 2024; current US$; rounded from source millions. |
| 14 | Turkiye | US$228.9 bn | Status: official value; World Bank WDI NV.IND.MANF.CD; latest year 2024; current US$; rounded from source millions. |
| 15 | Saudi Arabia | US$194.9 bn | Status: official value; World Bank WDI NV.IND.MANF.CD; latest year 2024; current US$; rounded from source millions. |
| 16 | Canada | US$187.2 bn | Status: official value; World Bank WDI NV.IND.MANF.CD; latest year 2021; current US$; rounded from source millions. |
| 17 | Spain | US$187.1 bn | Status: official value; World Bank WDI NV.IND.MANF.CD; latest year 2024; current US$; rounded from source millions. |
| 18 | Ireland | US$180.1 bn | Status: official value; World Bank WDI NV.IND.MANF.CD; latest year 2024; current US$; rounded from source millions. |
| 19 | Switzerland | US$165.7 bn | Status: official value; World Bank WDI NV.IND.MANF.CD; latest year 2024; current US$; rounded from source millions. |
| 20 | Poland | US$147.5 bn | Status: official value; World Bank WDI NV.IND.MANF.CD; latest year 2024; current US$; rounded from source millions. |
| 21 | Thailand | US$128.1 bn | Status: official value; World Bank WDI NV.IND.MANF.CD; latest year 2024; current US$; rounded from source millions. |
| 22 | Netherlands | US$122.3 bn | Status: official value; World Bank WDI NV.IND.MANF.CD; latest year 2024; current US$; rounded from source millions. |
| 23 | Viet Nam | US$116.4 bn | Status: official value; World Bank WDI NV.IND.MANF.CD; latest year 2024; current US$; rounded from source millions. |
| 24 | Bangladesh | US$98.5 bn | Status: official value; World Bank WDI NV.IND.MANF.CD; latest year 2024; current US$; rounded from source millions. |
| 25 | Iran, Islamic Rep. | US$97.9 bn | Status: official value; World Bank WDI NV.IND.MANF.CD; latest year 2024; current US$; rounded from source millions. |
| 26 | Argentina | US$96.9 bn | Status: official value; World Bank WDI NV.IND.MANF.CD; latest year 2024; current US$; rounded from source millions. |
| 27 | Malaysia | US$95.0 bn | Status: official value; World Bank WDI NV.IND.MANF.CD; latest year 2024; current US$; rounded from source millions. |
| 28 | Australia | US$94.5 bn | Status: official value; World Bank WDI NV.IND.MANF.CD; latest year 2024; current US$; rounded from source millions. |
| 29 | Singapore | US$89.4 bn | Status: official value; World Bank WDI NV.IND.MANF.CD; latest year 2024; current US$; rounded from source millions. |
| 30 | Austria | US$80.9 bn | Status: official value; World Bank WDI NV.IND.MANF.CD; latest year 2024; current US$; rounded from source millions. |
| 31 | Sweden | US$78.5 bn | Status: official value; World Bank WDI NV.IND.MANF.CD; latest year 2024; current US$; rounded from source millions. |
| 32 | Belgium | US$76.8 bn | Status: official value; World Bank WDI NV.IND.MANF.CD; latest year 2024; current US$; rounded from source millions. |
| 33 | Denmark | US$75.8 bn | Status: official value; World Bank WDI NV.IND.MANF.CD; latest year 2024; current US$; rounded from source millions. |
| 34 | Philippines | US$72.4 bn | Status: official value; World Bank WDI NV.IND.MANF.CD; latest year 2024; current US$; rounded from source millions. |
| 35 | Czechia | US$69.0 bn | Status: official value; World Bank WDI NV.IND.MANF.CD; latest year 2024; current US$; rounded from source millions. |
| 36 | Israel | US$60.1 bn | Status: official value; World Bank WDI NV.IND.MANF.CD; latest year 2024; current US$; rounded from source millions. |
| 37 | Puerto Rico (US) | US$55.6 bn | Status: official value; World Bank WDI NV.IND.MANF.CD; latest year 2024; current US$; rounded from source millions. |
| 38 | Egypt, Arab Rep. | US$54.1 bn | Status: official value; World Bank WDI NV.IND.MANF.CD; latest year 2024; current US$; rounded from source millions. |
| 39 | United Arab Emirates | US$51.8 bn | Status: official value; World Bank WDI NV.IND.MANF.CD; latest year 2024; current US$; rounded from source millions. |
| 40 | South Africa | US$51.3 bn | Status: official value; World Bank WDI NV.IND.MANF.CD; latest year 2024; current US$; rounded from source millions. |
| 41 | Romania | US$50.5 bn | Status: official value; World Bank WDI NV.IND.MANF.CD; latest year 2024; current US$; rounded from source millions. |
| 42 | Pakistan | US$48.9 bn | Status: official value; World Bank WDI NV.IND.MANF.CD; latest year 2024; current US$; rounded from source millions. |
| 43 | Finland | US$42.5 bn | Status: official value; World Bank WDI NV.IND.MANF.CD; latest year 2024; current US$; rounded from source millions. |
| 44 | Colombia | US$42.3 bn | Status: official value; World Bank WDI NV.IND.MANF.CD; latest year 2024; current US$; rounded from source millions. |
| 45 | Venezuela, RB | US$36.9 bn | Status: official value; World Bank WDI NV.IND.MANF.CD; latest year 2011; current US$; rounded from source millions. |
| 46 | Portugal | US$36.8 bn | Status: official value; World Bank WDI NV.IND.MANF.CD; latest year 2024; current US$; rounded from source millions. |
| 47 | Kazakhstan | US$36.1 bn | Status: official value; World Bank WDI NV.IND.MANF.CD; latest year 2024; current US$; rounded from source millions. |
| 48 | Hungary | US$35.2 bn | Status: official value; World Bank WDI NV.IND.MANF.CD; latest year 2024; current US$; rounded from source millions. |
| 49 | Peru | US$35.0 bn | Status: official value; World Bank WDI NV.IND.MANF.CD; latest year 2024; current US$; rounded from source millions. |
| 50 | Norway | US$29.8 bn | Status: official value; World Bank WDI NV.IND.MANF.CD; latest year 2024; current US$; rounded from source millions. |
| 51 | Chile | US$29.8 bn | Status: official value; World Bank WDI NV.IND.MANF.CD; latest year 2024; current US$; rounded from source millions. |
| 52 | Algeria | US$25.5 bn | Status: official value; World Bank WDI NV.IND.MANF.CD; latest year 2024; current US$; rounded from source millions. |
| 53 | Morocco | US$24.5 bn | Status: official value; World Bank WDI NV.IND.MANF.CD; latest year 2024; current US$; rounded from source millions. |
| 54 | Greece | US$23.2 bn | Status: official value; World Bank WDI NV.IND.MANF.CD; latest year 2024; current US$; rounded from source millions. |
| 55 | Uzbekistan | US$23.2 bn | Status: official value; World Bank WDI NV.IND.MANF.CD; latest year 2024; current US$; rounded from source millions. |
| 56 | Slovak Republic | US$23.0 bn | Status: official value; World Bank WDI NV.IND.MANF.CD; latest year 2024; current US$; rounded from source millions. |
| 57 | New Zealand | US$22.2 bn | Status: official value; World Bank WDI NV.IND.MANF.CD; latest year 2022; current US$; rounded from source millions. |
| 58 | Nigeria | US$21.8 bn | Status: official value; World Bank WDI NV.IND.MANF.CD; latest year 2024; current US$; rounded from source millions. |
| 59 | Qatar | US$17.7 bn | Status: official value; World Bank WDI NV.IND.MANF.CD; latest year 2024; current US$; rounded from source millions. |
| 60 | Sri Lanka | US$17.4 bn | Status: official value; World Bank WDI NV.IND.MANF.CD; latest year 2024; current US$; rounded from source millions. |
| 61 | Myanmar | US$16.7 bn | Status: official value; World Bank WDI NV.IND.MANF.CD; latest year 2024; current US$; rounded from source millions. |
| 62 | Ecuador | US$16.1 bn | Status: official value; World Bank WDI NV.IND.MANF.CD; latest year 2024; current US$; rounded from source millions. |
| 63 | Ukraine | US$16.0 bn | Status: official value; World Bank WDI NV.IND.MANF.CD; latest year 2024; current US$; rounded from source millions. |
| 64 | Dominican Republic | US$15.5 bn | Status: official value; World Bank WDI NV.IND.MANF.CD; latest year 2024; current US$; rounded from source millions. |
| 65 | Belarus | US$15.4 bn | Status: official value; World Bank WDI NV.IND.MANF.CD; latest year 2024; current US$; rounded from source millions. |
| 66 | Guatemala | US$15.4 bn | Status: official value; World Bank WDI NV.IND.MANF.CD; latest year 2024; current US$; rounded from source millions. |
| 67 | Slovenia | US$14.1 bn | Status: official value; World Bank WDI NV.IND.MANF.CD; latest year 2024; current US$; rounded from source millions. |
| 68 | Cambodia | US$12.9 bn | Status: official value; World Bank WDI NV.IND.MANF.CD; latest year 2024; current US$; rounded from source millions. |
| 69 | Kuwait | US$12.8 bn | Status: official value; World Bank WDI NV.IND.MANF.CD; latest year 2024; current US$; rounded from source millions. |
| 70 | Costa Rica | US$12.4 bn | Status: official value; World Bank WDI NV.IND.MANF.CD; latest year 2024; current US$; rounded from source millions. |
| 71 | Cuba | US$12.0 bn | Status: official value; World Bank WDI NV.IND.MANF.CD; latest year 2020; current US$; rounded from source millions. |
| 72 | Lithuania | US$11.9 bn | Status: official value; World Bank WDI NV.IND.MANF.CD; latest year 2024; current US$; rounded from source millions. |
| 73 | Serbia | US$11.4 bn | Status: official value; World Bank WDI NV.IND.MANF.CD; latest year 2024; current US$; rounded from source millions. |
| 74 | Iraq | US$11.4 bn | Status: official value; World Bank WDI NV.IND.MANF.CD; latest year 2024; current US$; rounded from source millions. |
| 75 | Cote d'Ivoire | US$11.3 bn | Status: official value; World Bank WDI NV.IND.MANF.CD; latest year 2024; current US$; rounded from source millions. |
| 76 | Oman | US$10.7 bn | Status: official value; World Bank WDI NV.IND.MANF.CD; latest year 2024; current US$; rounded from source millions. |
| 77 | Croatia | US$9.7 bn | Status: official value; World Bank WDI NV.IND.MANF.CD; latest year 2024; current US$; rounded from source millions. |
| 78 | Jordan | US$9.4 bn | Status: official value; World Bank WDI NV.IND.MANF.CD; latest year 2024; current US$; rounded from source millions. |
| 79 | Bahrain | US$9.4 bn | Status: official value; World Bank WDI NV.IND.MANF.CD; latest year 2024; current US$; rounded from source millions. |
| 80 | Turkmenistan | US$9.2 bn | Status: official value; World Bank WDI NV.IND.MANF.CD; latest year 2024; current US$; rounded from source millions. |
| 81 | Kenya | US$8.7 bn | Status: official value; World Bank WDI NV.IND.MANF.CD; latest year 2024; current US$; rounded from source millions. |
| 82 | Paraguay | US$8.5 bn | Status: official value; World Bank WDI NV.IND.MANF.CD; latest year 2024; current US$; rounded from source millions. |
| 83 | Uganda | US$8.1 bn | Status: official value; World Bank WDI NV.IND.MANF.CD; latest year 2024; current US$; rounded from source millions. |
| 84 | Ghana | US$8.1 bn | Status: official value; World Bank WDI NV.IND.MANF.CD; latest year 2024; current US$; rounded from source millions. |
| 85 | Uruguay | US$7.8 bn | Status: official value; World Bank WDI NV.IND.MANF.CD; latest year 2024; current US$; rounded from source millions. |
| 86 | Angola | US$7.7 bn | Status: official value; World Bank WDI NV.IND.MANF.CD; latest year 2024; current US$; rounded from source millions. |
| 87 | Tunisia | US$7.6 bn | Status: official value; World Bank WDI NV.IND.MANF.CD; latest year 2024; current US$; rounded from source millions. |
| 88 | Bolivia | US$7.2 bn | Status: official value; World Bank WDI NV.IND.MANF.CD; latest year 2024; current US$; rounded from source millions. |
| 89 | Cameroon | US$6.9 bn | Status: official value; World Bank WDI NV.IND.MANF.CD; latest year 2024; current US$; rounded from source millions. |
| 90 | Haiti | US$6.6 bn | Status: official value; World Bank WDI NV.IND.MANF.CD; latest year 2024; current US$; rounded from source millions. |
| 91 | Ethiopia | US$6.6 bn | Status: official value; World Bank WDI NV.IND.MANF.CD; latest year 2024; current US$; rounded from source millions. |
| 92 | Zimbabwe | US$6.5 bn | Status: official value; World Bank WDI NV.IND.MANF.CD; latest year 2024; current US$; rounded from source millions. |
| 93 | Tanzania | US$6.4 bn | Status: official value; World Bank WDI NV.IND.MANF.CD; latest year 2024; current US$; rounded from source millions. |
| 94 | Congo, Dem. Rep. | US$5.8 bn | Status: official value; World Bank WDI NV.IND.MANF.CD; latest year 2024; current US$; rounded from source millions. |
| 95 | Honduras | US$5.5 bn | Status: official value; World Bank WDI NV.IND.MANF.CD; latest year 2024; current US$; rounded from source millions. |
| 96 | Estonia | US$4.7 bn | Status: official value; World Bank WDI NV.IND.MANF.CD; latest year 2024; current US$; rounded from source millions. |
| 97 | Senegal | US$4.5 bn | Status: official value; World Bank WDI NV.IND.MANF.CD; latest year 2024; current US$; rounded from source millions. |
| 98 | Latvia | US$4.3 bn | Status: official value; World Bank WDI NV.IND.MANF.CD; latest year 2024; current US$; rounded from source millions. |
| 99 | Panama | US$4.3 bn | Status: official value; World Bank WDI NV.IND.MANF.CD; latest year 2024; current US$; rounded from source millions. |
| 100 | El Salvador | US$4.3 bn | Status: official value; World Bank WDI NV.IND.MANF.CD; latest year 2024; current US$; rounded from source millions. |
Source snapshot: World Bank World Development Indicators, NV.IND.MANF.CD, latest available values checked on June 14, 2026. Aggregates and rows without available values are excluded. Display values are rounded to one decimal billion from source values reported in current US$ millions.
Insights
Scale is extremely concentrated. China and the United States dominate the first tier of the table. The United States remains second even with a 2021 latest value, which is why this page is presented as a latest-available World Bank snapshot rather than a pure 2024 ranking.
Asia-Pacific is central at the top. China, Japan, Korea, India, Indonesia, Thailand and Viet Nam all appear in the upper section, showing the region’s role in global manufacturing scale.
Europe is broad rather than singular. Germany leads Europe, while Italy, France, the United Kingdom, Spain, Ireland, Switzerland, Poland, the Netherlands and Central European economies add depth to the region’s manufacturing base.
Puerto Rico appears high relative to its population size. Its ranking reflects the value of manufacturing activity captured in the World Bank economy-level dataset, not country size or employment volume.
What it means
Manufacturing value added is useful for understanding the scale of a country’s industrial production base in monetary terms. Large values usually point to deep supplier networks, a large domestic market, export capacity, capital-intensive sectors or a combination of these factors.
For investors and analysts, the ranking helps separate manufacturing scale from manufacturing dependence. A country can rank high by value while manufacturing accounts for a modest share of its GDP, and a smaller country can depend heavily on manufacturing while still ranking lower by absolute current-dollar value.
For policy readers, the table highlights where industrial capacity is concentrated, but it does not answer whether manufacturing is becoming more productive, greener, more technologically advanced or more resilient.
FAQ
Which country has the largest manufacturing value added?
China ranks first in the table, with US$4,661.4 billion in manufacturing value added in the latest World Bank value shown for 2024.
Why are some rows not from 2024?
The ranking uses the latest available value in the World Bank indicator table. Some economies have older latest observations, including the United States and Canada for 2021, Japan for 2023, New Zealand for 2022, Cuba for 2020 and Venezuela for 2011.
Does this ranking measure factory production volume?
No. It measures value added in current U.S. dollars. It is affected by prices, exchange rates and national accounts revisions, so it is not the same as physical output volume.
Does a higher value mean a more advanced manufacturing sector?
Not necessarily. A high value can come from economic scale, population, exchange rates or large domestic demand. Industrial sophistication should be checked with productivity, technology, export and sector-composition indicators.
Why are countries and economies both included?
The table follows World Bank country/economy coverage. Some non-sovereign economies may appear where the World Bank reports an indicator value, while regional and income-group aggregates are excluded.
Why are aggregates excluded?
Aggregates such as World, European Union, OECD members and income groups are not individual countries or economies. Including them would distort a Top 100 country/economy ranking.
Why use current U.S. dollars instead of constant dollars?
Current U.S. dollars show the latest monetary scale of manufacturing value added. Constant-dollar data are better for real growth over time, but this ranking is by current size, not inflation-adjusted growth.
Are forecasts or projections included?
No. All rows are official latest-available values from the World Bank indicator series. The table does not use modeled projections, growth assumptions or official forecasts.
Sources
Main data source for every row in the ranking. The indicator reports manufacturing value added in current U.S. dollars and lists the source base as national accounts data, OECD national accounts files and World Bank staff estimates. Data checked on June 14, 2026.
Database environment for verifying the WDI indicator, country/economy series and year availability across national accounts indicators.
https://databank.worldbank.org/reports.aspx?series=NV.IND.MANF.CD&source=2
Used for the public open-data environment and citation context. The World Bank indicator page lists the license as CC BY-4.0.
Used only as contextual background for interpreting manufacturing and industrial statistics. It is not used to overwrite the row-level World Bank values in the ranking table.
Related rankings
More StatRanker pages connected by topic, category or ranking theme.
