

Top 100 Countries by Personal Remittances Received in 2026
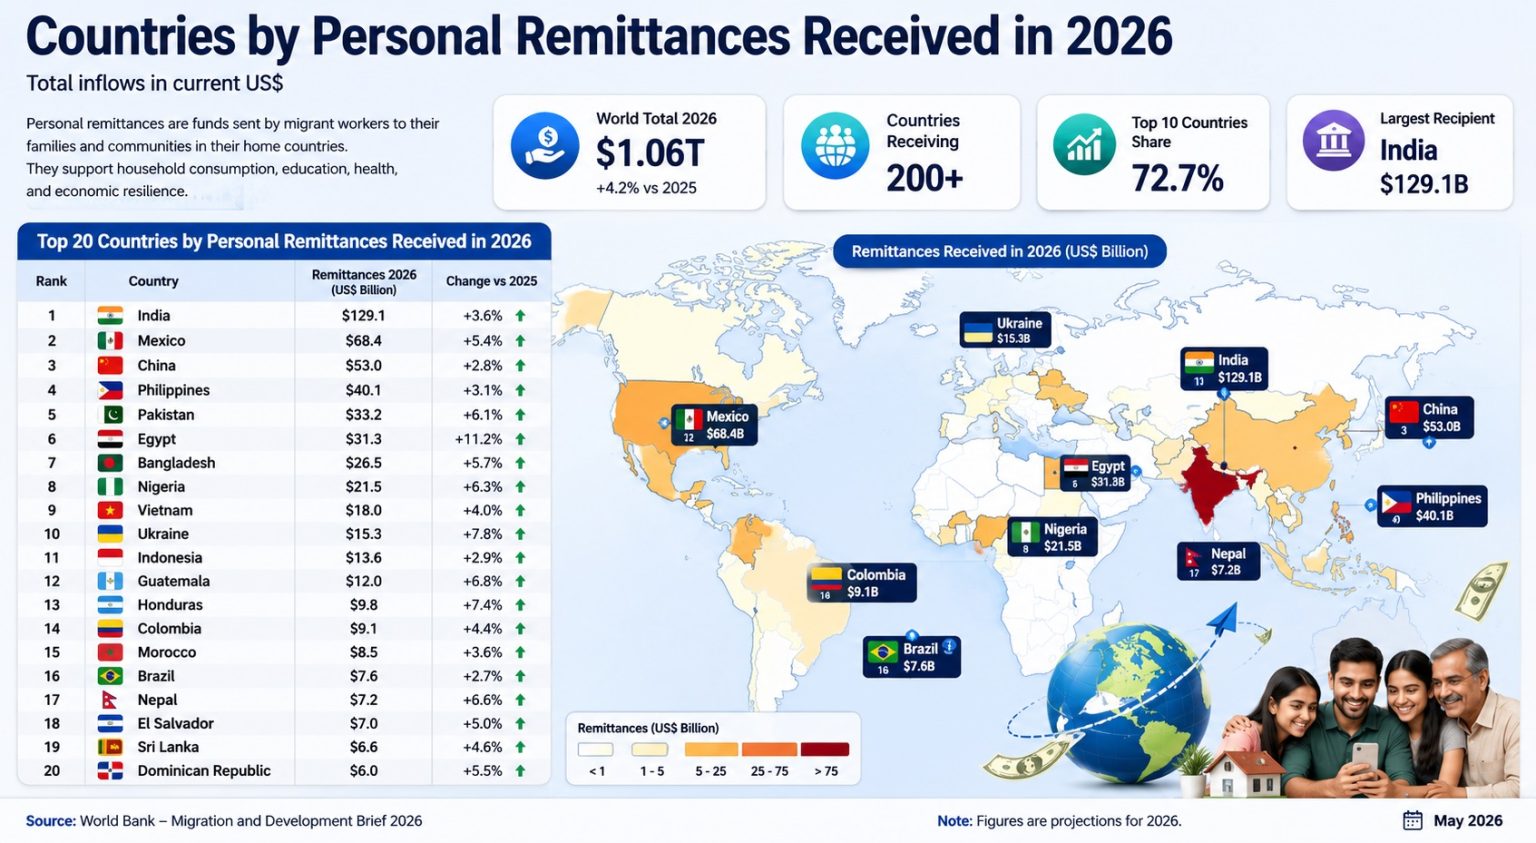
Global Remittance Inflows by Country: 2026 Snapshot from World Bank Data
This ranking compares countries and economies by the amount of personal remittances received from abroad. The metric is personal remittances received, current U.S. dollars, ranked in descending order, so a larger value means a larger recorded inflow.
This is a 2026 snapshot based on the latest available World Bank data. The ranking is not a forecast for calendar year 2026. The table is a compiled official-source research dataset based on 3 sources, with row-level source and method notes shown in the ranking table.
The table contains 100 official World Bank value rows, 0 official forecasts and 0 modeled projections. Personal remittances comprise personal transfers and compensation of employees; they do not measure all diaspora investment, informal transfers, capital flows or foreign aid.
US$137.68 bn; official World Bank latest-available value; ranked first by total inflow.
US$0.76 bn; included as the 100th confirmed row in this compiled ranking.
Countries and economies with confirmed latest-available World Bank remittance values.
Current U.S. dollars; 100 official World Bank value rows; no forecasts or modeled projections.
What personal remittances show
Remittances measure cross-border money flows connected to households and migrant work. A high value normally reflects a large diaspora, strong migration corridors, migrant employment in high-income economies, formal transfer channels and the scale of family support sent back to the receiving country.
The measure is an absolute national inflow, not a dependency ratio. A large economy can rank high because its diaspora is large, while a smaller economy can be more dependent on remittances even with a lower dollar amount. For dependency, remittances as a share of GDP should be read separately.
Top 10 countries by remittances received
The top group is led by countries with very large migrant communities and long-established labor corridors. India and Mexico stand apart by scale, while the Philippines, Pakistan, Bangladesh, Guatemala, Nigeria and Egypt show how remittances support both large labor-exporting economies and countries with strong family-transfer channels.
| Rank | Country | Value | Source / Method Note |
|---|---|---|---|
| 1 | India | US$137.68 bn | Official World Bank value; WDI BX.TRF.PWKR.CD.DT; latest available source year; current US$; ranked descending. |
| 2 | Mexico | US$67.64 bn | Official World Bank value; WDI BX.TRF.PWKR.CD.DT; latest available source year; current US$; ranked descending. |
| 3 | Philippines | US$40.28 bn | Official World Bank value; WDI BX.TRF.PWKR.CD.DT; latest available source year; current US$; ranked descending. |
| 4 | France | US$36.86 bn | Official World Bank value; WDI BX.TRF.PWKR.CD.DT; latest available source year; current US$; ranked descending. |
| 5 | Pakistan | US$34.91 bn | Official World Bank value; WDI BX.TRF.PWKR.CD.DT; latest available source year; current US$; ranked descending. |
| 6 | China | US$31.41 bn | Official World Bank value; WDI BX.TRF.PWKR.CD.DT; latest available source year; current US$; ranked descending. |
| 7 | Bangladesh | US$30.00 bn | Official World Bank value; WDI BX.TRF.PWKR.CD.DT; latest available source year; current US$; ranked descending. |
| 8 | Guatemala | US$21.65 bn | Official World Bank value; WDI BX.TRF.PWKR.CD.DT; latest available source year; current US$; ranked descending. |
| 9 | Nigeria | US$21.29 bn | Official World Bank value; WDI BX.TRF.PWKR.CD.DT; latest available source year; current US$; ranked descending. |
| 10 | Germany | US$21.23 bn | Official World Bank value; WDI BX.TRF.PWKR.CD.DT; latest available source year; current US$; ranked descending. |
Values are rounded to two decimals in billions. The ranking is by absolute inflow, not by share of GDP or per-capita dependence.
France and Germany appear in the Top 10 because the World Bank measure includes both personal transfers and compensation of employees, including cross-border worker income. The ranking is therefore broader than a narrow “migrants sending cash home” view of remittances.
Chart: Top 20 remittance inflow economies
The largest recipient, India, is far ahead of the rest of the table. Mexico is the second-largest recipient, while the next cluster is led by the Philippines, France, Pakistan, China and Bangladesh.
Methodology
The ranking uses the World Bank World Development Indicators series BX.TRF.PWKR.CD.DT — Personal remittances, received (current US$). The indicator combines personal transfers and compensation of employees under the IMF Balance of Payments Manual framework. The values are current U.S. dollars and are displayed here in billions.
The target page is a 2026 snapshot, but the values are latest available source observations rather than 2026 forecasts. Most high-ranking rows use 2024 source values; older latest-available rows are retained only when they are part of the confirmed source table and are marked in the row note when the year differs materially.
Audit note: rows were included only when a country or economy had a confirmed World Bank WDI value for BX.TRF.PWKR.CD.DT. World, regional aggregates, income groups and blank-value rows were excluded. Where the latest available year is older than 2024, the row keeps that source year in the ranking table.
Values are sorted in descending order by current U.S. dollar inflow. Display values are rounded to two decimals in billions; the ranking order follows the underlying value before display rounding. Regional labels are used only for filtering and do not replace official World Bank country classifications.
The metric does not measure remittance dependence, transfer costs, diaspora size, poverty reduction, informal channels, investment remittances or household distribution. It should be read together with GDP share, population, migration-stock data and transfer-cost indicators when the analytical question is vulnerability or household welfare rather than aggregate inflow size.
Full ranking: Top 100 countries by personal remittances received
Use the controls to compare countries by region, row status and value. The fixed rank is based on the latest available value in current U.S. dollars.
| Rank | Country | Value | Source / Method Note |
|---|---|---|---|
| 1 | India | US$137.68 bn | Official World Bank value; source year 2024; current US$; Asia. |
| 2 | Mexico | US$67.64 bn | Official World Bank value; source year 2024; current US$; Americas. |
| 3 | Philippines | US$40.28 bn | Official World Bank value; source year 2024; current US$; Asia. |
| 4 | France | US$36.86 bn | Official World Bank value; source year 2024; current US$; Europe. |
| 5 | Pakistan | US$34.91 bn | Official World Bank value; source year 2024; current US$; Asia. |
| 6 | China | US$31.41 bn | Official World Bank value; source year 2024; current US$; Asia. |
| 7 | Bangladesh | US$30.00 bn | Official World Bank value; source year 2024; current US$; Asia. |
| 8 | Guatemala | US$21.65 bn | Official World Bank value; source year 2024; current US$; Americas. |
| 9 | Nigeria | US$21.29 bn | Official World Bank value; source year 2024; current US$; Africa. |
| 10 | Germany | US$21.23 bn | Official World Bank value; source year 2024; current US$; Europe. |
| 11 | Egypt | US$19.53 bn | Official World Bank value; source year 2024; current US$; Middle East & North Africa. |
| 12 | Uzbekistan | US$16.58 bn | Official World Bank value; source year 2024; current US$; Asia. |
| 13 | Indonesia | US$16.04 bn | Official World Bank value; source year 2024; current US$; Asia. |
| 14 | Belgium | US$15.21 bn | Official World Bank value; source year 2024; current US$; Europe. |
| 15 | Nepal | US$14.19 bn | Official World Bank value; source year 2024; current US$; Asia. |
| 16 | Vietnam | US$14.00 bn | Official World Bank value; source year 2024; current US$; Asia. |
| 17 | Ukraine | US$11.97 bn | Official World Bank value; source year 2024; current US$; Europe. |
| 18 | Colombia | US$11.87 bn | Official World Bank value; source year 2024; current US$; Americas. |
| 19 | Morocco | US$11.76 bn | Official World Bank value; source year 2024; current US$; Middle East & North Africa. |
| 20 | Dominican Republic | US$11.25 bn | Official World Bank value; source year 2024; current US$; Americas. |
| 21 | Italy | US$11.15 bn | Official World Bank value; source year 2024; current US$; Europe. |
| 22 | Thailand | US$9.58 bn | Official World Bank value; source year 2024; current US$; Asia. |
| 23 | Honduras | US$9.53 bn | Official World Bank value; source year 2024; current US$; Americas. |
| 24 | Romania | US$9.52 bn | Official World Bank value; source year 2024; current US$; Europe. |
| 25 | Poland | US$8.69 bn | Official World Bank value; source year 2024; current US$; Europe. |
| 26 | El Salvador | US$8.49 bn | Official World Bank value; source year 2024; current US$; Americas. |
| 27 | United States | US$7.87 bn | Official World Bank value; source year 2024; current US$; Americas. |
| 28 | South Korea | US$7.45 bn | Official World Bank value; source year 2024; current US$; Asia. |
| 29 | Tajikistan | US$6.80 bn | Official World Bank value; source year 2024; current US$; Asia. |
| 30 | Croatia | US$6.74 bn | Official World Bank value; source year 2024; current US$; Europe. |
| 31 | Lebanon | US$6.70 bn | Official World Bank value; source year 2024; current US$; Middle East & North Africa. |
| 32 | Ecuador | US$6.54 bn | Official World Bank value; source year 2024; current US$; Americas. |
| 33 | Spain | US$6.27 bn | Official World Bank value; source year 2024; current US$; Europe. |
| 34 | Sri Lanka | US$6.02 bn | Official World Bank value; source year 2024; current US$; Asia. |
| 35 | Serbia | US$5.77 bn | Official World Bank value; source year 2024; current US$; Europe. |
| 36 | Nicaragua | US$5.25 bn | Official World Bank value; source year 2024; current US$; Americas. |
| 37 | Hungary | US$5.24 bn | Official World Bank value; source year 2024; current US$; Europe. |
| 38 | Brazil | US$4.90 bn | Official World Bank value; source year 2024; current US$; Americas. |
| 39 | United Kingdom | US$4.83 bn | Official World Bank value; source year 2024; current US$; Europe. |
| 40 | Sweden | US$4.70 bn | Official World Bank value; source year 2024; current US$; Europe. |
| 41 | Japan | US$4.64 bn | Official World Bank value; source year 2024; current US$; Asia. |
| 42 | Jordan | US$4.48 bn | Official World Bank value; source year 2024; current US$; Middle East & North Africa. |
| 43 | Peru | US$4.45 bn | Official World Bank value; source year 2024; current US$; Americas. |
| 44 | Netherlands | US$4.36 bn | Official World Bank value; source year 2024; current US$; Europe. |
| 45 | Czechia | US$4.25 bn | Official World Bank value; source year 2024; current US$; Europe. |
| 46 | Kenya | US$4.23 bn | Official World Bank value; source year 2024; current US$; Africa. |
| 47 | Georgia | US$4.00 bn | Official World Bank value; source year 2024; current US$; Asia. |
| 48 | Yemen | US$3.77 bn | Official World Bank value; latest available source year 2018; current US$; Middle East & North Africa. |
| 49 | Haiti | US$3.75 bn | Official World Bank value; source year 2024; current US$; Americas. |
| 50 | Austria | US$3.59 bn | Official World Bank value; source year 2024; current US$; Europe. |
| 51 | Jamaica | US$3.56 bn | Official World Bank value; source year 2024; current US$; Americas. |
| 52 | Switzerland | US$3.50 bn | Official World Bank value; source year 2024; current US$; Europe. |
| 53 | Zimbabwe | US$3.30 bn | Official World Bank value; source year 2024; current US$; Africa. |
| 54 | Democratic Republic of the Congo | US$3.30 bn | Official World Bank value; source year 2024; current US$; Africa. |
| 55 | Senegal | US$3.27 bn | Official World Bank value; source year 2024; current US$; Africa. |
| 56 | Bosnia and Herzegovina | US$3.12 bn | Official World Bank value; source year 2024; current US$; Europe. |
| 57 | Tunisia | US$2.87 bn | Official World Bank value; source year 2024; current US$; Middle East & North Africa. |
| 58 | Kyrgyzstan | US$2.85 bn | Official World Bank value; source year 2024; current US$; Asia. |
| 59 | Cambodia | US$2.83 bn | Official World Bank value; source year 2024; current US$; Asia. |
| 60 | Slovakia | US$2.74 bn | Official World Bank value; source year 2024; current US$; Europe. |
| 61 | Bulgaria | US$2.67 bn | Official World Bank value; source year 2024; current US$; Europe. |
| 62 | Ghana | US$2.43 bn | Official World Bank value; source year 2024; current US$; Africa. |
| 63 | Luxembourg | US$2.43 bn | Official World Bank value; source year 2024; current US$; Europe. |
| 64 | Albania | US$2.27 bn | Official World Bank value; source year 2024; current US$; Europe. |
| 65 | Bermuda | US$2.04 bn | Official World Bank value; latest available source year 2023; current US$; Americas. |
| 66 | Moldova | US$1.92 bn | Official World Bank value; source year 2024; current US$; Europe. |
| 67 | Russia | US$1.91 bn | Official World Bank value; source year 2024; current US$; Europe. |
| 68 | Australia | US$1.88 bn | Official World Bank value; source year 2024; current US$; Oceania. |
| 69 | Algeria | US$1.87 bn | Official World Bank value; source year 2024; current US$; Middle East & North Africa. |
| 70 | Kosovo | US$1.83 bn | Official World Bank value; source year 2024; current US$; Europe. |
| 71 | Portugal | US$1.81 bn | Official World Bank value; source year 2024; current US$; Europe. |
| 72 | Somalia | US$1.74 bn | Official World Bank value; source year 2024; current US$; Africa. |
| 73 | Malaysia | US$1.61 bn | Official World Bank value; source year 2024; current US$; Asia. |
| 74 | Denmark | US$1.53 bn | Official World Bank value; source year 2024; current US$; Europe. |
| 75 | Bolivia | US$1.45 bn | Official World Bank value; source year 2024; current US$; Americas. |
| 76 | Qatar | US$1.44 bn | Official World Bank value; source year 2024; current US$; Middle East & North Africa. |
| 77 | Uganda | US$1.43 bn | Official World Bank value; source year 2024; current US$; Africa. |
| 78 | Belarus | US$1.38 bn | Official World Bank value; source year 2024; current US$; Europe. |
| 79 | Azerbaijan | US$1.35 bn | Official World Bank value; source year 2024; current US$; Asia. |
| 80 | Latvia | US$1.34 bn | Official World Bank value; source year 2024; current US$; Europe. |
| 81 | Armenia | US$1.18 bn | Official World Bank value; source year 2024; current US$; Asia. |
| 82 | South Sudan | US$1.18 bn | Official World Bank value; latest available source year 2015; current US$; Africa. |
| 83 | Iraq | US$1.16 bn | Official World Bank value; source year 2024; current US$; Middle East & North Africa. |
| 84 | Myanmar | US$1.10 bn | Official World Bank value; source year 2024; current US$; Asia. |
| 85 | Lithuania | US$1.05 bn | Official World Bank value; source year 2024; current US$; Europe. |
| 86 | Mali | US$1.05 bn | Official World Bank value; source year 2024; current US$; Africa. |
| 87 | Argentina | US$1.05 bn | Official World Bank value; source year 2024; current US$; Americas. |
| 88 | Côte d’Ivoire | US$1.04 bn | Official World Bank value; source year 2024; current US$; Africa. |
| 89 | Sudan | US$1.00 bn | Official World Bank value; source year 2024; current US$; Africa. |
| 90 | Türkiye | US$0.98 bn | Official World Bank value; source year 2024; current US$; Europe / Asia note. |
| 91 | Israel | US$0.95 bn | Official World Bank value; source year 2024; current US$; Middle East & North Africa. |
| 92 | Paraguay | US$0.88 bn | Official World Bank value; source year 2024; current US$; Americas. |
| 93 | South Africa | US$0.86 bn | Official World Bank value; source year 2024; current US$; Africa. |
| 94 | Montenegro | US$0.86 bn | Official World Bank value; source year 2024; current US$; Europe. |
| 95 | Slovenia | US$0.85 bn | Official World Bank value; source year 2024; current US$; Europe. |
| 96 | Canada | US$0.85 bn | Official World Bank value; source year 2024; current US$; Americas. |
| 97 | New Zealand | US$0.82 bn | Official World Bank value; source year 2024; current US$; Oceania. |
| 98 | Liberia | US$0.80 bn | Official World Bank value; source year 2024; current US$; Africa. |
| 99 | Cameroon | US$0.79 bn | Official World Bank value; source year 2024; current US$; Africa. |
| 100 | Tanzania | US$0.76 bn | Official World Bank value; source year 2024; current US$; Africa. |
Table note: values are rounded to two decimals in billions from a latest-available World Bank WDI remittance dataset. Rows are sorted by absolute value in descending order. Regional group labels are analytical labels for filtering and do not replace World Bank country classifications.
Insights from the ranking
Key Insight
India is the clear outlier by absolute inflow, with more than twice Mexico’s recorded value and more than three times the Philippines’ value.
Notable Pattern
Asia dominates the upper part of the table through India, the Philippines, Pakistan, China, Bangladesh, Nepal, Vietnam and Indonesia.
Regional Concentration
The Americas are led by Mexico, Guatemala, Colombia, the Dominican Republic, Honduras and El Salvador, reflecting large migration corridors to North America.
Outlier
France and Germany rank very high in absolute receipts despite being high-income destination economies, showing that remittance receipts are not limited to lower-income countries.
The top of the table is shaped by population scale, migration history and destination-country labor markets. Large countries with broad diasporas can post very high dollar totals even if remittances represent a modest share of GDP. Smaller economies such as Tajikistan, Lebanon, Honduras, El Salvador and Jamaica are less dominant in dollar terms but can be far more exposed to remittance cycles.
The middle of the ranking contains a mix of European countries, Latin American economies, African recipients and smaller diaspora-linked markets. This diversity is important: a remittance inflow can represent family support, short-term worker compensation, cross-border labor income or long-established household transfers depending on the country.
What it means for readers
For households, remittances can support food, housing, health care, education, debt repayment and small business activity. For governments, large inflows can strengthen foreign-exchange supply and household consumption, but they can also create vulnerability if labor-market conditions tighten in migrant destination countries.
For analysts, this ranking should be read as a scale measure. It answers “where is the largest inflow recorded?” rather than “which economy depends most on remittances?” A country ranked lower by dollars can still be more structurally dependent if remittances account for a large share of GDP or household income.
For businesses and payment providers, the table points to large corridors and high-volume receiving markets. The next analytical layer should compare transfer costs, exchange-rate margins, payout infrastructure, digital access and regulatory requirements across corridors.
Download the Top 100 Countries by Personal Remittances Received in 2026 dataset
Top 100 Countries by Personal Remittances Received in 2026
100 ranked entries · Excel + CSV + methodology + sources + chart · Snapshot: 2024 WDI remittances / 2026 snapshot · Version 1.0
No signup required. The archive includes machine-readable data, methodology and source documentation. Quick human verification is required before the ZIP is delivered.
Download Excel + CSV Data PackFAQ
Which country receives the most remittances in this 2026 snapshot?
India ranks first by absolute remittance inflow, with a displayed value of US$137.68 billion in the compiled latest-available World Bank dataset.
Is this ranking an official World Bank ranking for 2026?
No. It is a 2026 snapshot page built from the latest available World Bank WDI values. It is not a World Bank 2026 forecast and it is not an official World Bank editorial ranking.
Why are the values shown in current U.S. dollars?
The World Bank indicator is published in current U.S. dollars. That makes the values comparable as nominal cross-country inflow amounts, but it does not remove inflation or exchange-rate effects over time.
Do remittances mean the same thing as migrant population?
No. A country can have a large diaspora but lower recorded remittances if migrants earn less, send less, use informal channels, or support families through non-cash means. The indicator measures recorded money flows, not total migrant stock.
Why can a high-income country appear in the recipient ranking?
High-income countries also receive personal transfers and employee compensation from abroad. Large economies with many cross-border workers, expatriate links or resident households receiving foreign income can still show substantial receipts.
What does this ranking not show?
It does not show remittances as a share of GDP, transfer costs, informal transfers, household distribution, sender-country corridors, poverty impact, or whether the money is used for consumption, education, housing or investment.
Sources
World Bank Open Data — Personal remittances, received (current US$)
Main official indicator source for values, indicator name, source organization and time coverage. Used for the ranking metric and source status.
https://data.worldbank.org/indicator/BX.TRF.PWKR.CD.DTWorld Bank DataBank metadata glossary — BX.TRF.PWKR.CD.DT
Used for the indicator definition: personal remittances comprise personal transfers and compensation of employees.
https://databank.worldbank.org/metadataglossary/world-development-indicators/series/BX.TRF.PWKR.CD.DTIOM World Migration Report 2026 — International remittances
Used for context on international remittances and the note that latest data tables are updated using World Bank DataBank.
https://worldmigrationreport.iom.int/what-we-do/world-migration-report-2026/chapter-2/international-remittancesRelated rankings
More StatRanker rankings on population structure, growth and demographic change.
