

Top 100 Countries by Crime Index in 2026
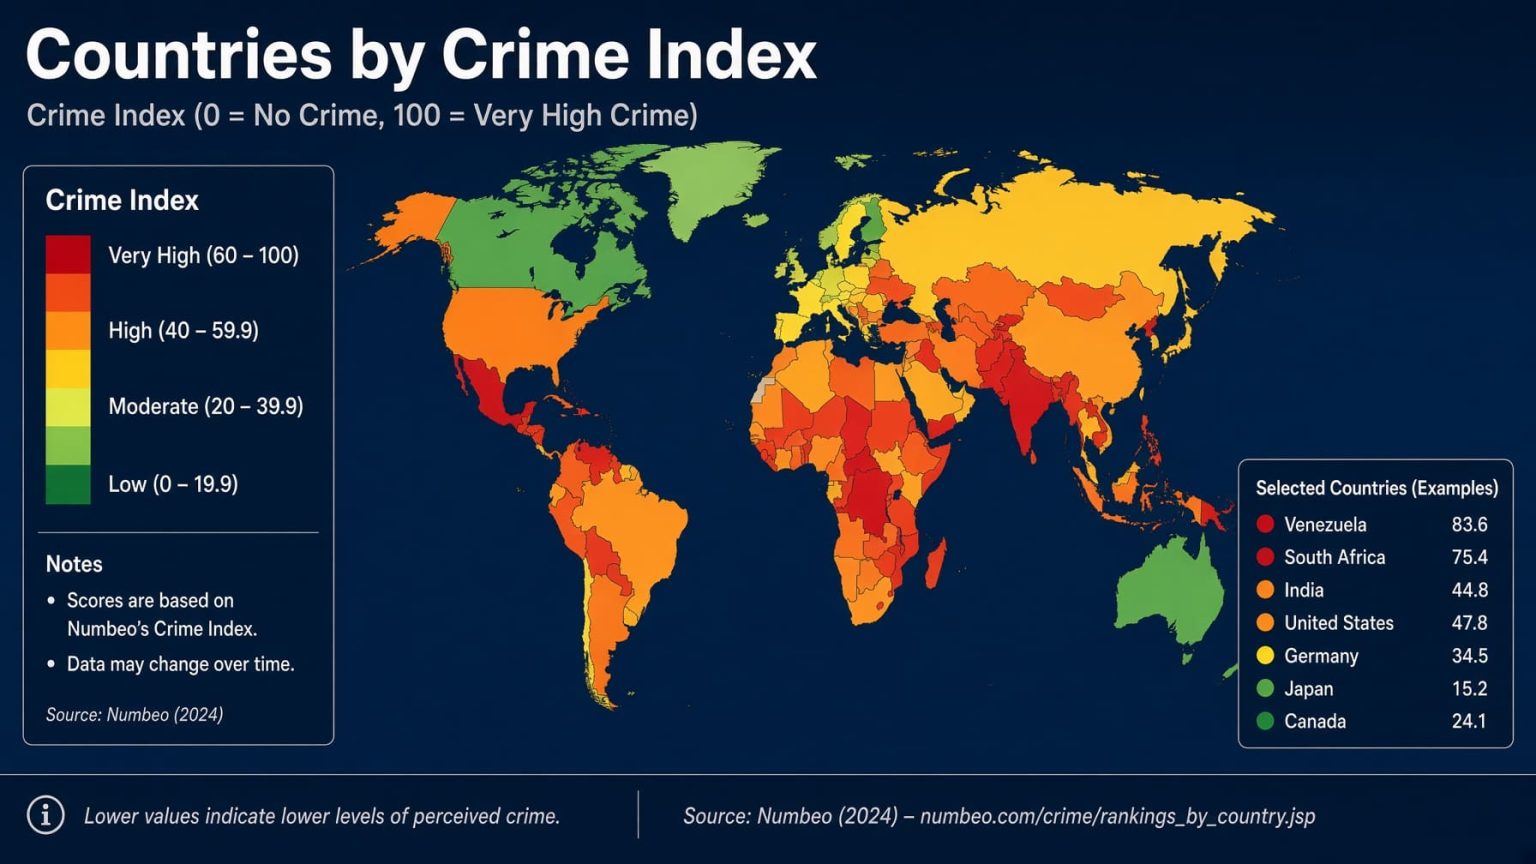
Crime Index by Country: 2026 Mid-Year Ranking Snapshot
Papua New Guinea has the highest Crime Index in this Top 100 at 80.8, followed by Venezuela at 80.5 and Haiti at 79.8. The ranking uses Numbeo's 2026 Mid-Year Crime Index, a 0–100 survey-based perception measure in which a higher score indicates a higher perceived level of crime.
The metric should not be read as an official crime rate. It does not measure police-recorded offenses per 100,000 people, homicide rates or a standardized international victimization rate. All 100 ranking values are published Numbeo observations and are classified on this page as industry observed values.
The table is a compiled research dataset based on 4 sources, with row-level source and method notes shown in the ranking table. Crime Index values and source order come from the fixed Numbeo 2026 Mid-Year snapshot. United Nations M49 supports broad regional grouping, while Numbeo methodology and UNODC provide methodological context; they are not additional numeric sources for the ranking.
Coverage: 100 confirmed entries from the higher-score end of Numbeo's 2026 Mid-Year table. Unit: Crime Index points, 0–100. Direction: higher score ranks higher. Status: 100 industry observed values; 0 official values; 0 calculated values; 0 official forecasts; 0 modeled projections.
Papua New Guinea ranks first in the 2026 Mid-Year snapshot.
Thailand is rank 100. The full Numbeo table continues with lower scores, so 36.4 is not the global minimum.
Countries, territories and other source-listed entities included in this ranking.
All 100 rows are industry observed values from Numbeo's survey-based Crime Index.
Important: “Crime Index” and “crime rate” are not interchangeable. This page ranks perceived crime conditions under Numbeo's methodology, not official crimes per capita.
What the Numbeo Crime Index measures
Numbeo builds its Crime Index from survey responses submitted by website visitors. Questions cover perceptions of overall crime, whether crime is increasing, daytime and nighttime safety, worries about robbery, car theft and assault, property crime, violent crime, drugs, harassment and corruption or bribery.
Survey results are scaled to a 0–100 index. Numbeo describes scores above 80 as very high, 60.01–80 as high, 40.01–60 as moderate, 20.01–40 as low and 20 or below as very low.
The 2026 Mid-Year label identifies a semiannual historical snapshot. It does not mean every underlying survey response was submitted during 2026. Numbeo states that its current index uses recent survey data and that semiannual historical indices incorporate the latest available responses into periodic snapshots.
Because this is perception data, differences in participation, respondent mix, local expectations, reporting culture and sample size can affect comparisons. The country ranking page does not display a contributor count for every row, so identical decimal precision should not be interpreted as identical sampling precision across all entries.
Top 10 highest Crime Index scores
The ten highest scores range from 80.8 to 67.4. Papua New Guinea and Venezuela are the only entries in this Top 100 above 80, while Haiti is close behind at 79.8.
Top 10 entries by Numbeo Crime Index, 2026 Mid-Year
| Rank | Entity | Crime Index | Source / Method Note |
|---|---|---|---|
| 1 | Papua New Guinea | 80.8 | Industry observed value · Numbeo 2026 Mid-Year · Oceania. |
| 2 | Venezuela | 80.5 | Industry observed value · Numbeo 2026 Mid-Year · Americas. |
| 3 | Haiti | 79.8 | Industry observed value · Numbeo 2026 Mid-Year · Americas. |
| 4 | Afghanistan | 74.7 | Industry observed value · Numbeo 2026 Mid-Year · Asia. |
| 5 | South Africa | 74.5 | Industry observed value · Numbeo 2026 Mid-Year · Africa. |
| 6 | Honduras | 71.9 | Industry observed value · Numbeo 2026 Mid-Year · Americas. |
| 7 | Trinidad And Tobago | 71.1 | Industry observed value · Numbeo 2026 Mid-Year · Americas. |
| 8 | Syria | 68.1 | Industry observed value · Numbeo 2026 Mid-Year · Asia. |
| 9 | Jamaica | 67.4 | Industry observed value · Numbeo 2026 Mid-Year · Americas. |
| 10 | Guyana | 67.4 | Industry observed value · Numbeo 2026 Mid-Year · Americas. |
Ranking uses the published Crime Index value in descending order. When displayed values are equal, the source-table order is retained rather than applying an undocumented tie-break rule.
Chart: Top 20 Crime Index scores
The chart uses the same raw values as the ranking table. Bar length shows relative Crime Index score within this Top 20 and should not be interpreted as probability of victimization.
Methodology
The ranking uses Numbeo's published Crime Index for the fixed 2026 Mid-Year historical snapshot. The source value is measured on a 0–100 scale and sorted from highest to lowest. StatRanker does not recalculate the index, combine it with police statistics or create a projected 2026 crime value.
Metric and unit
Metric: Numbeo Crime Index. Unit: index points from 0 to 100. Higher values indicate higher perceived crime under Numbeo's survey methodology.
Data status
All 100 numeric rows are industry observed values. They are published by Numbeo from user-contributed survey data and are not official government crime statistics.
Coverage
The page includes the first 100 entries in the 2026 Mid-Year source table. Numbeo's full table continues below rank 100, so the page is a Top 100 highest-score ranking rather than a complete global list.
Ranking and ties
Rows are ordered by raw Crime Index value descending. Where one-decimal values tie, the published Numbeo source order is preserved.
Regions
Broad filters use Africa, Americas, Asia, Europe and Oceania based on UN M49 geographic grouping where applicable. Region is a navigation aid and does not affect rank.
Missing values and conflicts
No missing score is imputed, no conflicting values are averaged and no row is replaced with data from another year or another crime metric.
Numbeo states that its crime data are derived from surveys answered by website visitors. Individual responses are converted to numerical values, suspicious submissions are filtered and results are scaled from 0 to 100. The semiannual historical index is updated twice a year as new data are incorporated.
The 2026 Mid-Year label therefore refers to the published snapshot, not to a standardized calendar-year crime count. Numbeo's current index uses recent survey responses over a multi-year window, while historical semiannual snapshots preserve specific published comparison points.
The country ranking does not display a contributor count beside every country or territory. That limits assessment of sampling precision at row level and is one reason the index should be interpreted as a perception indicator rather than a substitute for official crime-rate statistics.
Official homicide statistics answer a different question. An intentional homicide rate, for example, normally expresses homicide victims relative to population, typically per 100,000 people. That type of administrative or public-health measure should not be merged with Numbeo's perception score.
The metric does not directly measure homicide, police-recorded offenses, victimization prevalence, convictions, conflict exposure, organized crime or an individual's probability of becoming a crime victim.
Main ranking: Top 100 Crime Index entries
Search by entity, filter by broad region or data status, change sort order, or limit the view to the Top 10 or Top 20.
Top 100 entries by Numbeo Crime Index, 2026 Mid-Year
| Rank | Entity | Crime Index | Source / Method Note |
|---|---|---|---|
| 1 | Papua New Guinea | 80.8 | Industry observed value · Numbeo 2026 Mid-Year · Oceania. |
| 2 | Venezuela | 80.5 | Industry observed value · Numbeo 2026 Mid-Year · Americas. |
| 3 | Haiti | 79.8 | Industry observed value · Numbeo 2026 Mid-Year · Americas. |
| 4 | Afghanistan | 74.7 | Industry observed value · Numbeo 2026 Mid-Year · Asia. |
| 5 | South Africa | 74.5 | Industry observed value · Numbeo 2026 Mid-Year · Africa. |
| 6 | Honduras | 71.9 | Industry observed value · Numbeo 2026 Mid-Year · Americas. |
| 7 | Trinidad And Tobago | 71.1 | Industry observed value · Numbeo 2026 Mid-Year · Americas. |
| 8 | Syria | 68.1 | Industry observed value · Numbeo 2026 Mid-Year · Asia. |
| 9 | Jamaica | 67.4 | Industry observed value · Numbeo 2026 Mid-Year · Americas. |
| 10 | Guyana | 67.4 | Industry observed value · Numbeo 2026 Mid-Year · Americas. |
| 11 | Peru | 66.9 | Industry observed value · Numbeo 2026 Mid-Year · Americas. |
| 12 | Nigeria | 66.6 | Industry observed value · Numbeo 2026 Mid-Year · Africa. |
| 13 | Angola | 65.4 | Industry observed value · Numbeo 2026 Mid-Year · Africa. |
| 14 | Cameroon | 64.8 | Industry observed value · Numbeo 2026 Mid-Year · Africa. |
| 15 | Bolivia | 64.2 | Industry observed value · Numbeo 2026 Mid-Year · Americas. |
| 16 | Brazil | 63.6 | Industry observed value · Numbeo 2026 Mid-Year · Americas. |
| 17 | Namibia | 63.6 | Industry observed value · Numbeo 2026 Mid-Year · Africa. |
| 18 | Argentina | 63.0 | Industry observed value · Numbeo 2026 Mid-Year · Americas. |
| 19 | Somalia | 62.1 | Industry observed value · Numbeo 2026 Mid-Year · Africa. |
| 20 | Ecuador | 61.7 | Industry observed value · Numbeo 2026 Mid-Year · Americas. |
| 21 | Puerto Rico | 61.3 | Industry observed value · Numbeo 2026 Mid-Year · Americas. |
| 22 | Colombia | 61.3 | Industry observed value · Numbeo 2026 Mid-Year · Americas. |
| 23 | Zimbabwe | 61.2 | Industry observed value · Numbeo 2026 Mid-Year · Africa. |
| 24 | Mozambique | 61.0 | Industry observed value · Numbeo 2026 Mid-Year · Africa. |
| 25 | Yemen | 60.8 | Industry observed value · Numbeo 2026 Mid-Year · Asia. |
| 26 | Bangladesh | 60.7 | Industry observed value · Numbeo 2026 Mid-Year · Asia. |
| 27 | Chile | 60.6 | Industry observed value · Numbeo 2026 Mid-Year · Americas. |
| 28 | Dominican Republic | 59.6 | Industry observed value · Numbeo 2026 Mid-Year · Americas. |
| 29 | US Virgin Islands | 59.2 | Industry observed value · Numbeo 2026 Mid-Year · Americas. |
| 30 | Paraguay | 58.3 | Industry observed value · Numbeo 2026 Mid-Year · Americas. |
| 31 | Fiji | 57.1 | Industry observed value · Numbeo 2026 Mid-Year · Oceania. |
| 32 | Bahamas | 56.6 | Industry observed value · Numbeo 2026 Mid-Year · Americas. |
| 33 | Guatemala | 56.2 | Industry observed value · Numbeo 2026 Mid-Year · Americas. |
| 34 | Libya | 55.9 | Industry observed value · Numbeo 2026 Mid-Year · Africa. |
| 35 | France | 55.8 | Industry observed value · Numbeo 2026 Mid-Year · Europe. |
| 36 | Ivory Coast | 55.7 | Industry observed value · Numbeo 2026 Mid-Year · Africa. |
| 37 | El Salvador | 55.5 | Industry observed value · Numbeo 2026 Mid-Year · Americas. |
| 38 | Kenya | 55.2 | Industry observed value · Numbeo 2026 Mid-Year · Africa. |
| 39 | Costa Rica | 54.2 | Industry observed value · Numbeo 2026 Mid-Year · Americas. |
| 40 | Uganda | 54.1 | Industry observed value · Numbeo 2026 Mid-Year · Africa. |
| 41 | Tanzania | 53.5 | Industry observed value · Numbeo 2026 Mid-Year · Africa. |
| 42 | Algeria | 52.8 | Industry observed value · Numbeo 2026 Mid-Year · Africa. |
| 43 | Uruguay | 52.7 | Industry observed value · Numbeo 2026 Mid-Year · Americas. |
| 44 | Mexico | 52.7 | Industry observed value · Numbeo 2026 Mid-Year · Americas. |
| 45 | Maldives | 52.4 | Industry observed value · Numbeo 2026 Mid-Year · Asia. |
| 46 | Belize | 51.8 | Industry observed value · Numbeo 2026 Mid-Year · Americas. |
| 47 | Myanmar | 51.5 | Industry observed value · Numbeo 2026 Mid-Year · Asia. |
| 48 | Mongolia | 51.2 | Industry observed value · Numbeo 2026 Mid-Year · Asia. |
| 49 | Botswana | 51.1 | Industry observed value · Numbeo 2026 Mid-Year · Africa. |
| 50 | Nicaragua | 50.8 | Industry observed value · Numbeo 2026 Mid-Year · Americas. |
| 51 | Iran | 50.7 | Industry observed value · Numbeo 2026 Mid-Year · Asia. |
| 52 | Ethiopia | 50.3 | Industry observed value · Numbeo 2026 Mid-Year · Africa. |
| 53 | Belgium | 49.5 | Industry observed value · Numbeo 2026 Mid-Year · Europe. |
| 54 | Kyrgyzstan | 49.5 | Industry observed value · Numbeo 2026 Mid-Year · Asia. |
| 55 | Mauritius | 49.3 | Industry observed value · Numbeo 2026 Mid-Year · Africa. |
| 56 | United States | 49.2 | Industry observed value · Numbeo 2026 Mid-Year · Americas. |
| 57 | Ireland | 49.1 | Industry observed value · Numbeo 2026 Mid-Year · Europe. |
| 58 | New Zealand | 48.8 | Industry observed value · Numbeo 2026 Mid-Year · Oceania. |
| 59 | Cambodia | 48.8 | Industry observed value · Numbeo 2026 Mid-Year · Asia. |
| 60 | United Kingdom | 48.2 | Industry observed value · Numbeo 2026 Mid-Year · Europe. |
| 61 | Malaysia | 48.0 | Industry observed value · Numbeo 2026 Mid-Year · Asia. |
| 62 | Belarus | 47.8 | Industry observed value · Numbeo 2026 Mid-Year · Europe. |
| 63 | Sweden | 47.8 | Industry observed value · Numbeo 2026 Mid-Year · Europe. |
| 64 | Australia | 47.4 | Industry observed value · Numbeo 2026 Mid-Year · Oceania. |
| 65 | Italy | 47.4 | Industry observed value · Numbeo 2026 Mid-Year · Europe. |
| 66 | Zambia | 47.1 | Industry observed value · Numbeo 2026 Mid-Year · Africa. |
| 67 | Morocco | 47.1 | Industry observed value · Numbeo 2026 Mid-Year · Africa. |
| 68 | Ukraine | 46.9 | Industry observed value · Numbeo 2026 Mid-Year · Europe. |
| 69 | Lebanon | 46.8 | Industry observed value · Numbeo 2026 Mid-Year · Asia. |
| 70 | Indonesia | 46.2 | Industry observed value · Numbeo 2026 Mid-Year · Asia. |
| 71 | Egypt | 46.0 | Industry observed value · Numbeo 2026 Mid-Year · Africa. |
| 72 | Greece | 46.0 | Industry observed value · Numbeo 2026 Mid-Year · Europe. |
| 73 | Canada | 45.6 | Industry observed value · Numbeo 2026 Mid-Year · Americas. |
| 74 | Sudan | 45.6 | Industry observed value · Numbeo 2026 Mid-Year · Africa. |
| 75 | Kazakhstan | 45.2 | Industry observed value · Numbeo 2026 Mid-Year · Asia. |
| 76 | Barbados | 44.7 | Industry observed value · Numbeo 2026 Mid-Year · Americas. |
| 77 | Moldova | 44.6 | Industry observed value · Numbeo 2026 Mid-Year · Europe. |
| 78 | Tunisia | 44.5 | Industry observed value · Numbeo 2026 Mid-Year · Africa. |
| 79 | Albania | 44.3 | Industry observed value · Numbeo 2026 Mid-Year · Europe. |
| 80 | India | 44.2 | Industry observed value · Numbeo 2026 Mid-Year · Asia. |
| 81 | Palestine | 44.1 | Industry observed value · Numbeo 2026 Mid-Year · Asia. |
| 82 | Philippines | 43.4 | Industry observed value · Numbeo 2026 Mid-Year · Asia. |
| 83 | Ghana | 43.2 | Industry observed value · Numbeo 2026 Mid-Year · Africa. |
| 84 | Malta | 43.0 | Industry observed value · Numbeo 2026 Mid-Year · Europe. |
| 85 | Sri Lanka | 42.5 | Industry observed value · Numbeo 2026 Mid-Year · Asia. |
| 86 | Panama | 42.4 | Industry observed value · Numbeo 2026 Mid-Year · Americas. |
| 87 | Pakistan | 42.2 | Industry observed value · Numbeo 2026 Mid-Year · Asia. |
| 88 | Turkey | 41.5 | Industry observed value · Numbeo 2026 Mid-Year · Asia. |
| 89 | Kosovo (Disputed Territory) | 41.2 | Industry observed value · Numbeo 2026 Mid-Year · Europe filter; source label retained. |
| 90 | North Macedonia | 41.1 | Industry observed value · Numbeo 2026 Mid-Year · Europe. |
| 91 | Bosnia And Herzegovina | 40.7 | Industry observed value · Numbeo 2026 Mid-Year · Europe. |
| 92 | Vietnam | 39.8 | Industry observed value · Numbeo 2026 Mid-Year · Asia. |
| 93 | Jordan | 39.6 | Industry observed value · Numbeo 2026 Mid-Year · Asia. |
| 94 | Iraq | 39.5 | Industry observed value · Numbeo 2026 Mid-Year · Asia. |
| 95 | Germany | 39.0 | Industry observed value · Numbeo 2026 Mid-Year · Europe. |
| 96 | North Korea | 38.6 | Industry observed value · Numbeo 2026 Mid-Year · Asia. |
| 97 | Spain | 38.1 | Industry observed value · Numbeo 2026 Mid-Year · Europe. |
| 98 | Russia | 38.1 | Industry observed value · Numbeo 2026 Mid-Year · Europe. |
| 99 | Serbia | 36.9 | Industry observed value · Numbeo 2026 Mid-Year · Europe. |
| 100 | Thailand | 36.4 | Industry observed value · Numbeo 2026 Mid-Year · Asia. |
Ranking values come from the fixed Numbeo 2026 Mid-Year historical snapshot. Regional labels are supporting classifications and do not alter the source value or rank. Thailand is the 100th entry on this page; the Numbeo source table continues below it.
What stands out in the Top 100
Key Insight
The included scores span 44.4 points, from 80.8 for Papua New Guinea to 36.4 for Thailand. That spread describes perceived crime within this selected Top 100, not a difference in official crime incidence.
Score bands
Using Numbeo's published interpretation bands, this Top 100 contains 2 very-high scores, 25 high scores, 64 moderate scores and 9 low scores.
Regional concentration
The regional filter contains 29 entries from the Americas, 25 from Asia, 23 from Africa, 19 from Europe and 4 from Oceania. The Americas also account for 11 of the Top 20.
Top-end clustering
The first three entries are close together: Papua New Guinea scores 80.8, Venezuela 80.5 and Haiti 79.8. There is then a larger drop to Afghanistan at 74.7.
How to interpret this ranking
This table is useful for comparing perceived crime and safety conditions across countries and territories under one consistent Numbeo methodology. A higher score means respondents produced a higher Crime Index; it does not establish that the same place has the world's highest official crime rate.
For harder comparisons of lethal violence, an intentional homicide rate per 100,000 people is a different and narrower metric based on victims relative to population. StatRanker's separate homicide rate by country ranking should therefore be read independently rather than merged with this perception index.
Readers looking specifically for low perceived urban crime should also distinguish country-level data from city-level data. StatRanker's 2026 safest cities comparison uses city-level safety data and answers a different geographic question.
The main interpretation risk is treating a broad perception index as if it were an administrative crime count. Both can be useful, but they measure different things and can move differently.
FAQ
Which country has the highest Crime Index in the 2026 Mid-Year ranking?
Papua New Guinea is first in this Top 100 with a Crime Index of 80.8, followed by Venezuela at 80.5 and Haiti at 79.8.
Is the Numbeo Crime Index an official crime rate?
No. It is a survey-based perception index on a 0–100 scale. Official crime rates typically use recorded crimes, victims or another defined event count relative to population.
What does a higher Crime Index mean?
A higher score indicates a higher perceived level of crime under Numbeo's survey methodology. This page therefore ranks higher scores first.
Does 2026 Mid-Year mean all survey responses were collected in 2026?
No. The label identifies Numbeo's published semiannual historical snapshot. It should not be interpreted as a calendar-year official crime dataset.
Is Thailand the safest country because it ranks 100th here?
No. Thailand is simply the 100th entry in this Top 100 highest-score table. The full Numbeo 2026 Mid-Year table continues with lower Crime Index values.
Can this be called a ranking of the most dangerous countries?
Only with a clear qualifier that it is based on Numbeo's Crime Index. “Most dangerous” is broader than this metric and can also involve homicide, conflict, organized crime, road safety, terrorism, local conditions and other risks.
How are tied Crime Index scores handled?
When published one-decimal scores are equal, this page preserves the order shown in the Numbeo source table instead of inventing an additional tie-break rule.
Why does the table include territories and disputed entities?
The source table includes countries as well as some territories and other named entities. This page preserves that coverage. Kosovo is retained with Numbeo's “Disputed Territory” label.
Why can Crime Index and official crime statistics disagree?
They measure different things. Crime Index reflects survey perceptions, while official statistics depend on legal definitions, reporting to authorities, recording practices, population denominators and the specific offense being measured.
Sources
Numbeo — Crime Index by Country 2026 Mid-Year
Primary numeric source for all Crime Index values and source-table order. The historical snapshot parameter fixes the ranking to 2026 Mid-Year.
https://www.numbeo.com/crime/rankings_by_country.jsp?title=2026-mid
Numbeo — Understanding Crime Indexes
Methodology source for survey inputs, spam filtering, 0–100 scaling, interpretation bands and semiannual index construction.
United Nations Statistics Division — M49
Supporting geographic classification used for broad regional grouping. It is not a source for Crime Index values.
UNODC Data Portal
Official crime-statistics context used to distinguish survey perception indices from administrative measures such as intentional homicide rates.
Related rankings
More StatRanker rankings on health systems, outcomes and medical capacity.
