

Cost of Living by Country 2026: Top 100 Household Price Levels
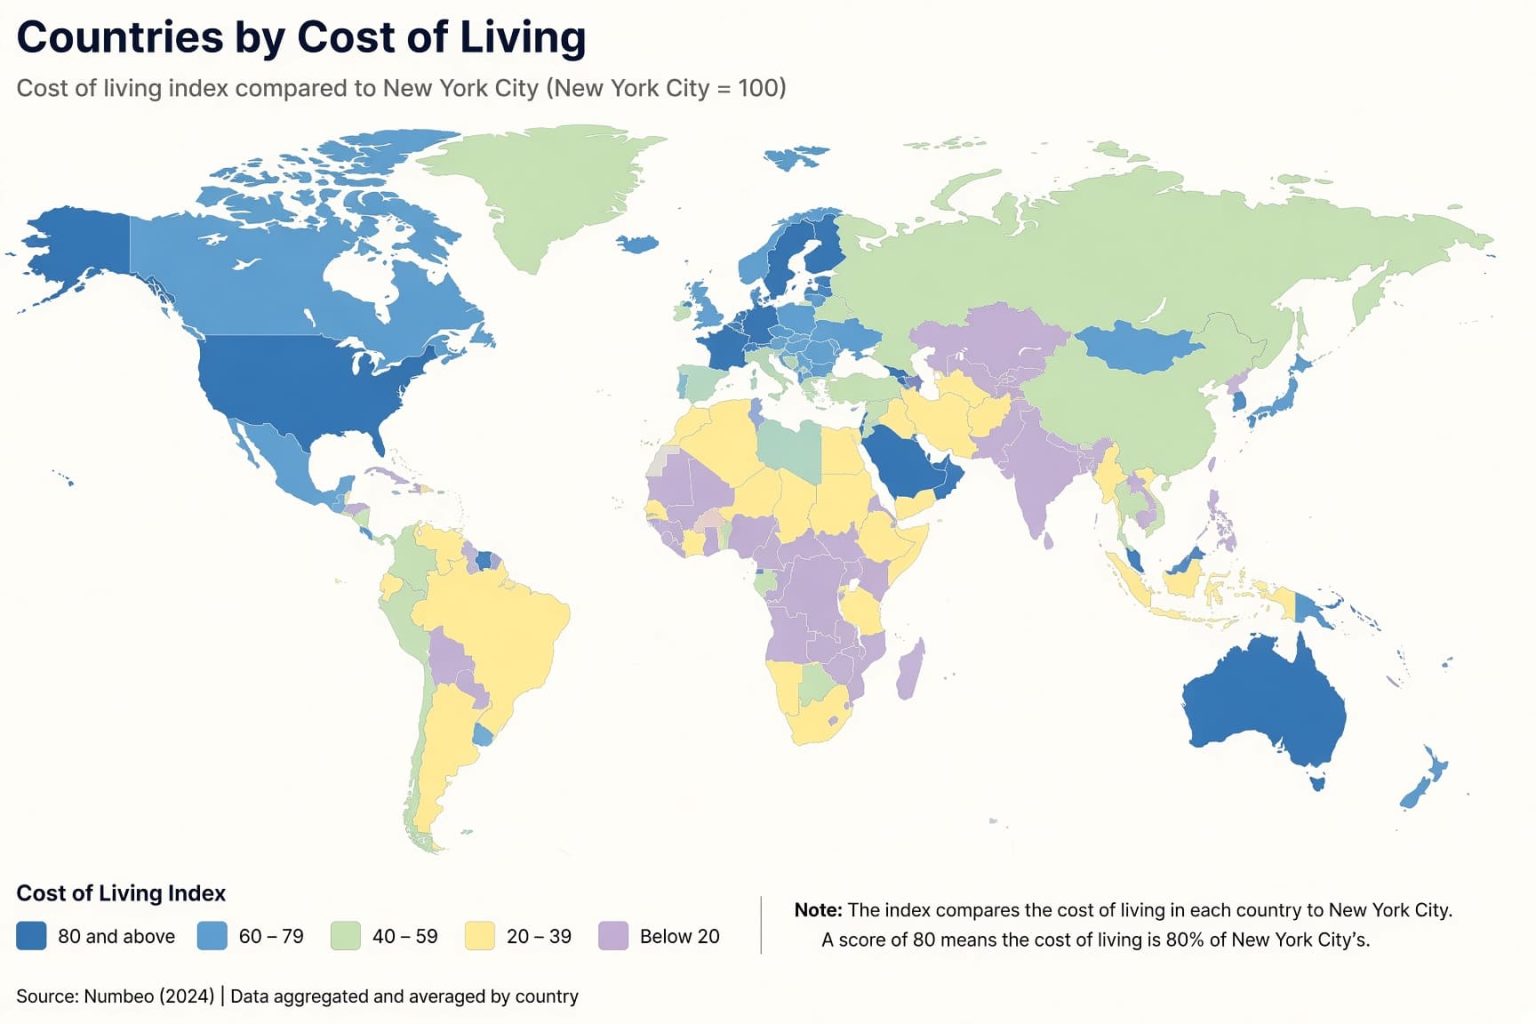
Cost of Living by Country: 2026 World Bank Household Price-Level Snapshot
Iceland has the highest published household Price Level Index in this Top 100 snapshot at 129.7, followed by Switzerland at 128.2. The metric is World Bank WDI series PA.NUS.PRVT.PLI for Households and NPISHs final consumption expenditure, with the United States set to 100.
This is a 2026 research snapshot using the latest comparable World Bank values from 2024 or 2025: 95 rows use 2025 data and 5 use 2024 data. It is a national household price-level comparison and a cost-of-living proxy, not a city budget, rent index or claim that the listed values were directly observed in 2026.
All 100 rows are official_value because the final index values are published directly by World Bank WDI. That status does not mean every underlying PPP is a direct 2025 price-survey observation: post-2021 private-consumption PPPs may be extrapolated or periodically updated, and benchmark PPPs for nonparticipating economies may be imputed by the World Bank. The table is a compiled research dataset based on 7 source pages: 1 numeric source and 6 methodology, participation, freshness and scope references.
World Bank WDI 2025. Use as a broad price-level comparison, not a precise statistical league-table result.
World Bank WDI 2025; the table contains exactly 100 confirmed UN member states.
95 source values are from 2025 and 5 are from 2024.
Higher published PLI values appear higher in the presentation order.
What the World Bank household Price Level Index measures
The World Bank Price Level Index compares national price levels for Households and NPISHs final consumption expenditure. It is derived from purchasing power parity and the corresponding market exchange rate, then expressed relative to the United States. A value above 100 indicates a higher price level than the U.S. reference for this aggregate; a value below 100 indicates a lower one.
A value of 129.7 therefore means the published household-consumption PLI is about 29.7% above the U.S. reference level on this specific aggregate. It does not mean every household, city, rent payment or individual product is exactly 29.7% more expensive.
World Bank metadata treats spatial cost-of-living comparisons as a valid use of PPP-based price levels with limitations and warns against using PPPs or PLIs as a precise tool to establish strict country rankings. For that reason, the numbered positions on this page are a presentation order based on published values; small differences between adjacent countries should not be overinterpreted.
Top 10 published household price-level values
Iceland and Switzerland have the two highest published values in this Top 100 snapshot. The Bahamas is third in the presentation order using its latest 2024 WDI value; the other Top 10 rows use 2025 values. The ordering is descriptive, not a claim that small differences between adjacent countries are statistically precise.
Top 10 countries by World Bank household Price Level Index, U.S. = 100
| Rank | Country | Price level index | Source / method note |
|---|---|---|---|
| 1 | Iceland | 129.7 | Europe & Central Asia; World Bank WDI 2025; official_value; source-published annual PLI; underlying PPP may be updated or extrapolated. |
| 2 | Switzerland | 128.2 | Europe & Central Asia; World Bank WDI 2025; official_value; source-published annual PLI; underlying PPP may be updated or extrapolated. |
| 3 | Bahamas | 110.7 | Latin America & Caribbean; World Bank WDI 2024; official_value; ICP 2021 nonparticipant; benchmark PPP may be imputed; later annual series may be extrapolated. |
| 4 | Israel | 105.9 | Middle East & North Africa; World Bank WDI 2025; official_value; source-published annual PLI; underlying PPP may be updated or extrapolated. |
| 5 | Denmark | 104.5 | Europe & Central Asia; World Bank WDI 2025; official_value; source-published annual PLI; underlying PPP may be updated or extrapolated. |
| 6 | Haiti | 102.2 | Latin America & Caribbean; World Bank WDI 2025; official_value; ICP 2021 nonparticipant; benchmark PPP may be imputed; later annual series may be extrapolated. |
| 7 | Ireland | 102.1 | Europe & Central Asia; World Bank WDI 2025; official_value; source-published annual PLI; underlying PPP may be updated or extrapolated. |
| 8 | Vanuatu | 101.6 | East Asia & Pacific; World Bank WDI 2025; official_value; source-published annual PLI; underlying PPP may be updated or extrapolated. |
| 9 | United States | 100.0 | North America; World Bank WDI 2025; official_value; source-published annual PLI; underlying PPP may be updated or extrapolated. |
| 10 | Luxembourg | 98.6 | Europe & Central Asia; World Bank WDI 2025; official_value; source-published annual PLI; underlying PPP may be updated or extrapolated. |
Higher index values rank higher. Values are the directly published WDI values used in this snapshot; equal published values are ordered alphabetically only to create a stable sequence.
Chart: Top 20 published household price-level values
The chart uses the same published values as the ranking table. Iceland is the 100% bar-length reference for this visualization only; the numeric labels remain the World Bank index values where the United States equals 100.
Methodology and limitations
The numeric table uses one World Bank WDI indicator: PA.NUS.PRVT.PLI, Price level index for Households and NPISHs final consumption expenditure. Six additional official reference pages are used to document ICP methodology, annual PPP extrapolation, limitations, ICP 2021 participation, database freshness and UN-member scope. World Development Indicators was last updated on July 13, 2026, and this page checked the source on September 28, 2026.
Metric and unit
Metric: household and NPISH final-consumption Price Level Index. Unit: index points with the United States normalized to 100. Higher values indicate higher price levels for the covered national consumption aggregate.
Display order
Rows are ordered from the highest published PLI to the lowest. This creates a useful Top 100 presentation, but World Bank PPP guidance says the measure should not be used as a precise tool for strict country rankings.
2026 snapshot rule
The page year is 2026; source observations are the latest 2024 or 2025 WDI values. Ninety-five rows use 2025 and five use 2024. The page does not create a synthetic 2026 value.
Underlying PPP timing
ICP 2021 is the latest global benchmark cycle. For years after 2021, WDI private-consumption PPPs can be extrapolated using relative CPI changes; Eurostat-OECD participants may also receive periodically updated programme PPPs.
Nonparticipating economies
World Bank may impute benchmark PPPs for economies that did not participate in the ICP comparison. Haiti and The Bahamas did not participate in ICP 2021, so their published later-year WDI PLI values should not be read as direct 2021 benchmark survey results.
Status and scope
All 100 rows remain official_value because WDI directly publishes the final PLI. StatRanker does not calculate or impute missing country-years. Only UN member states with a latest 2024 or 2025 value are eligible.
The PLI is derived from a PPP conversion factor relative to the corresponding market exchange rate. PPPs are designed for cross-country spatial comparisons and control for differences in price levels. For household consumption, the underlying price information covers a broad set of goods and services and is combined with expenditure weights; it is not a simple retail-price average.
Missing country-years are not filled, projected or averaged by StatRanker. Territories, dependencies, World Bank aggregates, rows without a qualifying recent value and countries whose latest WDI value predates 2024 are excluded. Region labels are navigation categories only and do not affect the order.
Main limitations: the page mixes latest 2024 and 2025 observations; post-2021 annual PPPs may be extrapolated or updated rather than directly benchmark-surveyed; some nonparticipating economies may rely on imputed benchmark PPPs; exchange-rate movements can affect PLI values; and national averages do not capture city-level housing, individual household baskets, wages, taxes or affordability. The ranking therefore shows broad relative price levels, not a precise measure of where every household will find life more expensive.
Main ranking: Top 100 country household price-level values
Use the controls to search by country, filter by region or status, change sort order, or switch between Top 10, Top 20 and all 100 confirmed entries. Rank numbers are a presentation order from the published PLI values, not a claim of precise statistical separation between adjacent countries.
Top 100 UN member states by latest 2024–2025 World Bank household Price Level Index
| Rank | Country | Price level index | Source / method note |
|---|---|---|---|
| 1 | Iceland | 129.7 | Europe & Central Asia; World Bank WDI 2025; official_value; source-published annual PLI; underlying PPP may be updated or extrapolated. |
| 2 | Switzerland | 128.2 | Europe & Central Asia; World Bank WDI 2025; official_value; source-published annual PLI; underlying PPP may be updated or extrapolated. |
| 3 | Bahamas | 110.7 | Latin America & Caribbean; World Bank WDI 2024; official_value; ICP 2021 nonparticipant; benchmark PPP may be imputed; later annual series may be extrapolated. |
| 4 | Israel | 105.9 | Middle East & North Africa; World Bank WDI 2025; official_value; source-published annual PLI; underlying PPP may be updated or extrapolated. |
| 5 | Denmark | 104.5 | Europe & Central Asia; World Bank WDI 2025; official_value; source-published annual PLI; underlying PPP may be updated or extrapolated. |
| 6 | Haiti | 102.2 | Latin America & Caribbean; World Bank WDI 2025; official_value; ICP 2021 nonparticipant; benchmark PPP may be imputed; later annual series may be extrapolated. |
| 7 | Ireland | 102.1 | Europe & Central Asia; World Bank WDI 2025; official_value; source-published annual PLI; underlying PPP may be updated or extrapolated. |
| 8 | Vanuatu | 101.6 | East Asia & Pacific; World Bank WDI 2025; official_value; source-published annual PLI; underlying PPP may be updated or extrapolated. |
| 9 | United States | 100.0 | North America; World Bank WDI 2025; official_value; source-published annual PLI; underlying PPP may be updated or extrapolated. |
| 10 | Luxembourg | 98.6 | Europe & Central Asia; World Bank WDI 2025; official_value; source-published annual PLI; underlying PPP may be updated or extrapolated. |
| 11 | Palau | 96.3 | East Asia & Pacific; World Bank WDI 2025; official_value; source-published annual PLI; underlying PPP may be updated or extrapolated. |
| 12 | Norway | 96.2 | Europe & Central Asia; World Bank WDI 2025; official_value; source-published annual PLI; underlying PPP may be updated or extrapolated. |
| 13 | Australia | 94.8 | East Asia & Pacific; World Bank WDI 2025; official_value; source-published annual PLI; underlying PPP may be updated or extrapolated. |
| 14 | United Kingdom | 92.4 | Europe & Central Asia; World Bank WDI 2025; official_value; source-published annual PLI; underlying PPP may be updated or extrapolated. |
| 15 | Solomon Islands | 91.8 | East Asia & Pacific; World Bank WDI 2025; official_value; source-published annual PLI; underlying PPP may be updated or extrapolated. |
| 16 | Finland | 90.6 | Europe & Central Asia; World Bank WDI 2025; official_value; source-published annual PLI; underlying PPP may be updated or extrapolated. |
| 17 | Sweden | 90.5 | Europe & Central Asia; World Bank WDI 2025; official_value; source-published annual PLI; underlying PPP may be updated or extrapolated. |
| 18 | Canada | 90.2 | North America; World Bank WDI 2025; official_value; source-published annual PLI; underlying PPP may be updated or extrapolated. |
| 19 | New Zealand | 89.8 | East Asia & Pacific; World Bank WDI 2025; official_value; source-published annual PLI; underlying PPP may be updated or extrapolated. |
| 20 | Belgium | 87.2 | Europe & Central Asia; World Bank WDI 2025; official_value; source-published annual PLI; underlying PPP may be updated or extrapolated. |
| 21 | Netherlands | 86.7 | Europe & Central Asia; World Bank WDI 2025; official_value; source-published annual PLI; underlying PPP may be updated or extrapolated. |
| 22 | Austria | 84.8 | Europe & Central Asia; World Bank WDI 2025; official_value; source-published annual PLI; underlying PPP may be updated or extrapolated. |
| 23 | San Marino | 83.2 | Europe & Central Asia; World Bank WDI 2025; official_value; source-published annual PLI; underlying PPP may be updated or extrapolated. |
| 24 | France | 82.8 | Europe & Central Asia; World Bank WDI 2025; official_value; source-published annual PLI; underlying PPP may be updated or extrapolated. |
| 25 | Antigua and Barbuda | 81.2 | Latin America & Caribbean; World Bank WDI 2025; official_value; source-published annual PLI; underlying PPP may be updated or extrapolated. |
| 26 | Germany | 81.2 | Europe & Central Asia; World Bank WDI 2025; official_value; source-published annual PLI; underlying PPP may be updated or extrapolated. |
| 27 | Tonga | 78.4 | East Asia & Pacific; World Bank WDI 2025; official_value; source-published annual PLI; underlying PPP may be updated or extrapolated. |
| 28 | Singapore | 78.3 | East Asia & Pacific; World Bank WDI 2025; official_value; source-published annual PLI; underlying PPP may be updated or extrapolated. |
| 29 | Estonia | 75.9 | Europe & Central Asia; World Bank WDI 2025; official_value; source-published annual PLI; underlying PPP may be updated or extrapolated. |
| 30 | Qatar | 75.7 | Middle East & North Africa; World Bank WDI 2024; official_value; source-published annual PLI; underlying PPP may be updated or extrapolated. |
| 31 | Italy | 72.9 | Europe & Central Asia; World Bank WDI 2025; official_value; source-published annual PLI; underlying PPP may be updated or extrapolated. |
| 32 | Uruguay | 72.5 | Latin America & Caribbean; World Bank WDI 2025; official_value; source-published annual PLI; underlying PPP may be updated or extrapolated. |
| 33 | United Arab Emirates | 69.8 | Middle East & North Africa; World Bank WDI 2024; official_value; source-published annual PLI; underlying PPP may be updated or extrapolated. |
| 34 | Japan | 69.0 | East Asia & Pacific; World Bank WDI 2025; official_value; source-published annual PLI; underlying PPP may be updated or extrapolated. |
| 35 | Malta | 69.0 | Europe & Central Asia; World Bank WDI 2025; official_value; source-published annual PLI; underlying PPP may be updated or extrapolated. |
| 36 | Spain | 68.7 | Europe & Central Asia; World Bank WDI 2025; official_value; source-published annual PLI; underlying PPP may be updated or extrapolated. |
| 37 | Sao Tome and Principe | 67.8 | Sub-Saharan Africa; World Bank WDI 2025; official_value; source-published annual PLI; underlying PPP may be updated or extrapolated. |
| 38 | Samoa | 67.6 | East Asia & Pacific; World Bank WDI 2025; official_value; source-published annual PLI; underlying PPP may be updated or extrapolated. |
| 39 | Czechia | 67.0 | Europe & Central Asia; World Bank WDI 2025; official_value; source-published annual PLI; underlying PPP may be updated or extrapolated. |
| 40 | Papua New Guinea | 67.0 | East Asia & Pacific; World Bank WDI 2025; official_value; source-published annual PLI; underlying PPP may be updated or extrapolated. |
| 41 | Slovenia | 67.0 | Europe & Central Asia; World Bank WDI 2025; official_value; source-published annual PLI; underlying PPP may be updated or extrapolated. |
| 42 | Cyprus | 66.9 | Europe & Central Asia; World Bank WDI 2025; official_value; source-published annual PLI; underlying PPP may be updated or extrapolated. |
| 43 | Greece | 65.5 | Europe & Central Asia; World Bank WDI 2025; official_value; source-published annual PLI; underlying PPP may be updated or extrapolated. |
| 44 | Lebanon | 65.3 | Middle East & North Africa; World Bank WDI 2025; official_value; source-published annual PLI; underlying PPP may be updated or extrapolated. |
| 45 | Portugal | 64.9 | Europe & Central Asia; World Bank WDI 2025; official_value; source-published annual PLI; underlying PPP may be updated or extrapolated. |
| 46 | Slovak Republic | 63.9 | Europe & Central Asia; World Bank WDI 2025; official_value; source-published annual PLI; underlying PPP may be updated or extrapolated. |
| 47 | Costa Rica | 62.5 | Latin America & Caribbean; World Bank WDI 2025; official_value; source-published annual PLI; underlying PPP may be updated or extrapolated. |
| 48 | Latvia | 62.4 | Europe & Central Asia; World Bank WDI 2025; official_value; source-published annual PLI; underlying PPP may be updated or extrapolated. |
| 49 | St. Vincent and the Grenadines | 62.2 | Latin America & Caribbean; World Bank WDI 2025; official_value; source-published annual PLI; underlying PPP may be updated or extrapolated. |
| 50 | Lithuania | 62.1 | Europe & Central Asia; World Bank WDI 2025; official_value; source-published annual PLI; underlying PPP may be updated or extrapolated. |
| 51 | Maldives | 62.1 | South Asia; World Bank WDI 2025; official_value; source-published annual PLI; underlying PPP may be updated or extrapolated. |
| 52 | Korea, Rep. | 61.9 | East Asia & Pacific; World Bank WDI 2025; official_value; source-published annual PLI; underlying PPP may be updated or extrapolated. |
| 53 | Grenada | 61.8 | Latin America & Caribbean; World Bank WDI 2025; official_value; source-published annual PLI; underlying PPP may be updated or extrapolated. |
| 54 | Jamaica | 61.7 | Latin America & Caribbean; World Bank WDI 2025; official_value; source-published annual PLI; underlying PPP may be updated or extrapolated. |
| 55 | Kiribati | 61.7 | East Asia & Pacific; World Bank WDI 2024; official_value; source-published annual PLI; underlying PPP may be updated or extrapolated. |
| 56 | Kuwait | 59.8 | Middle East & North Africa; World Bank WDI 2025; official_value; source-published annual PLI; underlying PPP may be updated or extrapolated. |
| 57 | St. Lucia | 59.1 | Latin America & Caribbean; World Bank WDI 2025; official_value; source-published annual PLI; underlying PPP may be updated or extrapolated. |
| 58 | Croatia | 58.8 | Europe & Central Asia; World Bank WDI 2025; official_value; source-published annual PLI; underlying PPP may be updated or extrapolated. |
| 59 | Mexico | 58.8 | Latin America & Caribbean; World Bank WDI 2025; official_value; source-published annual PLI; underlying PPP may be updated or extrapolated. |
| 60 | Comoros | 58.1 | Sub-Saharan Africa; World Bank WDI 2025; official_value; source-published annual PLI; underlying PPP may be updated or extrapolated. |
| 61 | Hungary | 57.9 | Europe & Central Asia; World Bank WDI 2025; official_value; source-published annual PLI; underlying PPP may be updated or extrapolated. |
| 62 | Dominica | 57.7 | Latin America & Caribbean; World Bank WDI 2025; official_value; source-published annual PLI; underlying PPP may be updated or extrapolated. |
| 63 | Seychelles | 57.4 | Sub-Saharan Africa; World Bank WDI 2025; official_value; source-published annual PLI; underlying PPP may be updated or extrapolated. |
| 64 | Trinidad and Tobago | 56.9 | Latin America & Caribbean; World Bank WDI 2025; official_value; source-published annual PLI; underlying PPP may be updated or extrapolated. |
| 65 | Poland | 54.9 | Europe & Central Asia; World Bank WDI 2025; official_value; source-published annual PLI; underlying PPP may be updated or extrapolated. |
| 66 | Belize | 54.4 | Latin America & Caribbean; World Bank WDI 2025; official_value; source-published annual PLI; underlying PPP may be updated or extrapolated. |
| 67 | Albania | 54.3 | Europe & Central Asia; World Bank WDI 2025; official_value; source-published annual PLI; underlying PPP may be updated or extrapolated. |
| 68 | Cabo Verde | 54.1 | Sub-Saharan Africa; World Bank WDI 2025; official_value; source-published annual PLI; underlying PPP may be updated or extrapolated. |
| 69 | Peru | 54.0 | Latin America & Caribbean; World Bank WDI 2025; official_value; source-published annual PLI; underlying PPP may be updated or extrapolated. |
| 70 | Liberia | 53.3 | Sub-Saharan Africa; World Bank WDI 2025; official_value; source-published annual PLI; underlying PPP may be updated or extrapolated. |
| 71 | Chile | 51.2 | Latin America & Caribbean; World Bank WDI 2025; official_value; source-published annual PLI; underlying PPP may be updated or extrapolated. |
| 72 | Serbia | 50.9 | Europe & Central Asia; World Bank WDI 2025; official_value; source-published annual PLI; underlying PPP may be updated or extrapolated. |
| 73 | Moldova | 50.5 | Europe & Central Asia; World Bank WDI 2025; official_value; source-published annual PLI; underlying PPP may be updated or extrapolated. |
| 74 | Saudi Arabia | 49.9 | Middle East & North Africa; World Bank WDI 2025; official_value; source-published annual PLI; underlying PPP may be updated or extrapolated. |
| 75 | Djibouti | 49.8 | Middle East & North Africa; World Bank WDI 2025; official_value; source-published annual PLI; underlying PPP may be updated or extrapolated. |
| 76 | Panama | 49.7 | Latin America & Caribbean; World Bank WDI 2025; official_value; source-published annual PLI; underlying PPP may be updated or extrapolated. |
| 77 | Montenegro | 49.6 | Europe & Central Asia; World Bank WDI 2025; official_value; source-published annual PLI; underlying PPP may be updated or extrapolated. |
| 78 | Bahrain | 48.8 | Middle East & North Africa; World Bank WDI 2025; official_value; source-published annual PLI; underlying PPP may be updated or extrapolated. |
| 79 | Romania | 48.8 | Europe & Central Asia; World Bank WDI 2025; official_value; source-published annual PLI; underlying PPP may be updated or extrapolated. |
| 80 | Honduras | 48.6 | Latin America & Caribbean; World Bank WDI 2025; official_value; source-published annual PLI; underlying PPP may be updated or extrapolated. |
| 81 | Gabon | 48.3 | Sub-Saharan Africa; World Bank WDI 2025; official_value; source-published annual PLI; underlying PPP may be updated or extrapolated. |
| 82 | China | 48.1 | East Asia & Pacific; World Bank WDI 2025; official_value; source-published annual PLI; underlying PPP may be updated or extrapolated. |
| 83 | Oman | 47.3 | Middle East & North Africa; World Bank WDI 2025; official_value; source-published annual PLI; underlying PPP may be updated or extrapolated. |
| 84 | El Salvador | 46.9 | Latin America & Caribbean; World Bank WDI 2025; official_value; source-published annual PLI; underlying PPP may be updated or extrapolated. |
| 85 | Guyana | 46.9 | Latin America & Caribbean; World Bank WDI 2025; official_value; source-published annual PLI; underlying PPP may be updated or extrapolated. |
| 86 | Bulgaria | 46.7 | Europe & Central Asia; World Bank WDI 2025; official_value; source-published annual PLI; underlying PPP may be updated or extrapolated. |
| 87 | Brazil | 46.2 | Latin America & Caribbean; World Bank WDI 2025; official_value; source-published annual PLI; underlying PPP may be updated or extrapolated. |
| 88 | Equatorial Guinea | 45.5 | Sub-Saharan Africa; World Bank WDI 2024; official_value; source-published annual PLI; underlying PPP may be updated or extrapolated. |
| 89 | Turkiye | 45.0 | Europe & Central Asia; World Bank WDI 2025; official_value; source-published annual PLI; underlying PPP may be updated or extrapolated. |
| 90 | Jordan | 44.8 | Middle East & North Africa; World Bank WDI 2025; official_value; source-published annual PLI; underlying PPP may be updated or extrapolated. |
| 91 | Guatemala | 44.7 | Latin America & Caribbean; World Bank WDI 2025; official_value; source-published annual PLI; underlying PPP may be updated or extrapolated. |
| 92 | Timor-Leste | 44.6 | East Asia & Pacific; World Bank WDI 2025; official_value; source-published annual PLI; underlying PPP may be updated or extrapolated. |
| 93 | Central African Republic | 44.5 | Sub-Saharan Africa; World Bank WDI 2025; official_value; source-published annual PLI; underlying PPP may be updated or extrapolated. |
| 94 | Bosnia and Herzegovina | 44.3 | Europe & Central Asia; World Bank WDI 2025; official_value; source-published annual PLI; underlying PPP may be updated or extrapolated. |
| 95 | Ecuador | 44.2 | Latin America & Caribbean; World Bank WDI 2025; official_value; source-published annual PLI; underlying PPP may be updated or extrapolated. |
| 96 | Mauritius | 43.7 | Sub-Saharan Africa; World Bank WDI 2025; official_value; source-published annual PLI; underlying PPP may be updated or extrapolated. |
| 97 | South Africa | 43.3 | Sub-Saharan Africa; World Bank WDI 2025; official_value; source-published annual PLI; underlying PPP may be updated or extrapolated. |
| 98 | Morocco | 42.3 | Middle East & North Africa; World Bank WDI 2025; official_value; source-published annual PLI; underlying PPP may be updated or extrapolated. |
| 99 | Iraq | 42.0 | Middle East & North Africa; World Bank WDI 2025; official_value; source-published annual PLI; underlying PPP may be updated or extrapolated. |
| 100 | Suriname | 41.9 | Latin America & Caribbean; World Bank WDI 2025; official_value; source-published annual PLI; underlying PPP may be updated or extrapolated. |
Compiled research dataset based on 7 source pages: 1 numeric source and 6 methodology, participation, freshness and scope references. Row-level values are World Bank WDI official values. The 2026 label is the page snapshot, while source observations are from 2024 or 2025. World Bank cautions against using PPP-based price levels as a precise tool for strict country rankings.
Insights from the Top 100 price-level snapshot
Key Insight
Iceland has the highest published value in the table at 129.7, followed by Switzerland at 128.2. The gap to the U.S. reference is large enough to be visible without relying on a marginal tie-break.
Notable Pattern
Nine of the first ten displayed entries are at or above the U.S. reference level of 100. Luxembourg, at 98.6, is the only one below that benchmark.
Regional / Source Concentration
Europe & Central Asia accounts for 38 of the 100 rows under the page’s region grouping. All numeric values use the same World Bank WDI indicator, avoiding metric mixing across rows.
Interpretation Risk
Very small gaps should not be treated as proof that one country is definitively more expensive than another. The World Bank itself cautions against using PPP-based price levels as a precise strict-ranking tool.
How to use this ranking
Use the table to compare broad national household-consumption price levels. A value above 100 indicates a higher published PLI than the U.S. reference for this aggregate; a value below 100 indicates a lower one. Do not interpret a one- or two-point gap as proof of a meaningful real-world difference in every household’s expenses.
The data status and the data-generation method are different questions. Every row is an official_value because WDI publishes the final index directly, but the underlying PPP can come from an ICP benchmark, a World Bank imputation for a nonparticipating economy, a post-benchmark extrapolation, or a periodically updated Eurostat-OECD programme value.
For practical relocation or affordability research, combine this country-level price snapshot with city-level costs and income data. StatRanker’s related comparisons are Top 100 Cities by Cost of Living in 2026, U.S. States by Cost of Living in 2026, and Top 99 Countries by Net Average Salary After Tax in 2026.
Download the Cost of Living by Country 2026: Top 100 Household Price Levels dataset
Cost of Living by Country 2026: Top 100 Household Price Levels
100 ranked entries · Excel + CSV + methodology + sources + chart · Snapshot: 2026 snapshot based on latest 2024–2025 World Bank household PLI observations · Version 1.0
No signup required. The archive includes machine-readable data, methodology and source documentation. Quick human verification is required before the ZIP is delivered.
Download Excel + CSV Data PackFAQ
Which country has the highest published household price-level value in this snapshot?
Iceland has the highest published WDI value in the Top 100 table at 129.7, followed by Switzerland at 128.2. These positions describe the published values; World Bank guidance cautions against interpreting PPP-based price levels as a precise strict ranking.
Are these 2026 price observations?
No. This is a 2026 page snapshot using latest WDI source values from 2024 and 2025. Ninety-five rows use 2025 values and five use 2024 values.
Are the 2025 values direct 2025 price-survey results?
Not necessarily. ICP 2021 is the latest global benchmark cycle. World Bank explains that private-consumption PPPs after 2021 can be extrapolated using relative CPI changes, while Eurostat-OECD participants may receive periodically updated programme PPPs. Nonparticipating economies can have benchmark PPPs imputed by regression.
What does United States = 100 mean?
The United States is the reference for this WDI household price-level series. A PLI of 120 is about 20% above the U.S. reference for the covered aggregate; 80 is about 20% below it. This does not imply that every individual expense differs by exactly that percentage.
Is this the same as Numbeo’s Cost of Living Index?
No. This page uses an official World Bank WDI household price-level indicator derived from PPP and exchange-rate concepts. It is not a crowdsourced city-budget index, so the values, coverage and ordering can differ substantially.
Why do Haiti and The Bahamas need extra caution?
World Bank records both as nonparticipants in the ICP 2021 benchmark comparison. The ICP methodology allows benchmark PPPs for nonparticipating economies to be imputed, and later WDI annual PPP series can be extrapolated. Their WDI values are still source-published official_value rows on this page, but they are not direct ICP 2021 benchmark observations.
Does this ranking measure rent or affordability?
Not directly. It covers the broad national Households and NPISHs final-consumption aggregate. It is not a standalone rent index and does not adjust prices for local wages, taxes, household composition or purchasing power.
Why are some countries and territories absent?
The scope is limited to UN member states whose latest WDI value is from 2024 or 2025. StatRanker excludes territories, dependencies, aggregates, missing rows and countries whose latest qualifying source value predates 2024 rather than filling the gap itself.
Sources
Numeric ranking values come from one World Bank WDI indicator. Six additional official pages document the methodology, post-benchmark extrapolation, limitations, ICP 2021 participation, database freshness and UN-member scope.
World Bank WDI — Household Price Level Index
Primary numeric source for row values and source years. Indicator PA.NUS.PRVT.PLI.
World Bank International Comparison Program — Methodology
Defines PPP methodology, national annual average price collection, household-consumption coverage and imputation methods for nonparticipating economies.
World Bank Data Help Desk — PPP Extrapolation
Explains that WDI extrapolates private-consumption PPPs after the 2021 benchmark using country inflation relative to U.S. inflation, based on CPI.
World Bank WDI Metadata — PPP Uses and Limitations
Documents PPP/PLI uses, post-2021 extrapolation, imputation for nonparticipants and the warning against using PPPs as a precise measure for strict country rankings.
https://databank.worldbank.org/metadataglossary/world-development-indicators/series/PA.NUS.PRVT.PP
World Bank ICP 2021 — Participation History
Participation reference confirming that Haiti and The Bahamas did not participate in the ICP 2021 benchmark comparison.
https://www.worldbank.org/en/programs/icp/brief/ICP2021_History
World Bank DataBank — WDI Freshness
Database freshness reference. World Development Indicators was listed as updated on July 13, 2026 when this page was checked.
United Nations — Member States
Scope reference used to keep the Top 100 limited to UN member states rather than territories, dependencies or World Bank aggregates.
Related rankings
More StatRanker rankings on health systems, outcomes and medical capacity.
