Top 100 Cities by Cost of Living in 2026
Cost of Living by City in 2026: where everyday expenses are highest
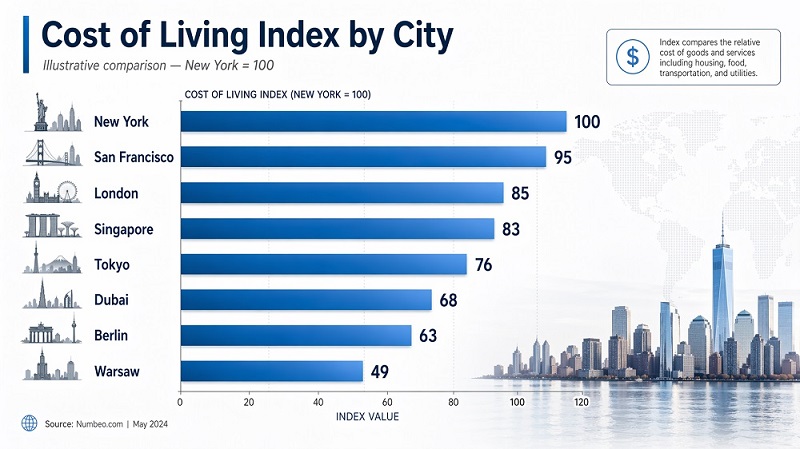
The Cost of Living Index compares the price level of everyday consumer expenses across cities, using New York City as the baseline of 100. A city with an index of 118.5 is estimated to be about 18.5% more expensive than New York for the covered basket, while a city with 75.0 is about 25% lower. Rent is shown separately because housing can change the real budget picture far more than groceries, transport or restaurants alone.
The 2026 ranking is especially useful for relocation planning, digital nomad budgeting, student city choices and salary comparisons. It does not say where life is “better”; it shows where the same broad basket of goods and services is likely to cost more.
Top-end overview: Switzerland, U.S. coastal markets and high-income hubs
The top of the 2026 list is unusually concentrated. Zurich, Geneva, Basel, Lausanne, Lugano and Bern occupy the first six positions, making Switzerland the clearest high-cost cluster in the ranking. Outside Switzerland, New York, Reykjavik, Honolulu and San Francisco complete the Top 10. This pattern reflects a combination of high wages, strong currencies, tight housing markets, import costs and high service-sector prices.
The wider Top 20 adds several expensive U.S. metro areas, Nordic cities, London, Singapore and Copenhagen. Rent does not always move in the same direction as the headline cost index: New York has the highest rent baseline, while Swiss cities lead the everyday basket even with lower rent scores than New York.
Zurich leads the ranking because everyday goods, services and restaurants are substantially above the New York baseline.
Geneva combines Swiss price levels with an international labour market and a premium service economy.
New York is the baseline city. It remains the rent reference point and a major comparison anchor for global relocation budgets.
Singapore ranks high globally, but its headline cost basket sits below the Swiss and top U.S. coastal cities in this dataset.
Cost of Living Index by city, 2026: 100-city ranking
Compare cities by the headline Cost of Living Index, rent pressure and region. The headline index is kept separate from rent because housing can change the real monthly budget even when the everyday basket looks similar.
| Rank | City | Cost of Living Index | Rent Index |
|---|---|---|---|
| 1 | Zurich, Switzerland | 118.5 | 70.6 |
| 2 | Geneva, Switzerland | 116.5 | 65.1 |
| 3 | Basel, Switzerland | 112.4 | 49.6 |
| 4 | Lausanne, Switzerland | 111.5 | 55.0 |
| 5 | Lugano, Switzerland | 110.1 | 47.0 |
| 6 | Bern, Switzerland | 110.0 | 46.8 |
| 7 | New York, NY, United States | 100.0 | 100.0 |
| 8 | Reykjavik, Iceland | 98.9 | 50.1 |
| 9 | Honolulu, HI, United States | 98.2 | 63.9 |
| 10 | San Francisco, CA, United States | 97.6 | 80.5 |
| 11 | Tel Aviv-Yafo, Israel | 91.4 | 46.2 |
| 12 | Seattle, WA, United States | 90.3 | 60.2 |
| 13 | Oslo, Norway | 90.2 | 39.3 |
| 14 | Singapore, Singapore | 87.7 | 73.1 |
| 15 | London, United Kingdom | 87.5 | 70.1 |
| 16 | Washington, DC, United States | 87.3 | 69.0 |
| 17 | San Jose, CA, United States | 86.4 | 73.1 |
| 18 | Boston, MA, United States | 86.2 | 77.7 |
| 19 | Charleston, SC, United States | 86.0 | 58.2 |
| 20 | Copenhagen, Denmark | 85.7 | 46.1 |
| 21 | Bergen, Norway | 85.6 | 29.0 |
| 22 | Oakland, CA, United States | 85.2 | 59.5 |
| 23 | Trondheim, Norway | 84.9 | 29.8 |
| 24 | Ramat Gan, Israel | 83.7 | 33.2 |
| 25 | Berkeley, CA, United States | 83.5 | 67.4 |
| 26 | Jerusalem, Israel | 83.0 | 40.2 |
| 27 | Stavanger, Norway | 82.7 | 37.1 |
| 28 | Amsterdam, Netherlands | 82.6 | 60.0 |
| 29 | San Diego, CA, United States | 82.0 | 74.5 |
| 30 | Anchorage, AK, United States | 81.5 | 36.9 |
| 31 | Los Angeles, CA, United States | 81.5 | 64.6 |
| 32 | Aalborg, Denmark | 80.9 | 24.7 |
| 33 | Luxembourg, Luxembourg | 80.6 | 54.8 |
| 34 | Haifa, Israel | 80.0 | 23.6 |
| 35 | Irvine, CA, United States | 79.6 | 69.9 |
| 36 | Miami, FL, United States | 79.5 | 69.0 |
| 37 | Haarlem, Netherlands | 79.5 | 43.5 |
| 38 | Sacramento, CA, United States | 79.2 | 47.3 |
| 39 | Aarhus, Denmark | 78.9 | 33.2 |
| 40 | Philadelphia, PA, United States | 78.8 | 44.7 |
| 41 | Stockholm, Sweden | 78.6 | 36.1 |
| 42 | Paris, France | 78.6 | 43.5 |
| 43 | Arlington, VA, United States | 77.5 | 62.6 |
| 44 | Odense, Denmark | 77.3 | 23.2 |
| 45 | Utrecht, Netherlands | 77.3 | 44.2 |
| 46 | New Orleans, LA, United States | 77.1 | 40.5 |
| 47 | Dublin, Ireland | 76.7 | 59.7 |
| 48 | Espoo, Finland | 76.4 | 30.3 |
| 49 | Petah Tikva, Israel | 76.3 | 29.1 |
| 50 | Oxford, United Kingdom | 76.2 | 47.9 |
| 51 | Jersey City, NJ, United States | 76.2 | 72.6 |
| 52 | Munich, Germany | 76.1 | 45.4 |
| 53 | Chicago, IL, United States | 76.0 | 55.2 |
| 54 | Beersheba, Israel | 75.9 | 16.1 |
| 55 | Fort Lauderdale, FL, United States | 75.5 | 61.2 |
| 56 | Guildford, United Kingdom | 75.4 | 42.4 |
| 57 | Atlanta, GA, United States | 75.3 | 44.2 |
| 58 | Portland, OR, United States | 75.2 | 48.4 |
| 59 | Hong Kong, Hong Kong (China) | 75.2 | 63.1 |
| 60 | Sydney, Australia | 75.1 | 53.8 |
| 61 | Denver, CO, United States | 75.1 | 50.2 |
| 62 | Strasbourg, France | 74.7 | 22.8 |
| 63 | Rotterdam, Netherlands | 74.6 | 41.1 |
| 64 | Brighton, United Kingdom | 74.5 | 42.9 |
| 65 | Helsinki, Finland | 74.3 | 29.4 |
| 66 | Delft, Netherlands | 74.2 | 39.5 |
| 67 | Frankfurt, Germany | 74.0 | 36.1 |
| 68 | Cambridge, United Kingdom | 73.9 | 45.5 |
| 69 | Vienna, Austria | 73.9 | 29.6 |
| 70 | Marseille, France | 73.9 | 21.4 |
| 71 | Dusseldorf, Germany | 73.9 | 32.5 |
| 72 | Brussels, Belgium | 73.5 | 33.1 |
| 73 | Nice, France | 73.4 | 30.2 |
| 74 | Heidelberg, Germany | 73.4 | 34.4 |
| 75 | Gent, Belgium | 73.2 | 26.7 |
| 76 | Milan, Italy | 73.1 | 41.4 |
| 77 | Edinburgh, United Kingdom | 73.0 | 37.9 |
| 78 | Colorado Springs, CO, United States | 73.0 | 40.1 |
| 79 | Dallas, TX, United States | 72.9 | 45.8 |
| 80 | The Hague (Den Haag), Netherlands | 72.3 | 43.8 |
| 81 | Lyon, France | 72.2 | 22.8 |
| 82 | Cork, Ireland | 72.2 | 45.3 |
| 83 | Galway, Ireland | 71.9 | 51.9 |
| 84 | Hamburg, Germany | 71.9 | 32.4 |
| 85 | Baltimore, MD, United States | 71.8 | 36.3 |
| 86 | Wiesbaden, Germany | 71.7 | 26.3 |
| 87 | Eindhoven, Netherlands | 71.7 | 36.0 |
| 88 | Antwerp, Belgium | 71.6 | 24.3 |
| 89 | Darmstadt, Germany | 71.6 | 28.8 |
| 90 | Phoenix, AZ, United States | 71.6 | 39.7 |
| 91 | Minneapolis, MN, United States | 71.5 | 38.2 |
| 92 | Buffalo, NY, United States | 71.5 | 31.5 |
| 93 | Stuttgart, Germany | 71.5 | 30.1 |
| 94 | Cologne, Germany | 71.4 | 29.1 |
| 95 | Reading, United Kingdom | 71.3 | 40.4 |
| 96 | Graz, Austria | 71.3 | 20.3 |
| 97 | Spokane, WA, United States | 71.2 | 38.6 |
| 98 | Canberra, Australia | 71.2 | 37.8 |
| 99 | Leiden, Netherlands | 71.2 | 36.3 |
| 100 | Bristol, United Kingdom | 71.1 | 42.2 |
Source: Numbeo Cost of Living Index by City 2026. New York City equals 100.0. Rent Index is shown separately because housing markets can differ sharply from the non-rent consumption basket. Updated: April 24, 2026.
Cost is not the same as affordability. Zurich, Geneva and New York are expensive in index terms, but local purchasing power can partly offset high prices for residents earning local salaries. Singapore, London and Dublin show why rent must be checked separately: a city can sit below the Swiss cluster on the everyday basket while still requiring a large housing budget.
Chart: Top 20 cities by Cost of Living Index
The chart highlights the upper-tier concentration: the six Swiss cities are separated from the rest of the table, while the next group is made up of U.S. coastal or island markets, Reykjavik, Tel Aviv-Yafo, Oslo, Singapore and London.
- Zurich — 118.5
- Geneva — 116.5
- Basel — 112.4
- Lausanne — 111.5
- Lugano — 110.1
- Bern — 110.0
- New York — 100.0
- Reykjavik — 98.9
- Honolulu — 98.2
- San Francisco — 97.6
- Tel Aviv-Yafo — 91.4
- Seattle — 90.3
- Oslo — 90.2
- Singapore — 87.7
- London — 87.5
- Washington, DC — 87.3
- San Jose — 86.4
- Boston — 86.2
- Charleston — 86.0
- Copenhagen — 85.7
Methodology
The ranking uses Numbeo’s Cost of Living Index by City 2026. The index is benchmarked to New York City at 100 and compares a basket of everyday consumer prices such as groceries, restaurants, transport, utilities and other recurring expenses. Rent is not folded into the headline Cost of Living Index shown in the main value column; it is provided as a separate Rent Index so that readers can distinguish between everyday consumption costs and housing-market pressure.
The year label 2026 is treated as a point-in-time snapshot rather than a forecast. City-level prices change continuously, so the ranking should be read as a 2026 comparison based on the source table rather than as a live price feed.
Region labels were harmonised for simple filtering: Europe, Americas, Asia and Oceania. Values are shown to one decimal place because the source table is reported at that precision. The ranking should be read as an indexed price-level comparison, not as a measure of city size, household income, quality of life or total consumer spending.
The main limitation is data comparability. Numbeo is a crowdsourced price database, so sample size, user submissions, item definitions and neighbourhood mix can affect results. The index is useful for directional comparison and relocation budgeting, but it should be cross-checked with employer mobility surveys, local rent listings, tax rules, health-insurance costs and personal consumption patterns before making a major move.
Insights from the 2026 distribution
Zurich, Geneva, Basel, Lausanne, Lugano and Bern form a compact high-cost cluster. The pattern is consistent with strong wages, expensive services and high consumer price levels across Switzerland rather than a single-city anomaly.
New York is only seventh by the headline cost index, but it remains the rent baseline at 100. San Francisco, Boston, San Diego, London and Singapore also show high rent scores, meaning housing can dominate the real monthly budget.
Several expensive cities also have high local purchasing power. A city can be costly for visitors or remote workers paid elsewhere but still manageable for residents with strong local wages.
Country averages hide large city gaps. Paris, Amsterdam, Dublin, Munich and Milan differ not only in rent but also in food, transport, restaurants and local salary levels.
What this means for the reader
For relocation, the ranking helps set the first budget expectation. A move from a city near index 70 to a city near 110 can feel like a major pay cut unless salary, housing support or taxes compensate for the difference. For remote workers, the index highlights where a globally paid salary may stretch less than expected.
For students, rent and local transport matter more than the headline index alone. Cities such as London, Dublin, Boston, New York and San Francisco can require a higher housing buffer than the everyday basket suggests. For families, groceries, childcare, health insurance and school costs can shift the true ranking from a household perspective.
For employers, the ranking is a reminder that mobility packages should be city-specific. A national cost adjustment can miss the difference between an average country price level and the reality of premium urban districts.
FAQ
Why is Zurich ranked first in 2026?
Zurich has the highest headline Cost of Living Index in the 2026 table. Swiss cities tend to score highly because wages, services, restaurants and everyday retail prices are elevated compared with the New York baseline.
Does the Cost of Living Index include rent?
The headline Cost of Living Index is shown separately from the Rent Index. That distinction matters because a city can be expensive for groceries and restaurants but less extreme in housing, or the reverse.
Is a score above 100 more expensive than New York?
Yes. New York City is the baseline at 100. A score of 118.5 means the covered basket is estimated to be about 18.5% above New York’s baseline for that index.
Can this ranking decide whether a city is affordable?
No single index can answer that. Affordability depends on income, taxes, rent, household size, healthcare, transport needs and lifestyle. The ranking is best used as a starting point for budgeting and city comparison.
Why are many expensive U.S. cities still below Swiss cities?
U.S. cities often have very high rent, especially New York, San Francisco and Boston. Swiss cities can outrank them on the broader everyday cost basket, which includes non-rent consumer prices and services.
Is Numbeo an official government source?
No. Numbeo is a crowdsourced price database. It is useful because it covers many cities, but its figures should be cross-checked with official inflation data, local rent listings and employer mobility studies when decisions involve money or relocation.
Sources
-
Numbeo — Cost of Living Index by City 2026.
Source for the 100 city rows, including Cost of Living Index and Rent Index. Numbeo is not an official statistical agency; it is used here because it provides broad global city coverage.
https://www.numbeo.com/cost-of-living/rankings.jsp?title=2026 -
Numbeo — Methodology and motivation.
Background on index construction, user-submitted price data and the interpretation of Numbeo indicators.
https://www.numbeo.com/common/motivation_and_methodology.jsp -
Mercer — Cost of Living City Ranking.
Employer mobility context for international assignments and expatriate cost comparisons.
https://www.mercer.com/insights/total-rewards/talent-mobility-insights/cost-of-living/ -
Council for Community and Economic Research — Cost of Living Index.
U.S. city cost-of-living context and a reminder that domestic city comparisons use their own basket definitions.
https://www.coli.org/