

Top 47 Countries by Household Natural Gas Prices, 2026
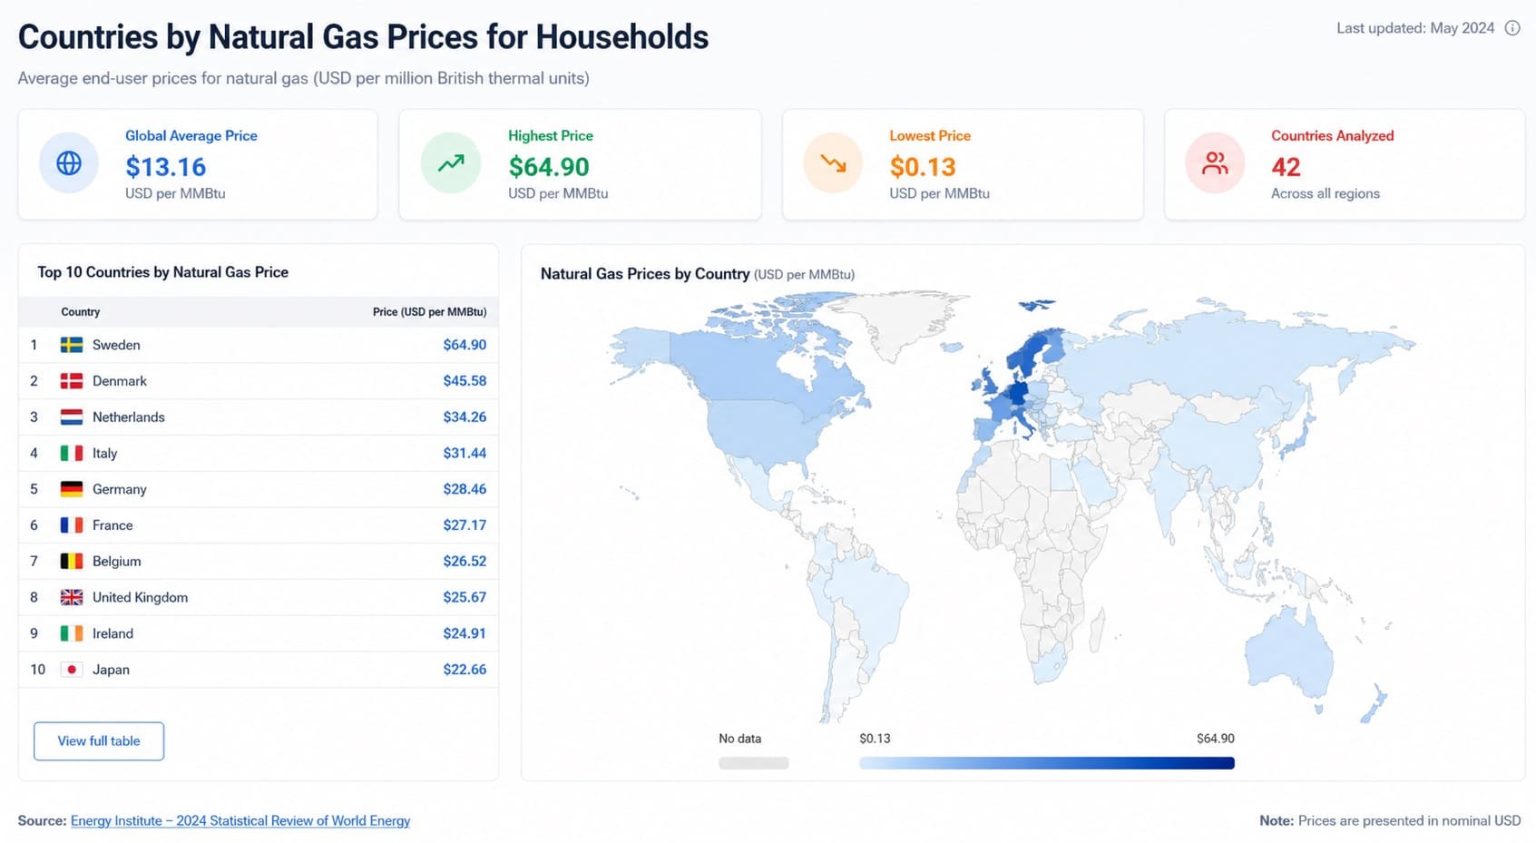
Where Household Natural Gas Costs Are Highest and Lowest
Sweden has the highest household natural gas price in this 47-entry comparison at $0.221 per kWh, followed by Brazil at $0.204 and Singapore at $0.189. Algeria has the lowest listed price at $0.003 per kWh.
The prices come from the GlobalPetrolPrices household comparison for December 2025. The calculation uses annual consumption of 30,000 kWh, includes the charges shown on the gas bill and converts the results to U.S. dollars per kWh.
GlobalPetrolPrices is a private data publisher rather than a government statistical agency. The figures should therefore be read as a cross-country price comparison, not as a single official international series.
Sweden, per kWh.
Algeria, per kWh.
Middle value in the 47-entry table.
Countries and economies in the public table.
Accessed July 11, 2026.
What the Price Measure Shows
The ranking compares the cost of delivered household natural gas per unit of energy. It does not compare annual household bills. Total spending also depends on climate, building size, insulation, heating equipment, consumption and access to a gas network.
Retail prices combine fuel costs, transmission and distribution charges, taxes, levies, regulated tariffs and subsidies. Exchange rates also affect the order because every price is shown in U.S. dollars.
The annual consumption level of 30,000 kWh matters. Fixed charges and tariff bands can produce a different price per kWh for households that use substantially less or more gas.
Household Natural Gas Prices Across 47 Countries and Economies
Rank 1 represents the highest price. Broad geographic regions follow World Bank groupings, with Hong Kong and Taiwan included in East Asia & Pacific.
Showing 47 of 47 matching entries
Household natural gas price in USD per kWh
| Rank | Country or economy | Price | Region |
|---|---|---|---|
| 1 | Sweden | $0.221/kWh | Europe & Central Asia |
| 2 | Brazil | $0.204/kWh | Latin America & Caribbean |
| 3 | Singapore | $0.189/kWh | East Asia & Pacific |
| 4 | Switzerland | $0.182/kWh | Europe & Central Asia |
| 5 | Portugal | $0.151/kWh | Europe & Central Asia |
| 6 | Austria | $0.148/kWh | Europe & Central Asia |
| 7 | Italy | $0.141/kWh | Europe & Central Asia |
| 8 | France | $0.137/kWh | Europe & Central Asia |
| 9 | Netherlands | $0.131/kWh | Europe & Central Asia |
| 10 | Chile | $0.130/kWh | Latin America & Caribbean |
| 11 | Hong Kong | $0.130/kWh | East Asia & Pacific |
| 12 | Denmark | $0.121/kWh | Europe & Central Asia |
| 13 | Ireland | $0.121/kWh | Europe & Central Asia |
| 14 | Poland | $0.119/kWh | Europe & Central Asia |
| 15 | Germany | $0.113/kWh | Europe & Central Asia |
| 16 | Australia | $0.107/kWh | East Asia & Pacific |
| 17 | Czechia | $0.101/kWh | Europe & Central Asia |
| 18 | Spain | $0.099/kWh | Europe & Central Asia |
| 19 | Hungary | $0.098/kWh | Europe & Central Asia |
| 20 | New Zealand | $0.095/kWh | East Asia & Pacific |
| 21 | Barbados | $0.094/kWh | Latin America & Caribbean |
| 22 | United Kingdom | $0.088/kWh | Europe & Central Asia |
| 23 | Belgium | $0.087/kWh | Europe & Central Asia |
| 24 | Colombia | $0.076/kWh | Latin America & Caribbean |
| 25 | Japan | $0.076/kWh | East Asia & Pacific |
| 26 | Greece | $0.074/kWh | Europe & Central Asia |
| 27 | South Korea | $0.073/kWh | East Asia & Pacific |
| 28 | Slovakia | $0.064/kWh | Europe & Central Asia |
| 29 | China | $0.051/kWh | East Asia & Pacific |
| 30 | India | $0.048/kWh | South Asia |
| 31 | United States | $0.048/kWh | North America |
| 32 | Serbia | $0.045/kWh | Europe & Central Asia |
| 33 | Taiwan | $0.044/kWh | East Asia & Pacific |
| 34 | Mexico | $0.035/kWh | Latin America & Caribbean |
| 35 | Canada | $0.034/kWh | North America |
| 36 | Tunisia | $0.031/kWh | Middle East & North Africa |
| 37 | Malaysia | $0.029/kWh | East Asia & Pacific |
| 38 | Argentina | $0.022/kWh | Latin America & Caribbean |
| 39 | Türkiye | $0.020/kWh | Europe & Central Asia |
| 40 | Ukraine | $0.020/kWh | Europe & Central Asia |
| 41 | Azerbaijan | $0.016/kWh | Europe & Central Asia |
| 42 | Bahrain | $0.013/kWh | Middle East & North Africa |
| 43 | Egypt | $0.012/kWh | Middle East & North Africa |
| 44 | Bangladesh | $0.011/kWh | South Asia |
| 45 | Russia | $0.010/kWh | Europe & Central Asia |
| 46 | Belarus | $0.007/kWh | Europe & Central Asia |
| 47 | Algeria | $0.003/kWh | Middle East & North Africa |
Equal prices shown to three decimal places are ordered alphabetically.
Top 20 Household Gas Prices
Sweden and Brazil are the only entries above $0.20 per kWh. Italy ranks seventh at $0.141, while New Zealand closes the Top 20 at $0.095.
Methodology and Limitations
Price and household use
The table measures household natural gas prices in current U.S. dollars per kWh for annual consumption of 30,000 kWh, equal to 108 GJ.
Data period and coverage
The public price table contains 47 countries and economies. A related source map describes coverage of 48 countries, but it does not display an additional country and price that can be added to this table.
Ordering and calculations
Prices are ordered from highest to lowest. Ties at the displayed three-decimal precision are ordered alphabetically. The median is $0.076 per kWh, and the simple average is approximately $0.082.
Regions and interpretation
Regions follow broad World Bank geographic groupings. Currency movements, tariff bands, fixed charges, subsidies and local pricing rules can all affect a country's position.
The metric does not measure annual household spending, income-adjusted affordability, purchasing power, gas-network access or building efficiency.
Key Findings from the Ranking
Sweden leads by a narrow margin
Sweden's $0.221 per kWh is 8.3% above Brazil and 16.9% above Singapore. The difference becomes much larger between fourth-ranked Switzerland and fifth-ranked Portugal.
European markets dominate the top ten
Seven of the ten highest-priced entries are in Europe & Central Asia. Brazil, Singapore and Chile are the three exceptions.
Europe has the largest regional presence
Europe & Central Asia accounts for 24 of the 47 entries. East Asia & Pacific has nine, Latin America & Caribbean six, Middle East & North Africa four, and North America and South Asia two each.
Prices span a very wide range
The top ten range from $0.130 to $0.221 per kWh, while the bottom ten range from $0.003 to $0.022.
How to Interpret the Results
A higher rank means a higher price for the 30,000 kWh household profile. It does not necessarily mean that households spend more each year because gas use varies with weather, housing conditions and heating needs.
Low prices may reflect domestic production, regulated tariffs or subsidies. High prices may reflect taxation, network investment, import dependence or other national energy policies.
Exchange-rate changes can also move a country up or down the table even when its local-currency tariff changes only slightly.
Frequently Asked Questions
Which country has the highest household natural gas price?
Sweden ranks first at $0.221 per kWh.
Which country has the lowest price in the table?
Algeria ranks 47th at $0.003 per kWh.
Are these 2026 gas prices?
The page is the 2026 edition, but the prices refer to December 2025.
Why does the table contain 47 entries when another source page mentions 48?
The public price table contains 47 countries and economies. The related map mentions 48-country coverage but does not show another country and price that can be included in the ranking.
Are these government statistics?
No. The figures come from a private cross-country price database that standardizes household prices for comparison.
Does the price include taxes and network charges?
The source states that the household figure includes the charges shown on the natural gas bill.
Can this ranking be used to compare affordability?
Not by itself. Affordability also depends on income, consumption, climate, housing efficiency and fixed charges.
Sources
GlobalPetrolPrices — Natural gas prices
Country and economy prices, unit, household consumption level and bill coverage.
GlobalPetrolPrices — Household gas map
Additional coverage information for the international household price comparison.
World Bank — Country and lending groups
Reference for the broad geographic regions used in the filters and regional summaries.
Eurostat — Household gas prices
European context for household gas-price reporting and consumption bands. Eurostat values are not combined with the ranking values.
