

Top 100 Countries by Electricity Reliability and Outage Time
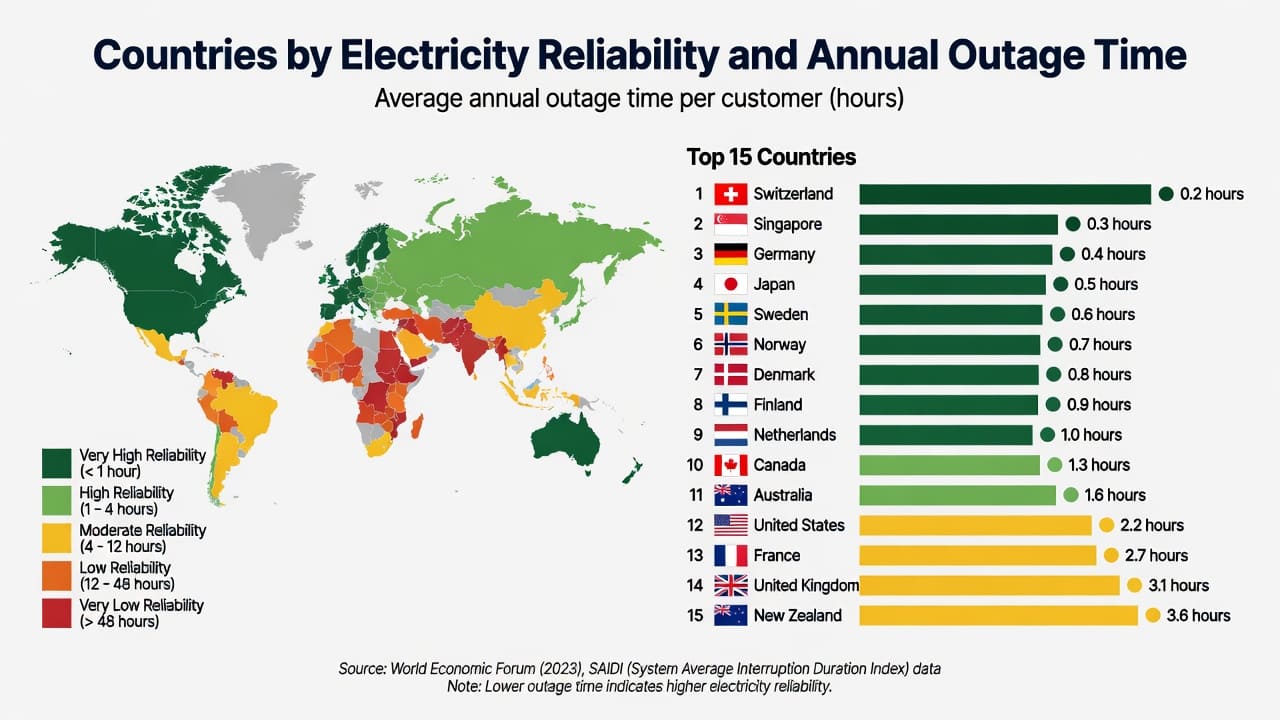
2019 SAIDI Benchmark for Selected Electricity Utilities
This ranking compares the average duration of electricity interruptions reported for the utility serving the World Bank Doing Business case in each economy. The case was usually located in the largest business city, so the figures should not be treated as measurements of the entire national grid.
SAIDI is measured in hours per customer-year. A lower SAIDI value means customers covered by the reported utility experienced less cumulative outage time. The figures come from the World Bank Doing Business historical dataset and describe conditions reported for 2019, not current performance or a 2026 forecast.
Singapore has the lowest value in the table.
Japan's value is equivalent to about one minute.
El Salvador is the 100th economy in the ranking.
The midpoint is about 59.1 minutes per customer-year.
How to Read the Ranking
A SAIDI value of 0.50 hours means customers served by the reported utility experienced an average of 30 minutes of cumulative interruption time during the year. A value of 5 hours means an average of five cumulative hours.
SAIDI measures duration, not frequency. Two utilities can have the same SAIDI even when one experienced a single long interruption and the other experienced several shorter interruptions. Outage frequency is normally measured with SAIFI.
The metric does not measure electricity access, voltage quality, electricity prices, generation capacity or the reliability of every local network within an economy.
Ten Lowest Reported Values
The first ten economies all have values of 0.22 hours or less. That is equal to no more than 13.2 minutes of cumulative interruption time per customer-year.
Top 10 by shortest reported interruption duration
| Rank | Economy | SAIDI | Region / group |
|---|---|---|---|
| 1 | Singapore | 0 h | East Asia & Pacific |
| 2 | Japan | 0.017 h | High income: OECD |
| 3 | Liechtenstein | 0.08 h | Europe & Central Asia |
| 4 | South Korea | 0.09 h | High income: OECD |
| 5 | Kuwait | 0.11 h | Middle East & North Africa |
| 6 | Seychelles | 0.11 h | Sub-Saharan Africa |
| 7 | Saint Lucia | 0.17 h | Latin America & Caribbean |
| 8 | Germany | 0.18 h | High income: OECD |
| 9 | Switzerland | 0.21 h | High income: OECD |
| 10 | France | 0.22 h | High income: OECD |
Lower values rank higher. Equal values are ordered alphabetically.
Top 20 Comparison
The chart shows cumulative annual interruption time. Shorter bars indicate lower reported outage duration.
Why Reliability Differs
Electricity interruption duration reflects both network conditions and the way interruptions are recorded. A low value may result from strong network redundancy, fast restoration or a service area with fewer weather and infrastructure risks.
Network design
Alternative feeders, automated switching and underground cables can limit the number of customers affected and shorten restoration time.
Weather exposure
Storms, flooding, extreme heat, vegetation and the share of overhead lines can increase interruption duration.
Maintenance and response
Asset condition, monitoring, spare equipment, repair crews and fault-location systems affect how quickly service returns.
Reporting rules
Figures can differ depending on how planned interruptions, short outages and major weather events are counted.
Methodology
The table uses the World Bank Doing Business indicator “System average interruption duration index (SAIDI),” expressed in hours per customer-year. Values were sorted from lowest to highest without averaging or estimating missing figures.
Source
The figures come from the corrected World Bank Doing Business historical dataset through Doing Business 2020. The file was accessed on July 11, 2026.
Coverage
The 2019 file contains 143 usable entries after missing values and separate city entries are removed. This page shows the 100 lowest values.
Which entries are included
The table keeps one main entry for each economy. Separate city observations for China, India, Indonesia, Japan, Mexico, Russia, the United States and Brazil are omitted to avoid duplicate listings.
Names and classifications
Some names are shortened for readability, such as South Korea, Russia, Czechia and Laos. The Region / group column follows the classification in the World Bank file, including “High income: OECD.”
The utility serving the Doing Business case was normally located in the largest business city. Results may therefore differ from conditions in other cities, rural areas or utilities within the same economy.
Equal values are ordered alphabetically. The ranking does not measure outage frequency, electricity access, voltage quality, prices, national generation capacity or present-day grid performance.
Full Ranking
Search by economy, filter by region or group, change the order or limit the number of results. Top 10 and Top 20 are applied after the active filters.
Showing 100 rows.
Top 100 values from the 2019 World Bank dataset
| Rank | Economy | SAIDI | Region / group |
|---|---|---|---|
| 1 | Singapore | 0 h | East Asia & Pacific |
| 2 | Japan | 0.017 h | High income: OECD |
| 3 | Liechtenstein | 0.08 h | Europe & Central Asia |
| 4 | South Korea | 0.09 h | High income: OECD |
| 5 | Kuwait | 0.11 h | Middle East & North Africa |
| 6 | Seychelles | 0.11 h | Sub-Saharan Africa |
| 7 | Saint Lucia | 0.17 h | Latin America & Caribbean |
| 8 | Germany | 0.18 h | High income: OECD |
| 9 | Switzerland | 0.21 h | High income: OECD |
| 10 | France | 0.22 h | High income: OECD |
| 11 | Belarus | 0.24 h | Europe & Central Asia |
| 12 | Uzbekistan | 0.24 h | Europe & Central Asia |
| 13 | United Arab Emirates | 0.26 h | Middle East & North Africa |
| 14 | United Kingdom | 0.27 h | High income: OECD |
| 15 | Taiwan, China | 0.28 h | East Asia & Pacific |
| 16 | Ireland | 0.29 h | High income: OECD |
| 17 | Cyprus | 0.30 h | Europe & Central Asia |
| 18 | San Marino | 0.32 h | Europe & Central Asia |
| 19 | Russia | 0.331 h | Europe & Central Asia |
| 20 | Estonia | 0.34 h | High income: OECD |
| 21 | Hong Kong SAR, China | 0.34 h | East Asia & Pacific |
| 22 | Qatar | 0.35 h | Middle East & North Africa |
| 23 | Luxembourg | 0.36 h | High income: OECD |
| 24 | Lithuania | 0.38 h | High income: OECD |
| 25 | Thailand | 0.47 h | East Asia & Pacific |
| 26 | Morocco | 0.48 h | Middle East & North Africa |
| 27 | Spain | 0.48 h | High income: OECD |
| 28 | Italy | 0.49 h | High income: OECD |
| 29 | Iceland | 0.51 h | High income: OECD |
| 30 | Brunei | 0.52 h | East Asia & Pacific |
| 31 | Denmark | 0.52 h | High income: OECD |
| 32 | Czechia | 0.54 h | High income: OECD |
| 33 | Finland | 0.55 h | High income: OECD |
| 34 | Netherlands | 0.55 h | High income: OECD |
| 35 | Portugal | 0.55 h | High income: OECD |
| 36 | Sweden | 0.57 h | High income: OECD |
| 37 | Dominica | 0.58 h | Latin America & Caribbean |
| 38 | Slovenia | 0.59 h | High income: OECD |
| 39 | Mexico | 0.5926 h | Latin America & Caribbean |
| 40 | Belgium | 0.66 h | High income: OECD |
| 41 | Malaysia | 0.68 h | East Asia & Pacific |
| 42 | Austria | 0.69 h | High income: OECD |
| 43 | Norway | 0.70 h | High income: OECD |
| 44 | Namibia | 0.74 h | Sub-Saharan Africa |
| 45 | Kazakhstan | 0.84 h | Europe & Central Asia |
| 46 | Azerbaijan | 0.87 h | Europe & Central Asia |
| 47 | China | 0.8955 h | East Asia & Pacific |
| 48 | Angola | 0.90 h | Sub-Saharan Africa |
| 49 | Canada | 0.91 h | High income: OECD |
| 50 | Latvia | 0.98 h | High income: OECD |
| 51 | Slovakia | 0.99 h | High income: OECD |
| 52 | Bahrain | 1.14 h | Middle East & North Africa |
| 53 | United States | 1.184 h | High income: OECD |
| 54 | Israel | 1.19 h | High income: OECD |
| 55 | Australia | 1.21 h | High income: OECD |
| 56 | Moldova | 1.28 h | Europe & Central Asia |
| 57 | Poland | 1.31 h | High income: OECD |
| 58 | Panama | 1.59 h | Latin America & Caribbean |
| 59 | Mauritius | 1.61 h | Sub-Saharan Africa |
| 60 | Costa Rica | 1.78 h | Latin America & Caribbean |
| 61 | Saudi Arabia | 1.87 h | Middle East & North Africa |
| 62 | Greece | 1.90 h | High income: OECD |
| 63 | Romania | 2.05 h | Europe & Central Asia |
| 64 | Ecuador | 2.29 h | Latin America & Caribbean |
| 65 | Chile | 2.30 h | High income: OECD |
| 66 | Jordan | 2.38 h | Middle East & North Africa |
| 67 | Bosnia and Herzegovina | 2.44 h | Europe & Central Asia |
| 68 | Egypt | 2.52 h | Middle East & North Africa |
| 69 | Solomon Islands | 2.60 h | East Asia & Pacific |
| 70 | Hungary | 2.84 h | High income: OECD |
| 71 | Oman | 2.84 h | Middle East & North Africa |
| 72 | New Zealand | 2.90 h | High income: OECD |
| 73 | Sri Lanka | 3.20 h | South Asia |
| 74 | Tunisia | 3.41 h | Middle East & North Africa |
| 75 | Argentina | 3.69 h | Latin America & Caribbean |
| 76 | Armenia | 3.70 h | Europe & Central Asia |
| 77 | Guatemala | 3.71 h | Latin America & Caribbean |
| 78 | Ukraine | 3.75 h | Europe & Central Asia |
| 79 | Vietnam | 3.87 h | East Asia & Pacific |
| 80 | Philippines | 3.91 h | East Asia & Pacific |
| 81 | Indonesia | 3.9528 h | East Asia & Pacific |
| 82 | India | 4.0342 h | South Asia |
| 83 | Algeria | 4.24 h | Middle East & North Africa |
| 84 | Serbia | 4.34 h | Europe & Central Asia |
| 85 | Barbados | 4.47 h | Latin America & Caribbean |
| 86 | Colombia | 4.60 h | Latin America & Caribbean |
| 87 | Croatia | 4.75 h | Europe & Central Asia |
| 88 | Laos | 4.83 h | East Asia & Pacific |
| 89 | Tajikistan | 4.88 h | Europe & Central Asia |
| 90 | Iran | 5.10 h | Middle East & North Africa |
| 91 | The Bahamas | 5.28 h | Latin America & Caribbean |
| 92 | Bhutan | 5.39 h | South Asia |
| 93 | West Bank and Gaza | 5.43 h | Middle East & North Africa |
| 94 | Uruguay | 5.50 h | Latin America & Caribbean |
| 95 | Trinidad and Tobago | 5.70 h | Latin America & Caribbean |
| 96 | Georgia | 5.80 h | Europe & Central Asia |
| 97 | Bulgaria | 6.15 h | Europe & Central Asia |
| 98 | North Macedonia | 6.23 h | Europe & Central Asia |
| 99 | Antigua and Barbuda | 6.50 h | Latin America & Caribbean |
| 100 | El Salvador | 6.68 h | Latin America & Caribbean |
All values refer to the 2019 survey year. Lower values indicate shorter cumulative interruption duration.
Key Findings
Top 20 remain below 21 minutes
Every economy in the Top 20 has a value of 0.34 hours or less.
The midpoint is close to one hour
The median of the Top 100 is 0.985 hours, or about 59.1 minutes.
OECD high-income economies are prominent
The “High income: OECD” group accounts for 34 of the 100 entries.
Small differences need caution
Neighboring ranks can differ by only a few minutes, while reporting rules and service areas may not be identical.
What the Ranking Shows
The table provides a historical comparison of cumulative interruption duration for the utilities covered by the Doing Business electricity case. It can show which reported values were relatively low and how wide the spread was across the selected economies.
It should not be used as a complete measure of power-sector quality. A high or low position does not describe electricity access, prices, generation capacity, outage frequency or performance across every utility in the economy.
For current operational or investment decisions, the latest SAIDI and SAIFI reports from the relevant regulator or distribution utility are more appropriate.
Download the Top 100 Countries by Electricity Reliability and Outage Time dataset
Top 100 Countries by Electricity Reliability and Outage Time
100 ranked entries · Excel + CSV + methodology + sources + chart · Snapshot: World Bank Doing Business 2020 dataset, 2019 SAIDI · Version 1.0
The archive includes machine-readable data, methodology and source documentation. Quick human verification is required before the ZIP is delivered. Full Data Pack downloads require a free account. Free accounts can download 1 different Data Pack every 30 days; re-downloading the same pack does not use another slot. Annual Data Access provides unlimited manual downloads while annual access is active.
Download Excel + CSV Data PackFrequently Asked Questions
What does SAIDI measure?
SAIDI measures the average cumulative duration of electricity interruptions experienced by a customer during a year.
Does a lower value mean better reliability?
Yes. A lower value means less cumulative interruption time for customers covered by the reported utility.
Does the table represent entire national grids?
No. The value usually refers to the utility serving the Doing Business case in the largest business city. Conditions elsewhere in the economy may differ.
Are these current figures?
No. The values describe the 2019 survey year. July 11, 2026 is the date the historical dataset was accessed.
Why are only 100 economies shown?
After removing missing and separate city entries, 143 usable entries remained. This page shows the 100 lowest values.
Does SAIDI show how often outages occur?
No. SAIDI measures duration. Outage frequency is normally measured with SAIFI.
How are equal values ranked?
Economies with the same value are ordered alphabetically.
Why is “High income: OECD” shown as a group?
That wording follows the classification used in the World Bank historical dataset.
Sources
World Bank Doing Business Historical Dataset
Source of the values used in the ranking.
World Bank SAIDI Metadata
Definition, unit and survey-year notes for the indicator.
Getting Electricity Methodology
Explanation of the business case, utility coverage and reliability indicators.
World Bank Statement on Doing Business
Confirms that the Doing Business report was discontinued in September 2021.
Related rankings
Closely related StatRanker ranking and data pages selected by topic, entity scope and category. Fewer links are shown when strong matches are limited.
