

Top 99 Countries by Net Average Salary After Tax, 2026
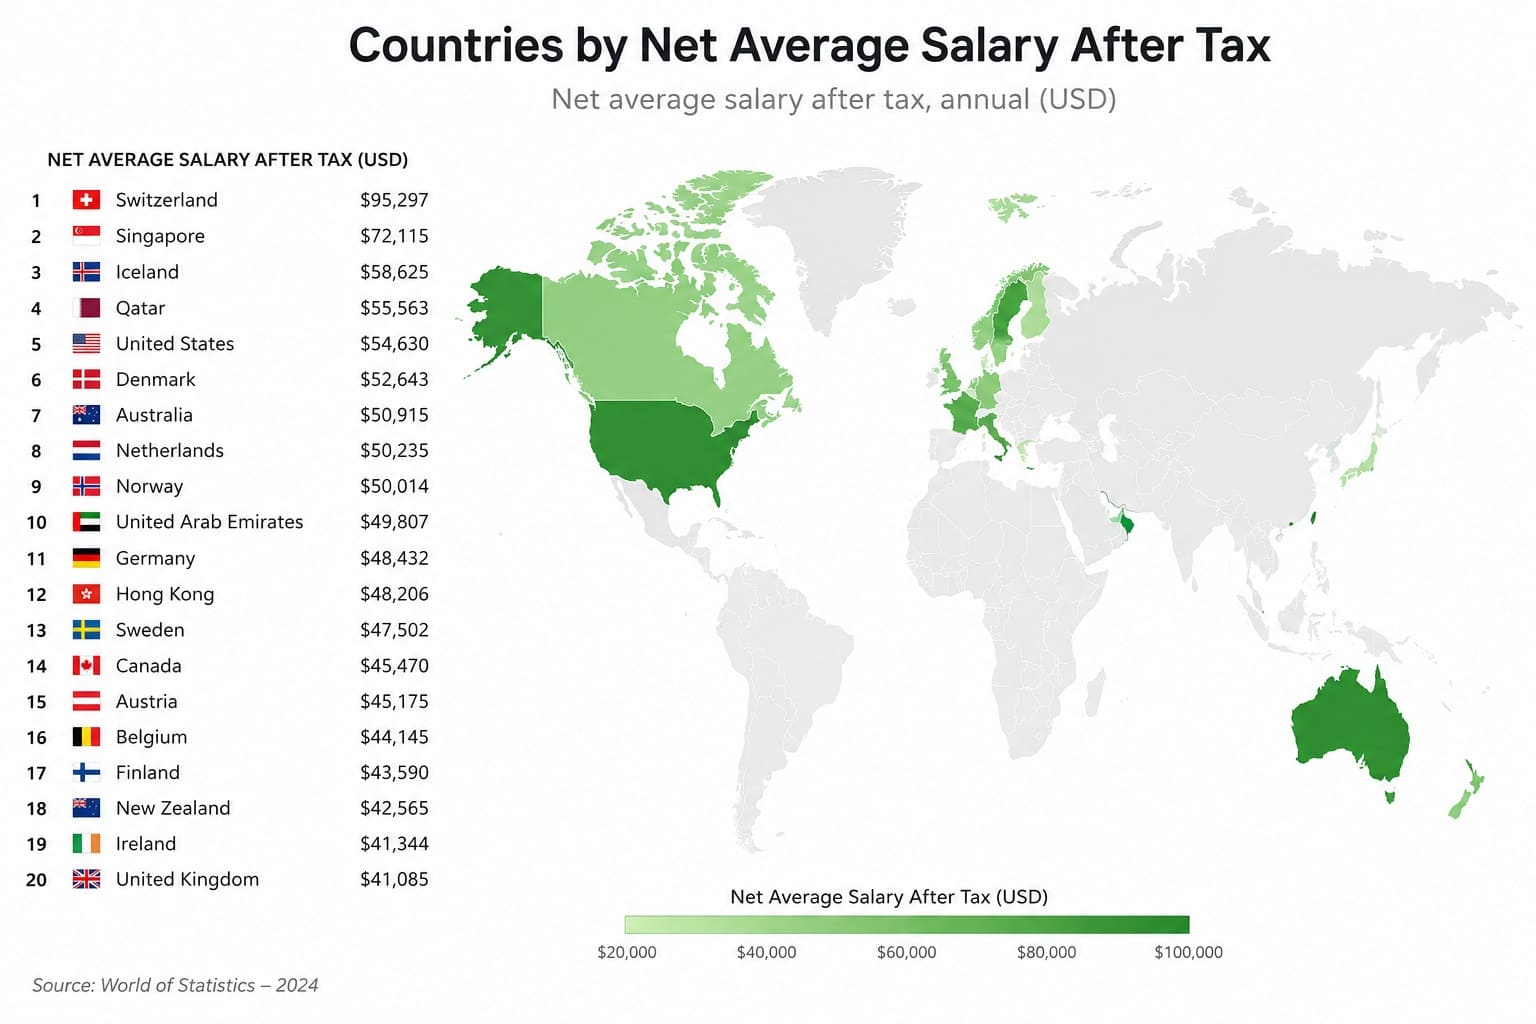
Numbeo-Based Salary Snapshot: Average Monthly Pay After Tax
Switzerland ranks first in this Top 99 comparison, with an average monthly net salary after tax of $7,418.13. The metric is average monthly take-home salary after income taxes as represented by Numbeo, displayed in U.S. dollars.
Numbeo’s table for “Average Monthly Net Salary (After Tax), Salaries And Financing” was updated on June 18, 2026. The source describes the table as a rolling dataset based on information collected within the last 12 months and shown only where enough country-level input is available.
This is a current salary benchmark from Numbeo, not an official government wage release. Data status: 99 industry_observed_value rows, 0 official_value, 0 calculated_value, 0 official_forecast and 0 modeled_projection. Use it to compare reported take-home salary levels, then check official wage series, tax rules and cost-of-living data before making employment or relocation decisions.
Answer first: Switzerland is #1 at $7,418.13 per month. The metric is average monthly net salary after tax. The source is Numbeo, updated June 18, 2026. The main limitation is that this is not official government wage data.
Switzerland leads by average monthly net salary after tax.
Lowest listed value$36.42Cuba is the lowest entry among the 99 rows in this source snapshot.
Coverage99The title remains Top 99 because the source provides 99 entries for this metric.
Median in table$1,064.10This site-calculated median uses the 99 displayed rows; the middle row is Turkey.
Overview: what average monthly net salary after tax means
This ranking compares average monthly net salary after tax by country and territory. In this article, net salary means take-home salary after income taxes as represented in the Numbeo salary item.
The values are displayed in U.S. dollars for a single-currency comparison. Because the ranking is nominal, a higher number does not automatically mean stronger purchasing power or higher savings after housing and daily costs.
The page is most useful as a quick cross-country salary reference. It should be read alongside rent, consumer prices, tax residency rules, healthcare costs, employment sector and local currency conditions.
What this metric does not measure
This salary ranking does not measure median pay, gross salary, household income, disposable income after rent, purchasing power parity, public benefits, unpaid work, informal income, unemployment, wage inequality or the quality of public services.
It also does not show whether a country is affordable for a specific worker. A high salary can be offset by high rent, childcare, healthcare, transport or service prices, while a lower salary can stretch further in a lower-cost market.
Top 10 countries by average monthly net salary after tax
The top ten are concentrated among high-income European economies, North America, Gulf economies, Singapore, Israel and Australia. Ranking is calculated from the numeric U.S.-dollar value, descending.
Top 10 entries in the June 18, 2026 source snapshot
| Rank | Entity | Value | Region / note |
|---|---|---|---|
| 1 | Switzerland | $7,418.13 | Europe; Numbeo; Jun. 18, 2026. |
| 2 | Luxembourg | $5,515.04 | Europe; Numbeo; Jun. 18, 2026. |
| 3 | United States | $4,305.20 | America; Numbeo; Jun. 18, 2026. |
| 4 | Denmark | $4,231.00 | Europe; Numbeo; Jun. 18, 2026. |
| 5 | Singapore | $4,092.95 | Asia; Numbeo; Jun. 18, 2026. |
| 6 | Israel | $4,083.14 | Asia; Numbeo; Jun. 18, 2026. |
| 7 | Qatar | $4,073.57 | Asia; Numbeo; Jun. 18, 2026. |
| 8 | Norway | $4,062.20 | Europe; Numbeo; Jun. 18, 2026. |
| 9 | Australia | $4,034.69 | Oceania; Numbeo; Jun. 18, 2026. |
| 10 | Netherlands | $3,804.19 | Europe; Numbeo; Jun. 18, 2026. |
All rows use the same metric: average monthly net salary after tax, displayed in U.S. dollars.
Chart: Top 20 salary-after-tax entries
The bar chart uses the same monthly net salary values as the ranking table. Switzerland is the clear leader, Luxembourg is second, and the rest of the Top 20 mostly falls between about $2,900 and $4,305 per month.
Switzerland$7,418 Luxembourg$5,515 United States$4,305 Denmark$4,231 Singapore$4,093 Israel$4,083 Qatar$4,074 Norway$4,062 Australia$4,035 Netherlands$3,804 Ireland$3,577 Germany$3,317 United Kingdom$3,270 Hong Kong (China)$3,205 Sweden$3,170 Austria$3,031 Belgium$3,010 Finland$3,009 Canada$2,930 United Arab Emirates$2,924 Chart summary: Switzerland leads with $7,418 per month, Luxembourg is second with $5,515, and the 20th entry is the United Arab Emirates at $2,924.Methodology
Metric and unit
Metric: average monthly net salary after tax. Unit: U.S. dollars per month as displayed by the source. Direction: higher values rank higher.
Source and freshness
The numeric source is Numbeo’s country salary table. The update date used here is June 18, 2026, and the source states that the values are based on information collected within the last 12 months.
Contributor model
Numbeo combines contributor input with manually gathered information from selected sources, then applies automatic and semi-automatic filters before publishing country-level values.
Country aggregation
Country figures are built from city-level information where the source has enough input. The source describes a weighted country calculation rather than a simple average of city pages.
Ranks are ordered from highest to lowest salary value. Table values keep the cents shown in the source, while the chart rounds values to whole dollars for readability.
Values are displayed in U.S. dollars. Exchange-rate changes can affect the apparent ranking, especially in countries with volatile currencies or high inflation.
All rows come from the same source and should be read as Numbeo salary values rather than official national wage statistics.
Why countries differ in net salary rankings
Labor market and industry mix
Countries with large finance, technology, professional services, energy, pharmaceuticals or high-value manufacturing sectors often show higher average salary levels.
Tax and social insurance systems
Take-home pay depends on income taxes and payroll contributions. Two countries with similar gross salaries can rank differently after tax.
Cost of living
Salary alone does not show affordability. Rent, healthcare, transport, childcare and everyday services can change how far monthly pay goes.
Coverage and exchange rates
Rolling data, contributor coverage and USD conversion can shift rankings over time, especially where currencies move sharply.
Main ranking: Top 99 countries and territories by net salary after tax
Use the controls to search by country or territory, filter by region, change sort order or switch between Top 10, Top 20 and all 99 entries.
AllAfricaAmericaAsiaEuropeOceania Rank orderValue high-lowValue low-highName A-Z Top 10Top 20AllAverage monthly net salary after tax, USD per month
| Rank | Entity | Value | Region / note |
|---|---|---|---|
| 1 | Switzerland | $7,418.13 | Europe; Numbeo; Jun. 18, 2026. |
| 2 | Luxembourg | $5,515.04 | Europe; Numbeo; Jun. 18, 2026. |
| 3 | United States | $4,305.20 | America; Numbeo; Jun. 18, 2026. |
| 4 | Denmark | $4,231.00 | Europe; Numbeo; Jun. 18, 2026. |
| 5 | Singapore | $4,092.95 | Asia; Numbeo; Jun. 18, 2026. |
| 6 | Israel | $4,083.14 | Asia; Numbeo; Jun. 18, 2026. |
| 7 | Qatar | $4,073.57 | Asia; Numbeo; Jun. 18, 2026. |
| 8 | Norway | $4,062.20 | Europe; Numbeo; Jun. 18, 2026. |
| 9 | Australia | $4,034.69 | Oceania; Numbeo; Jun. 18, 2026. |
| 10 | Netherlands | $3,804.19 | Europe; Numbeo; Jun. 18, 2026. |
| 11 | Ireland | $3,577.06 | Europe; Numbeo; Jun. 18, 2026. |
| 12 | Germany | $3,316.73 | Europe; Numbeo; Jun. 18, 2026. |
| 13 | United Kingdom | $3,269.58 | Europe; Numbeo; Jun. 18, 2026. |
| 14 | Hong Kong (China) | $3,205.39 | Asia; Numbeo; Jun. 18, 2026. |
| 15 | Sweden | $3,169.58 | Europe; Numbeo; Jun. 18, 2026. |
| 16 | Austria | $3,031.07 | Europe; Numbeo; Jun. 18, 2026. |
| 17 | Belgium | $3,010.45 | Europe; Numbeo; Jun. 18, 2026. |
| 18 | Finland | $3,008.84 | Europe; Numbeo; Jun. 18, 2026. |
| 19 | Canada | $2,930.04 | America; Numbeo; Jun. 18, 2026. |
| 20 | United Arab Emirates | $2,924.01 | Asia; Numbeo; Jun. 18, 2026. |
| 21 | New Zealand | $2,901.15 | Oceania; Numbeo; Jun. 18, 2026. |
| 22 | France | $2,818.43 | Europe; Numbeo; Jun. 18, 2026. |
| 23 | Puerto Rico | $2,711.53 | America; Numbeo; Jun. 18, 2026. |
| 24 | Oman | $2,472.12 | Asia; Numbeo; Jun. 18, 2026. |
| 25 | Bahrain | $2,230.31 | Asia; Numbeo; Jun. 18, 2026. |
| 26 | South Korea | $2,036.23 | Asia; Numbeo; Jun. 18, 2026. |
| 27 | Spain | $2,016.22 | Europe; Numbeo; Jun. 18, 2026. |
| 28 | Italy | $1,946.64 | Europe; Numbeo; Jun. 18, 2026. |
| 29 | Saudi Arabia | $1,891.60 | Asia; Numbeo; Jun. 18, 2026. |
| 30 | Estonia | $1,888.20 | Europe; Numbeo; Jun. 18, 2026. |
| 31 | Cyprus | $1,865.89 | Europe; Numbeo; Jun. 18, 2026. |
| 32 | Japan | $1,861.48 | Asia; Numbeo; Jun. 18, 2026. |
| 33 | Malta | $1,826.30 | Europe; Numbeo; Jun. 18, 2026. |
| 34 | Czech Republic | $1,804.97 | Europe; Numbeo; Jun. 18, 2026. |
| 35 | Slovenia | $1,758.98 | Europe; Numbeo; Jun. 18, 2026. |
| 36 | Taiwan | $1,752.34 | Asia; Numbeo; Jun. 18, 2026. |
| 37 | Poland | $1,703.47 | Europe; Numbeo; Jun. 18, 2026. |
| 38 | Lithuania | $1,585.32 | Europe; Numbeo; Jun. 18, 2026. |
| 39 | Croatia | $1,567.91 | Europe; Numbeo; Jun. 18, 2026. |
| 40 | South Africa | $1,539.35 | Africa; Numbeo; Jun. 18, 2026. |
| 41 | Hungary | $1,430.05 | Europe; Numbeo; Jun. 18, 2026. |
| 42 | Slovakia | $1,337.05 | Europe; Numbeo; Jun. 18, 2026. |
| 43 | Portugal | $1,330.07 | Europe; Numbeo; Jun. 18, 2026. |
| 44 | Latvia | $1,310.64 | Europe; Numbeo; Jun. 18, 2026. |
| 45 | Greece | $1,175.08 | Europe; Numbeo; Jun. 18, 2026. |
| 46 | Bulgaria | $1,167.88 | Europe; Numbeo; Jun. 18, 2026. |
| 47 | Uruguay | $1,089.61 | America; Numbeo; Jun. 18, 2026. |
| 48 | Costa Rica | $1,082.99 | America; Numbeo; Jun. 18, 2026. |
| 49 | China | $1,067.86 | Asia; Numbeo; Jun. 18, 2026. |
| 50 | Turkey | $1,064.10 | Asia; Numbeo; Jun. 18, 2026. |
| 51 | Montenegro | $1,047.30 | Europe; Numbeo; Jun. 18, 2026. |
| 52 | Romania | $1,046.07 | Europe; Numbeo; Jun. 18, 2026. |
| 53 | Serbia | $967.07 | Europe; Numbeo; Jun. 18, 2026. |
| 54 | Russia | $951.00 | Europe; Numbeo; Jun. 18, 2026. |
| 55 | Malaysia | $918.01 | Asia; Numbeo; Jun. 18, 2026. |
| 56 | Bosnia And Herzegovina | $839.59 | Europe; Numbeo; Jun. 18, 2026. |
| 57 | Mexico | $811.69 | America; Numbeo; Jun. 18, 2026. |
| 58 | Panama | $803.17 | America; Numbeo; Jun. 18, 2026. |
| 59 | Belarus | $770.00 | Europe; Numbeo; Jun. 18, 2026. |
| 60 | Moldova | $766.78 | Europe; Numbeo; Jun. 18, 2026. |
| 61 | North Macedonia | $761.89 | Europe; Numbeo; Jun. 18, 2026. |
| 62 | Albania | $753.22 | Europe; Numbeo; Jun. 18, 2026. |
| 63 | Mauritius | $748.23 | Africa; Numbeo; Jun. 18, 2026. |
| 64 | Armenia | $742.41 | Asia; Numbeo; Jun. 18, 2026. |
| 65 | Chile | $726.26 | America; Numbeo; Jun. 18, 2026. |
| 66 | Argentina | $720.07 | America; Numbeo; Jun. 18, 2026. |
| 67 | Jordan | $710.91 | Asia; Numbeo; Jun. 18, 2026. |
| 68 | Kazakhstan | $631.33 | Asia; Numbeo; Jun. 18, 2026. |
| 69 | Kosovo (Disputed Territory) | $615.70 | Europe; Numbeo; Jun. 18, 2026. |
| 70 | Dominican Republic | $609.60 | America; Numbeo; Jun. 18, 2026. |
| 71 | Thailand | $581.81 | Asia; Numbeo; Jun. 18, 2026. |
| 72 | Peru | $576.76 | America; Numbeo; Jun. 18, 2026. |
| 73 | Iraq | $574.51 | Asia; Numbeo; Jun. 18, 2026. |
| 74 | Georgia | $565.91 | Asia; Numbeo; Jun. 18, 2026. |
| 75 | Colombia | $526.56 | America; Numbeo; Jun. 18, 2026. |
| 76 | Brazil | $525.76 | America; Numbeo; Jun. 18, 2026. |
| 77 | Uzbekistan | $519.35 | Asia; Numbeo; Jun. 18, 2026. |
| 78 | Ecuador | $519.16 | America; Numbeo; Jun. 18, 2026. |
| 79 | Ukraine | $494.67 | Europe; Numbeo; Jun. 18, 2026. |
| 80 | Morocco | $484.80 | Africa; Numbeo; Jun. 18, 2026. |
| 81 | Azerbaijan | $459.42 | Asia; Numbeo; Jun. 18, 2026. |
| 82 | Bolivia | $450.97 | America; Numbeo; Jun. 18, 2026. |
| 83 | India | $431.59 | Asia; Numbeo; Jun. 18, 2026. |
| 84 | Vietnam | $414.32 | Asia; Numbeo; Jun. 18, 2026. |
| 85 | Kenya | $341.99 | Africa; Numbeo; Jun. 18, 2026. |
| 86 | Zimbabwe | $341.67 | Africa; Numbeo; Jun. 18, 2026. |
| 87 | Philippines | $332.53 | Asia; Numbeo; Jun. 18, 2026. |
| 88 | Tunisia | $325.57 | Africa; Numbeo; Jun. 18, 2026. |
| 89 | Algeria | $304.35 | Africa; Numbeo; Jun. 18, 2026. |
| 90 | Indonesia | $261.11 | Asia; Numbeo; Jun. 18, 2026. |
| 91 | Iran | $249.29 | Asia; Numbeo; Jun. 18, 2026. |
| 92 | Bangladesh | $234.19 | Asia; Numbeo; Jun. 18, 2026. |
| 93 | Venezuela | $213.91 | America; Numbeo; Jun. 18, 2026. |
| 94 | Nepal | $209.53 | Asia; Numbeo; Jun. 18, 2026. |
| 95 | Sri Lanka | $209.05 | Asia; Numbeo; Jun. 18, 2026. |
| 96 | Pakistan | $184.61 | Asia; Numbeo; Jun. 18, 2026. |
| 97 | Egypt | $166.27 | Africa; Numbeo; Jun. 18, 2026. |
| 98 | Nigeria | $80.07 | Africa; Numbeo; Jun. 18, 2026. |
| 99 | Cuba | $36.42 | America; Numbeo; Jun. 18, 2026. |
The ranking includes 99 entries because the source provides 99 rows for this metric. A 100th country or territory is not added.
Insights from the Top 99 salary-after-tax ranking
Key insight
Switzerland is a large outlier: its monthly net salary value is more than $1,900 above second-ranked Luxembourg.
Notable pattern
Europe dominates the upper half of the ranking, especially through Western, Northern and Central European economies with high formal-sector wages.
Regional concentration
The Top 20 combines Europe with North America, Gulf economies, Singapore, Israel, Hong Kong, Australia and New Zealand.
Outlier
Singapore ranks fifth despite its small population, reflecting a high-wage services and business-hub profile in the salary item.
What this ranking means for readers
This ranking helps compare nominal monthly take-home salary levels across countries and territories. It answers where reported average net salaries are highest, but it does not answer where workers have the highest purchasing power after rent and other costs.
For relocation research, read the salary value together with rent, cost of living, tax residency, work authorization, healthcare coverage, household size and employment sector. A lower salary can still support stronger savings if local costs are much lower.
The safest interpretation is to treat the table as a salary signal, then compare it with local expenses and official labor-market data before making a personal or business decision.
FAQ
Which country has the highest average monthly net salary after tax?
Switzerland ranks first in this Top 99 snapshot, with an average monthly net salary after tax of $7,418.13.
Why is this Top 99 instead of Top 100?
The source table provides 99 entries for this metric. A 100th row is not added because the page does not invent missing countries, territories or values.
Is this official government wage data?
No. The values come from Numbeo’s salary table. They are useful for comparison, but official labor statistics should be checked separately for policy, payroll or legal use.
Is this average salary or median salary?
It is average monthly net salary after tax. Average salary can be influenced by high earners more than a median wage would be.
Is this net salary or gross salary?
This ranking uses net salary after tax. Gross salary is pre-tax pay and can produce a different country order because tax systems vary.
Does the ranking adjust for cost of living?
No. Values are nominal monthly salary figures displayed in U.S. dollars. Rent, groceries, healthcare, transport and local services must be checked separately.
Is this a PPP-adjusted salary ranking?
No. The table is not adjusted for purchasing power parity. Exchange rates and local price levels matter when interpreting the result.
Why can a high-salary country still feel expensive?
High wage levels often come with high housing costs and higher prices for services. Salary after tax should be compared with local expenses before drawing relocation conclusions.
Are territories and special cases included?
Yes. The table follows the source and includes entries such as Hong Kong (China), Puerto Rico and Kosovo (Disputed Territory), where they appear in the ranking.
Sources
Numbeo — Average Monthly Net Salary After Tax by Country
Primary source for the 99 salary values and rank order.
https://www.numbeo.com/cost-of-living/country_price_rankings?itemId=105
Numbeo — Prices by Country table view
Used to check the metric title, update date and note about data collected within the last 12 months.
https://www.numbeo.com/cost-of-living/prices_by_country.jsp?itemId=105
Numbeo — Methodology and Motivation
Explains how Numbeo collects, filters and aggregates country-level data.
https://www.numbeo.com/common/motivation_and_methodology.jsp
Numbeo — Data and API section
Describes Numbeo data products and access options.
Related rankings
Closely related StatRanker pages selected by topic. If no strong match exists, fewer links are shown instead of unrelated recommendations.
