

California Cities by Wildfire Risk, 2026
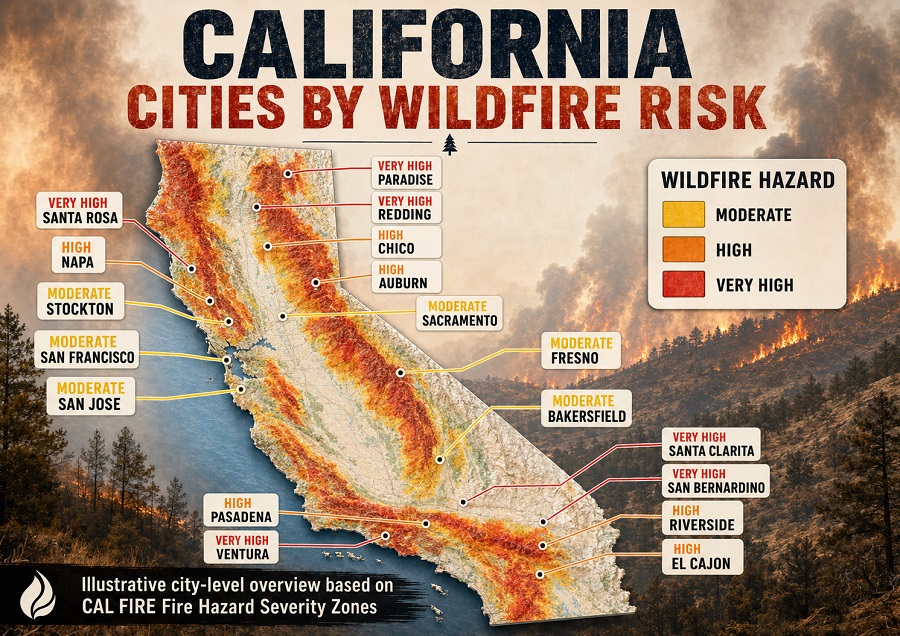
California communities with the highest modeled wildfire risk to homes
This California wildfire risk ranking compares communities by mean Risk to Potential Structures near exposed housing units. The indicator combines modeled wildfire likelihood with expected damage potential for a typical residential structure. It is a relative risk score, not a percentage, not an expected dollar loss and not a forecast of homes that will burn.
The numerical ranking comes from the published Wildfire Risk to California Communities assessment. The article snapshot is paired with the latest available official California Fire Hazard Severity Zone context: State Responsibility Area zones effective April 1, 2024 and Local Responsibility Area recommendations released March 24, 2025. The values should not be read as a new 2026 fire-season prediction.
The ranking covers 25 communities from the source assessment, not a statewide list of all incorporated cities. It includes cities, census-designated places and unincorporated communities because wildfire exposure often peaks at the wildland-urban interface rather than inside formal municipal boundaries.
Continue exploring
More StatRanker rankings on climate, environment, resources and sustainability.
Top 100 Coastal Cities Most Exposed to Sea-Level Rise by 2050
Open rankingTop 100 Cities by Annual PM2.5 Air Pollution, 2025
Open rankingTop 100 Countries by Climate Risk Index (Heat, Floods, Storms), 2025
Open rankingDescanso ranks first by average modeled wildfire risk near exposed housing units.
The ranking covers 25 communities from the published assessment, not every incorporated city in California.
Berry Creek has the highest direct exposure share among the listed communities.
CAL FIRE SRA zones are effective April 1, 2024; LRA recommendations were released March 24, 2025.
What the wildfire risk score measures
Risk to Potential Structures estimates the relative wildfire risk to a home if a home exists at a given location. At the community level, mean RPS summarizes that modeled risk around exposed housing units. A high score usually reflects a severe combination of burn probability, fire intensity, surrounding fuels, terrain and residential exposure.
Wildfire hazard, exposure and risk are related but not identical. Hazard describes the fire environment; exposure describes people, buildings or infrastructure located where fire can affect them; risk combines the chance of wildfire with the expected consequence. Historical damage is different again: it records what has already happened, while RPS models relative risk across the landscape.
Two homes in the same community can still have very different property-level risk. Slope, roof class, vents, defensible space, road access, surrounding structure density, nearby vegetation and ember pathways can all change the risk profile at parcel level.
Top 10 California communities by modeled risk to homes
The upper part of the ranking is dominated by smaller foothill, canyon, mountain and wildland-edge communities. Descanso and Campo reflect San Diego County’s backcountry exposure; Anza and Lake Riverside reflect high-risk inland Riverside County landscapes; Hayfork and Berry Creek show that Northern California communities face similar structural exposure where homes are embedded in burnable terrain.
| Rank | Community | Mean RPS | Key exposure signal |
|---|---|---|---|
| 1 | Descanso | 3.85 | 85.9% directly exposed; 1,077 exposed housing units |
| 2 | Douglas City | 3.69 | 86.7% directly exposed; 750 exposed housing units |
| 3 | Campo | 2.94 | 78.8% directly exposed; 1,627 exposed housing units |
| 4 | Green Valley | 2.91 | 65.8% directly exposed; 430 exposed housing units |
| 5 | Anza | 2.80 | 87.0% directly exposed; 2,124 exposed housing units |
| 6 | Diablo Grande | 2.72 | 98.8% directly exposed; 307 exposed housing units |
| 7 | Lake Riverside | 2.41 | 88.4% directly exposed; 797 exposed housing units |
| 8 | Oak Glen | 2.35 | 87.4% directly exposed; 779 exposed housing units |
| 9 | Hayfork | 2.35 | 80.6% directly exposed; 1,855 exposed housing units |
| 10 | Berry Creek | 2.33 | 99.1% directly exposed; 693 exposed housing units |
“Directly exposed” refers to housing units located in areas where the source assessment identifies direct wildfire exposure. The value should not be read as a forecasted loss rate.
Chart: mean RPS for the highest-risk communities
Descanso and Douglas City stand above the rest of the Top 10 by mean RPS. The next group, from Campo through Berry Creek, shows a narrower range where high direct exposure and severe fire environments are both important. Bars are scaled to the highest listed value, Descanso at 3.85.
- Descanso3.85
- Douglas City3.69
- Campo2.94
- Green Valley2.91
- Anza2.80
- Diablo Grande2.72
- Lake Riverside2.41
- Oak Glen2.35
- Hayfork2.35
- Berry Creek2.33
Methodology
The ranking uses mean Risk to Potential Structures near exposed housing units from the published California community assessment. Risk to Potential Structures combines burn probability with conditional risk to a potential structure. Burn probability estimates the annual likelihood that wildfire reaches a location. Conditional risk estimates the potential consequence to a typical home if wildfire occurs there, based on modeled fire intensity and generalized assumptions about residential vulnerability.
Primary risk metric
Mean RPS ranks communities by the average modeled risk around exposed housing units. Higher values indicate greater relative wildfire risk to a typical home in the exposed part of the community.
How the score works
RPS links likelihood and consequence. It is not a probability, not an insurance premium, not a damage estimate and not a count of structures destroyed.
Snapshot and map context
The numerical ranking comes from the published community assessment. CAL FIRE Fire Hazard Severity Zones are included only as current California hazard-map context, not as a ranking component.
Coverage and place names
The source table ranks communities, not only incorporated cities. Place names are retained as published so that high-risk unincorporated and census-designated communities remain visible.
CAL FIRE Fire Hazard Severity Zones are used for context, not as a ranking component. FHSZ maps classify fire hazard using statewide factors such as fuel loading, slope, fire weather and wind-driven spread. They do not produce a city ranking by themselves. For property decisions, the official FHSZ viewer, local jurisdiction records and parcel-level disclosures should be checked directly.
Values are rounded to two decimal places for mean RPS and to whole housing units for exposed housing. The main comparability limit is scale: a community average can mask large differences between individual parcels. Insurance availability and premiums can also reflect underwriting models, local access, mitigation quality, claims history and property-specific conditions, so they should not be inferred directly from mean RPS.
Full ranking: 25 California communities by modeled wildfire risk to homes
The 25 rows below follow the source ranking by mean RPS. Rank reflects modeled risk near exposed housing units; the first column keeps the original risk order even when the controls change the visible sort or subset.
| Rank | Community | Mean RPS | Exposed housing units |
|---|---|---|---|
| 1 | Descanso | 3.85 | 1,077 |
| 2 | Douglas City | 3.69 | 750 |
| 3 | Campo | 2.94 | 1,627 |
| 4 | Green Valley | 2.91 | 430 |
| 5 | Anza | 2.80 | 2,124 |
| 6 | Diablo Grande | 2.72 | 307 |
| 7 | Lake Riverside | 2.41 | 797 |
| 8 | Oak Glen | 2.35 | 779 |
| 9 | Hayfork | 2.35 | 1,855 |
| 10 | Berry Creek | 2.33 | 693 |
| 11 | Robinson Mill | 2.30 | 205 |
| 12 | Tobin | 2.27 | 9 |
| 13 | Pine Valley | 2.23 | 812 |
| 14 | Julian | 2.23 | 1,657 |
| 15 | Alleghany | 2.22 | 67 |
| 16 | Lakeland Village | 2.16 | 5,519 |
| 17 | Aguanga | 2.15 | 1,526 |
| 18 | Potrero | 2.09 | 658 |
| 19 | Montgomery Creek | 1.94 | 241 |
| 20 | Round Mountain | 1.92 | 638 |
| 21 | Coffee Creek | 1.92 | 202 |
| 22 | Coulterville | 1.89 | 309 |
| 23 | Kennedy Meadows | 1.87 | 16 |
| 24 | Groveland | 1.85 | 458 |
| 25 | Downieville | 1.79 | 228 |
Values come from the published Wildfire Risk to California Communities assessment and are rounded for presentation. The table ranks modeled risk near exposed homes, not past loss totals, insurance prices or forecasted fire occurrence.
What patterns appear in the ranking?
Small communities dominate the top tier
Descanso, Douglas City, Campo, Green Valley and Anza rank high because their exposed housing is close to severe wildfire environments. Their position is not driven by population size.
Direct exposure is not the only signal
Berry Creek and Diablo Grande have very high direct-exposure shares, while other communities rank high through the combined effect of likelihood, intensity and residential location.
Larger places can carry high cumulative exposure
Mean RPS highlights average risk near exposed homes. A larger city can have lower mean RPS but still face major cumulative housing risk because many more homes are exposed.
Southern California is strongly represented in the upper ranks through backcountry and inland communities where wind, slope, dry fuels and canyon terrain shape the fire environment. Ember exposure matters because homes can ignite even when the flame front does not directly pass over every parcel.
Northern California communities in the table show the same basic pattern in a different landscape. Forested foothills, dispersed housing, limited access routes and vegetation continuity can produce high modeled risk even where population density is low.
The lower part of the Top 25 still represents serious wildfire exposure. The difference between rank 10 and rank 25 should not be treated as “safe versus unsafe”; it shows relative modeled risk within a group already identified as high-risk in the source assessment.
What this means for readers
For residents, a high community ranking should prompt practical checks: defensible space, ember-resistant vents, hardened roofing, clear address visibility, evacuation alerts, vehicle fuel planning and household communication plans. The score describes community-level modeled risk, but home-level conditions determine how that risk is experienced.
For buyers, the ranking should trigger a parcel-level review rather than replace one. CAL FIRE Fire Hazard Severity Zones, local hazard disclosures, road access, slope, vegetation clearance, insurance availability and mitigation history all matter before a property decision.
For local governments and planners, the ranking points to places where fuel treatment, evacuation-route planning, public communication, defensible-space enforcement and home-hardening support can reduce consequences. Small communities may need highly targeted mitigation even when their total housing count is modest.
FAQ
Which California community ranks highest for wildfire risk to homes?
Descanso ranks first in the published Top 25 by mean Risk to Potential Structures, with a mean RPS of 3.85 near exposed housing units.
Does a high wildfire-risk score mean the community will burn this fire season?
No. The score is a modeled relative risk measure. It combines likelihood and consequence, but it is not a seasonal forecast and does not predict a specific fire outcome.
Why does the ranking include communities instead of only cities?
Many of California’s highest wildfire-risk places are unincorporated or census-designated communities. Excluding them would hide important wildland-urban-interface exposure.
How is RPS different from a Fire Hazard Severity Zone?
RPS is a modeled risk-to-structures measure. CAL FIRE Fire Hazard Severity Zones classify hazard areas for California regulatory and planning purposes. FHSZ maps are essential for property screening, but they do not produce this ranking.
Are urban areas outside this table safe from wildfire impacts?
No. Urban areas can face smoke, ember exposure, evacuation disruption, infrastructure stress and home-to-home ignition during extreme events. A lower mean RPS does not remove the need for wildfire planning.
Should insurance costs be inferred from this score?
No. Insurance availability and premiums may consider wildfire models, but they also reflect property condition, mitigation, claims history, replacement cost, underwriting rules and insurer-specific methods.
What should a homebuyer check after seeing a high-risk community?
Check the official CAL FIRE hazard map, local disclosures, evacuation access, roof and vent condition, defensible space, nearby fuels, slope, water access and whether the property has documented wildfire mitigation.
Sources
-
USDA Forest Service — Wildfire Risk to Communities
Provides the national wildfire-risk framework and community-level concepts such as risk to homes, exposure types, wildfire likelihood and vulnerable populations. -
Wildfire Risk to Communities — Download Data
Defines the downloadable wildfire-risk indicators used to interpret Risk to Homes, Wildfire Likelihood and related community measures. -
Wildfire Risk to California Communities — U.S. Forest Service / Pyrologix report
Supplies the Top 25 California community ranking by mean Risk to Potential Structures and exposed housing-unit values. -
CAL FIRE / Office of the State Fire Marshal — Fire Hazard Severity Zones
Documents California’s official fire-hazard-zone framework and the purpose of statewide hazard mapping. -
California Open Data — Fire Hazard Severity Zone Viewer
Supplies the current Fire Hazard Severity Zone viewer context, including SRA effective April 1, 2024 and LRA recommended March 24, 2025. -
CAL FIRE — GIS Mapping and Data Analytics
Provides the official access point for California fire-related GIS tools and mapping resources.
Related rankings
More StatRanker rankings on climate, environment, resources and sustainability.
Extreme Weather Disaster Pressure by Country: Exposure Patterns, Risks and Resilience
Open rankingTop 100 Countries by Total CO₂ Emissions, 2026 Snapshot
Open rankingTop 100 Countries by Water Stress Level, 2025
Open rankingCountries by Renewable Electricity Generation per Capita, 2025
Open ranking
StatRanker (Website)
administrator
