


U.S. States by Population: 2026 Snapshot Based on 2025 Census Estimates
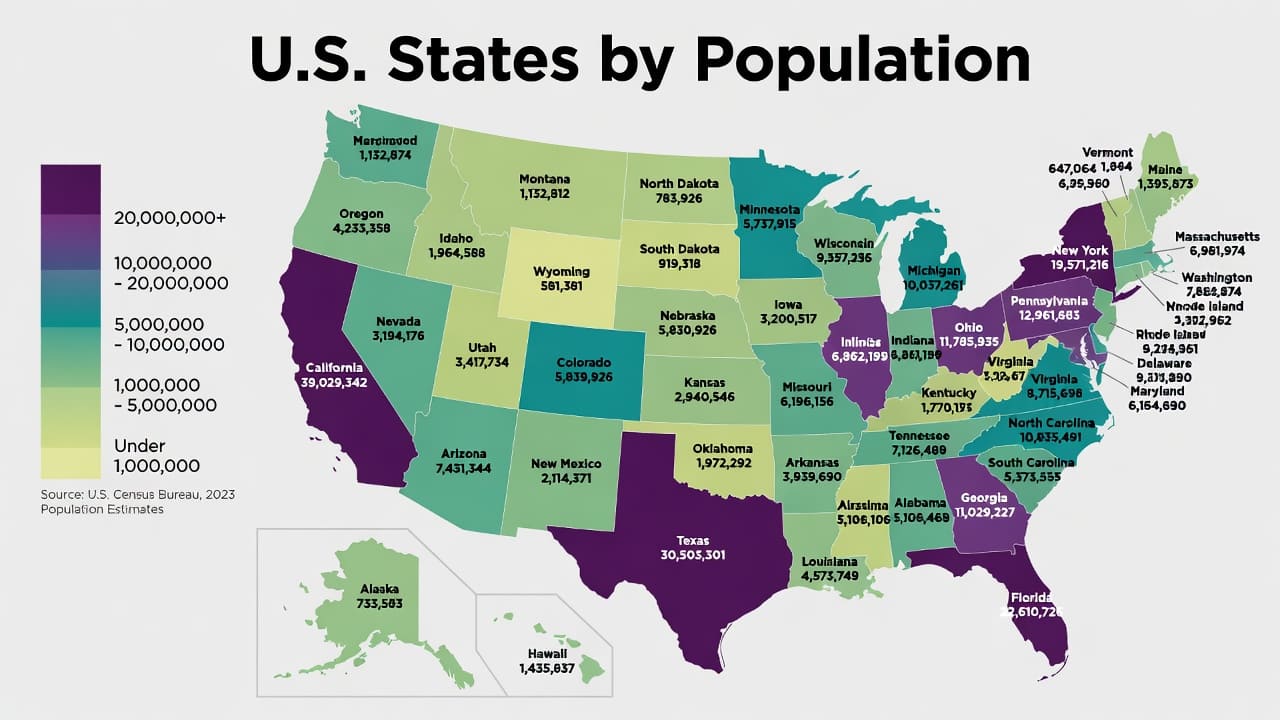
California and Texas define the upper end of the state population ranking
California ranks first with 39,355,309 residents, followed by Texas with 31,709,821 and Florida with 23,462,518. New York is the only other jurisdiction above 20 million. Wyoming is the smallest state at 588,753, while the District of Columbia ranks above Vermont and Wyoming.
This 2026 publication snapshot uses official U.S. Census Bureau Vintage 2025 resident population estimates for July 1, 2025. The table covers all 50 states and the District of Columbia, uses people as the unit, and ranks larger populations higher. All 51 rows are official estimates; no future population projections are included.
The ranking measures absolute resident population. Growth rates, population density, migration and land area do not affect rank.
Continue exploring
More StatRanker rankings on population structure, growth and demographic change.
Population by Country 2026: UN Population Projection and Full Ranking
Open rankingTop 100 Countries by Urbanization Rate (% Urban Population), 2025
Open rankingTop 100 Countries by Population Growth Rate, 2025
Open rankingPublished: · Data checked:
California ranks first.
Wyoming ranks 51st in the states-and-D.C. table.
All 50 states plus the District of Columbia.
The ten largest entries contain more than half of the displayed population.
A small group of states accounts for most of the population scale
The ten largest jurisdictions contain 184,837,758 of the 341,784,857 residents represented in the table. California alone has about 67 times the population of Wyoming, showing how unevenly the national population is distributed across state boundaries.
The South is the largest Census region in the ranking with 133,833,983 residents, equal to 39.2% of the total. The West accounts for 23.4%, the Midwest for 20.4% and the Northeast for 17.0%.
Population size should be read separately from population change. A state can have a large resident base while growing slowly, and a smaller state can post a faster growth rate without approaching the largest states in absolute population.
Full ranking of the 50 states and District of Columbia
Showing 51 of 51 entries.
| Rank | State or D.C. | Population | Census region |
|---|---|---|---|
| 1 | California | 39,355,309 | West |
| 2 | Texas | 31,709,821 | South |
| 3 | Florida | 23,462,518 | South |
| 4 | New York | 20,002,427 | Northeast |
| 5 | Pennsylvania | 13,059,432 | Northeast |
| 6 | Illinois | 12,719,141 | Midwest |
| 7 | Ohio | 11,900,510 | Midwest |
| 8 | Georgia | 11,302,748 | South |
| 9 | North Carolina | 11,197,968 | South |
| 10 | Michigan | 10,127,884 | Midwest |
| 11 | New Jersey | 9,548,215 | Northeast |
| 12 | Virginia | 8,880,107 | South |
| 13 | Washington | 8,001,020 | West |
| 14 | Arizona | 7,623,818 | West |
| 15 | Tennessee | 7,315,076 | South |
| 16 | Massachusetts | 7,154,084 | Northeast |
| 17 | Indiana | 6,973,333 | Midwest |
| 18 | Missouri | 6,270,541 | Midwest |
| 19 | Maryland | 6,265,347 | South |
| 20 | Colorado | 6,012,561 | West |
| 21 | Wisconsin | 5,972,787 | Midwest |
| 22 | Minnesota | 5,830,405 | Midwest |
| 23 | South Carolina | 5,570,274 | South |
| 24 | Alabama | 5,193,088 | South |
| 25 | Louisiana | 4,618,189 | South |
| 26 | Kentucky | 4,606,864 | South |
| 27 | Oregon | 4,273,586 | West |
| 28 | Oklahoma | 4,123,288 | South |
| 29 | Connecticut | 3,688,496 | Northeast |
| 30 | Utah | 3,538,904 | West |
| 31 | Nevada | 3,282,188 | West |
| 32 | Iowa | 3,238,387 | Midwest |
| 33 | Arkansas | 3,114,791 | South |
| 34 | Kansas | 2,977,220 | Midwest |
| 35 | Mississippi | 2,954,160 | South |
| 36 | New Mexico | 2,125,498 | West |
| 37 | Idaho | 2,029,733 | West |
| 38 | Nebraska | 2,018,006 | Midwest |
| 39 | West Virginia | 1,766,147 | South |
| 40 | Hawaii | 1,432,820 | West |
| 41 | New Hampshire | 1,415,342 | Northeast |
| 42 | Maine | 1,414,874 | Northeast |
| 43 | Montana | 1,144,694 | West |
| 44 | Rhode Island | 1,114,521 | Northeast |
| 45 | Delaware | 1,059,952 | South |
| 46 | South Dakota | 935,094 | Midwest |
| 47 | North Dakota | 799,358 | Midwest |
| 48 | Alaska | 737,270 | West |
| 49 | District of Columbia | 693,645 | South |
| 50 | Vermont | 644,663 | Northeast |
| 51 | Wyoming | 588,753 | West |
No entries match the selected filters.
Puerto Rico, the national total and regional aggregates are excluded. Census regions are shown for context and filtering only. Rank is calculated from the unrounded population count in descending order.
Population scale across the 20 largest jurisdictions
California and Texas form a clear upper tier, followed by Florida and New York. The distance between New York and Pennsylvania is especially large, after which the distribution becomes more gradual.
Chart labels are rounded to two decimal places in millions. The table retains the full counts used for ranking.
How the Vintage 2025 population estimates were ranked
The source is the U.S. Census Bureau Population Estimates Program. Values represent resident population on July 1, 2025 and were published in the Vintage 2025 state totals release on January 27, 2026.
Metric and unit
Resident population measured in people. Values are integers and are displayed without further rounding in the ranking table.
Ranking direction
Jurisdictions are ordered from largest to smallest population. Rank 1 therefore identifies the largest resident population.
Coverage
The table includes the 50 states and the District of Columbia. Puerto Rico and summary aggregates are outside the comparison.
Estimate, not projection
The figures estimate population for a date that has already passed. They are not modeled forecasts for July 2026 or a later year.
Regional classification
Region labels follow the Census Bureau's Northeast, Midwest, South and West classification. D.C. is included in the South.
Vintage revisions
Each annual vintage can revise earlier post-2020 estimates as the Census Bureau updates the population base, component data and geographic inputs.
The Population Estimates Program updates the post-census base using births, deaths, domestic migration and international migration. The ranking does not use growth, density, migration rates or land area as substitutes for population size.
Four findings from the state population distribution
The Top 10 contain 54.1% of the total
The ten largest entries account for 184.8 million residents, while the remaining 41 jurisdictions account for 156.9 million.
The South contains 39.2% of residents
Southern states and D.C. together have 133.8 million residents, the largest regional total in the table.
Kentucky is the median jurisdiction
With 51 ranked entries, rank 26 is the midpoint. Kentucky occupies that position with 4,606,864 residents.
Some neighboring ranks are nearly tied
New Hampshire exceeds Maine by only 468 residents, and Missouri exceeds Maryland by 5,194, making these positions especially sensitive to later revisions.
What the ranking shows and where caution is needed
The table is useful for comparing the absolute size of state resident populations. It helps identify the jurisdictions that account for the largest shares of the national population and the scale difference between the top, middle and bottom of the distribution.
It should not be read as a measure of demographic momentum. Population growth requires a comparison across dates, while density requires land area and migration requires separate inflow and outflow measures.
Close ranks can change when a new vintage revises earlier estimates. Large gaps, such as those between Texas and Florida or New York and Pennsylvania, are less likely to be affected by small revisions than near-ties such as New Hampshire and Maine.
Related population rankings
Fastest-growing U.S. cities
Compare recent growth rates for cities rather than absolute state population.
Population density ranking
See how population relative to land area differs from total headcount.
Net migration rate ranking
Compare migration intensity as a separate demographic measure.
Population rankings
Browse more rankings on population size, structure, density and growth.
Frequently asked questions
Which U.S. state has the largest population?
California ranks first with an estimated 39,355,309 residents on July 1, 2025.
Which state has the smallest population?
Wyoming is the least populous state at 588,753 residents. The District of Columbia is included separately and ranks 49th.
Why is this called a 2026 snapshot when the estimate date is in 2025?
The Vintage 2025 state estimates measure population on July 1, 2025 and were released on January 27, 2026. The page reflects the data available in 2026 rather than claiming a July 2026 population count.
Are these figures the same as the 2020 Census count?
No. The 2020 Census counted the population as of April 1, 2020. These annual estimates update the post-census population base using births, deaths and migration data.
Why is D.C. included but Puerto Rico excluded?
The comparison covers the 50 states and the District of Columbia. Puerto Rico is published separately in Census population tables and is outside this states-and-D.C. ranking.
Can the ranking change in a later Census vintage?
Yes. Later vintages can revise population estimates as the Census Bureau updates source data and methodology. Closely spaced jurisdictions are the most likely to exchange positions.
Sources
U.S. Census Bureau state population totals
Official landing page for Vintage 2025 state totals, downloadable tables and documentation.
https://www.census.gov/data/tables/time-series/demo/popest/2020s-state-total.html
NST-EST2025-POP table
Official spreadsheet containing the population values used for all 51 ranked entries.
https://www2.census.gov/programs-surveys/popest/tables/2020-2025/state/totals/NST-EST2025-POP.xlsx
Vintage 2025 release notes
Summary of changes to the estimates base, input data and methodology in the current vintage.
Vintage 2025 methodology statement
Detailed description of the Population Estimates Program and its estimation procedures.
Census regions and divisions
Official reference map for the Northeast, Midwest, South and West classifications used in the table.
https://www2.census.gov/geo/pdfs/maps-data/maps/reference/us_regdiv.pdf
Related rankings
More StatRanker rankings on population structure, growth and demographic change.
Top 100 Countries by Prison Population Rate in 2025
Open rankingAging World: Top 10 Countries by Share of Population Aged 65+, 2025
Open rankingWorld Population by Country (2025): Top 100 Most Populous Nations Ranked
Open rankingTOP 20 Countries with Fastest Population Aging (2015–2025)
Open ranking
StatRanker (Website)
administrator
