

GDP per Capita by Country 2026: Nominal Ranking
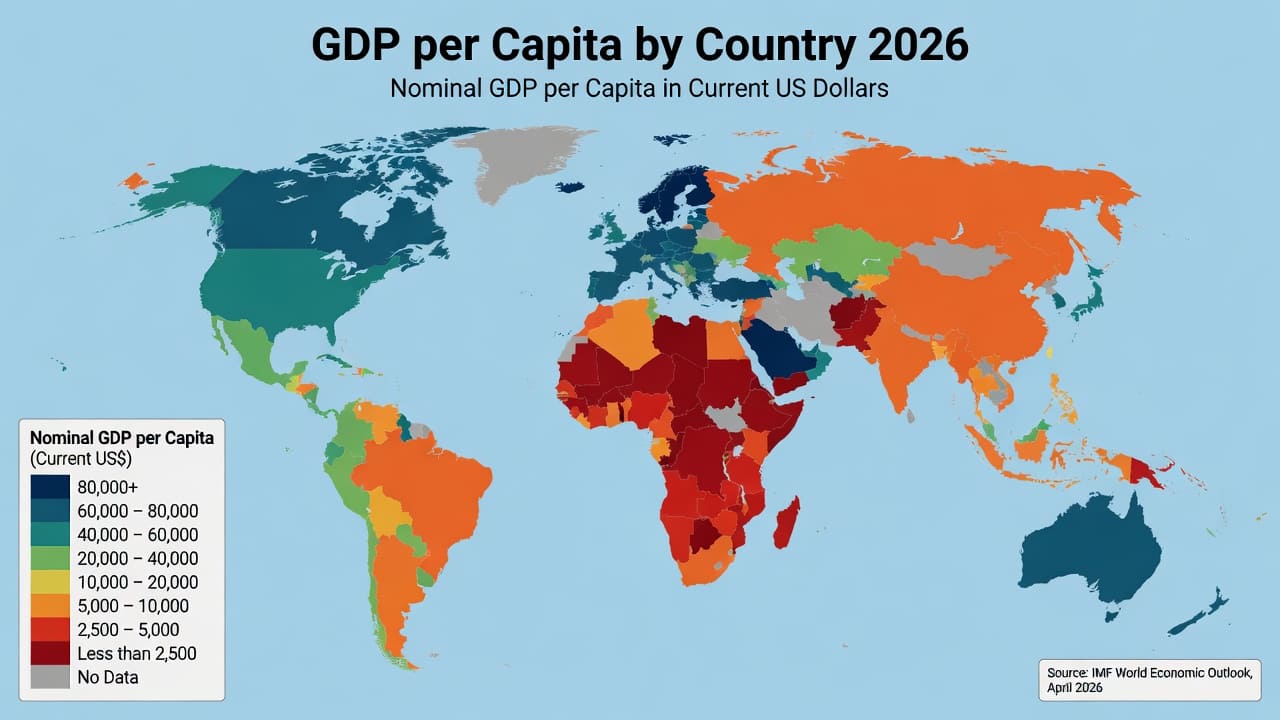
Nominal GDP per Capita in the IMF’s April 2026 Outlook
Liechtenstein ranks first at $226,809 per resident, followed by Luxembourg, Ireland and Switzerland. The metric is IMF World Economic Outlook series NGDPDPC: GDP per capita at current prices, expressed in current U.S. dollars.
The table covers the 100 highest values among 184 eligible country records. Higher values rank higher. All 100 rows use the same April 2026 IMF staff projection series.
The annual label is 2026. A small number of country series follow fiscal-year conventions, which are explained in the methodology.
Liechtenstein ranks first.
Ecuador is the final country in the Top 100.
Calculated from ranks 50 and 51.
IMF WEO, April 2026.
IMF staff projections for the 2026 annual label.
What the Ranking Measures
Nominal GDP per capita divides current-price GDP by the average population and converts the result into U.S. dollars at market exchange rates. It measures average economic output per resident, not the income received by a typical household.
Metric used here
NGDPDPC: GDP per capita at current prices in current U.S. dollars. Ranks use the unrounded IMF values, while the table rounds them to the nearest dollar.
Related but different measures
PPP GDP per capita adjusts for national price levels. Total nominal GDP compares whole economies. Real GDP per capita growth measures inflation-adjusted change over time.
Current-dollar results can change because of output growth, domestic prices, population and exchange rates. Currency appreciation can raise the converted value, while depreciation can reduce it.
Top 10 Countries by Projected Nominal GDP per Capita
Seven of the first ten countries are in Europe and Central Asia. The group also includes Singapore and the United States, showing that high current-dollar output per resident can arise from different economic structures.
Top 10 values, current U.S. dollars per resident
| Rank | Country | Current US$ | Region / actual |
|---|---|---|---|
| 1 | Liechtenstein | $226,809 | Europe & Central Asia · latest actual: 2023 |
| 2 | Luxembourg | $158,733 | Europe & Central Asia · latest actual: 2024 |
| 3 | Ireland | $140,186 | Europe & Central Asia · latest actual: 2025 |
| 4 | Switzerland | $126,177 | Europe & Central Asia · latest actual: 2025 |
| 5 | Iceland | $110,048 | Europe & Central Asia · latest actual: 2024 |
| 6 | Singapore | $107,758 | East Asia & Pacific · latest actual: 2025 |
| 7 | Norway | $105,877 | Europe & Central Asia · latest actual: 2025 |
| 8 | United States | $94,430 | North America · latest actual: 2025 |
| 9 | Denmark | $83,445 | Europe & Central Asia · latest actual: 2025 |
| 10 | Netherlands | $79,918 | Europe & Central Asia · latest actual: 2025 |
Latest actual indicates the most recent observed period identified in the IMF metadata for each country.
Top 20 Projected Values
Liechtenstein stands well above the rest of the group. Canada, at rank 20, remains above $60,000 per resident.
Methodology and Coverage
Metric and ranking rule
The ranking uses IMF WEO series NGDPDPC, GDP per capita at current prices in U.S. dollars. Values are sorted from highest to lowest before rounding.
Projection status
The 2026 values are IMF staff projections from the April 2026 WEO database. Later WEO editions may revise them as national accounts, population data, exchange rates and assumptions change.
Coverage path: 197 → 190 → 184 → 100
The April database contains 197 economy records. Seven lack a 2026 NGDPDPC value: Afghanistan, Eritrea, Lebanon, Pakistan, Sri Lanka, Syria, and West Bank and Gaza. A UN-member-state rule then excludes Aruba, Hong Kong SAR, Kosovo, Macao SAR, Puerto Rico and Taiwan. The resulting 184-country set is sorted, and the highest 100 values are published here.
Calendar and fiscal years
The annual label is 2026, but some series follow national fiscal-year conventions. Palau and the Marshall Islands show FY2023/24 as their latest actual reference, while Nauru shows FY2020/21. Exact period interpretation follows the IMF country notes.
Regional classification
The filter uses seven geographic regions based on World Bank country group labels. High-income economies are assigned by geography rather than lending status; the United States and Canada are grouped as North America.
April database and July update
The July 2026 WEO Update refreshes selected economies and headline indicators. The April 2026 database remains the latest full cross-country release for NGDPDPC used in this ranking.
Rounding
Rows retain the unrounded IMF values for ranking and sorting. Display values are rounded to the nearest dollar, and chart widths use the same unrounded series.
Interpretation limits
The metric does not directly show household income, median wages, wealth, inequality, purchasing power, cost of living, public services or labour productivity.
Top 100 Nominal GDP per Capita Ranking
100 countries shown
Top 100 values, current U.S. dollars per resident
| Rank | Country | Current US$ | Region / actual |
|---|---|---|---|
| 1 | Liechtenstein | $226,809 | Europe & Central Asia · latest actual: 2023 |
| 2 | Luxembourg | $158,733 | Europe & Central Asia · latest actual: 2024 |
| 3 | Ireland | $140,186 | Europe & Central Asia · latest actual: 2025 |
| 4 | Switzerland | $126,177 | Europe & Central Asia · latest actual: 2025 |
| 5 | Iceland | $110,048 | Europe & Central Asia · latest actual: 2024 |
| 6 | Singapore | $107,758 | East Asia & Pacific · latest actual: 2025 |
| 7 | Norway | $105,877 | Europe & Central Asia · latest actual: 2025 |
| 8 | United States | $94,430 | North America · latest actual: 2025 |
| 9 | Denmark | $83,445 | Europe & Central Asia · latest actual: 2025 |
| 10 | Netherlands | $79,918 | Europe & Central Asia · latest actual: 2025 |
| 11 | Australia | $75,648 | East Asia & Pacific · latest actual: 2025 |
| 12 | Sweden | $70,676 | Europe & Central Asia · latest actual: 2024 |
| 13 | San Marino | $70,187 | Europe & Central Asia · latest actual: 2023 |
| 14 | Israel | $69,804 | Middle East & North Africa · latest actual: 2025 |
| 15 | Qatar | $68,138 | Middle East & North Africa · latest actual: 2023 |
| 16 | Austria | $67,761 | Europe & Central Asia · latest actual: 2025 |
| 17 | Germany | $65,303 | Europe & Central Asia · latest actual: 2025 |
| 18 | Belgium | $65,112 | Europe & Central Asia · latest actual: 2024 |
| 19 | United Kingdom | $61,056 | Europe & Central Asia · latest actual: 2025 |
| 20 | Canada | $60,305 | North America · latest actual: 2025 |
| 21 | Finland | $60,130 | Europe & Central Asia · latest actual: 2024 |
| 22 | United Arab Emirates | $54,214 | Middle East & North Africa · latest actual: 2024 |
| 23 | Malta | $53,560 | Europe & Central Asia · latest actual: 2025 |
| 24 | Andorra | $53,475 | Europe & Central Asia · latest actual: 2025 |
| 25 | France | $52,083 | Europe & Central Asia · latest actual: 2025 |
| 26 | New Zealand | $52,023 | East Asia & Pacific · latest actual: 2025 |
| 27 | Italy | $46,505 | Europe & Central Asia · latest actual: 2025 |
| 28 | Cyprus | $45,409 | Europe & Central Asia · latest actual: 2025 |
| 29 | Spain | $41,563 | Europe & Central Asia · latest actual: 2025 |
| 30 | Bahamas | $40,892 | Latin America & Caribbean · latest actual: 2024 |
| 31 | Slovenia | $40,630 | Europe & Central Asia · latest actual: 2025 |
| 32 | Czechia | $39,795 | Europe & Central Asia · latest actual: 2025 |
| 33 | Saudi Arabia | $37,811 | Middle East & North Africa · latest actual: 2025 |
| 34 | Estonia | $37,718 | Europe & Central Asia · latest actual: 2025 |
| 35 | South Korea | $37,412 | East Asia & Pacific · latest actual: 2025 |
| 36 | Lithuania | $36,545 | Europe & Central Asia · latest actual: 2025 |
| 37 | Brunei | $36,288 | East Asia & Pacific · latest actual: 2024 |
| 38 | Japan | $35,703 | East Asia & Pacific · latest actual: 2025 |
| 39 | Portugal | $35,434 | Europe & Central Asia · latest actual: 2024 |
| 40 | Guyana | $33,167 | Latin America & Caribbean · latest actual: 2025 |
| 41 | Kuwait | $33,164 | Middle East & North Africa · latest actual: 2024 |
| 42 | Poland | $31,336 | Europe & Central Asia · latest actual: 2025 |
| 43 | Slovak Republic | $31,242 | Europe & Central Asia · latest actual: 2025 |
| 44 | Croatia | $30,030 | Europe & Central Asia · latest actual: 2025 |
| 45 | Greece | $29,696 | Europe & Central Asia · latest actual: 2025 |
| 46 | Bahrain | $29,569 | Middle East & North Africa · latest actual: 2024 |
| 47 | Barbados | $29,020 | Latin America & Caribbean · latest actual: 2024 |
| 48 | Latvia | $28,913 | Europe & Central Asia · latest actual: 2025 |
| 49 | Hungary | $28,430 | Europe & Central Asia · latest actual: 2025 |
| 50 | Uruguay | $27,608 | Latin America & Caribbean · latest actual: 2024 |
| 51 | Romania | $25,693 | Europe & Central Asia · latest actual: 2025 |
| 52 | Bulgaria | $23,848 | Europe & Central Asia · latest actual: 2025 |
| 53 | Antigua and Barbuda | $22,448 | Latin America & Caribbean · latest actual: 2024 |
| 54 | Saint Kitts and Nevis | $22,146 | Latin America & Caribbean · latest actual: 2024 |
| 55 | Oman | $21,645 | Middle East & North Africa · latest actual: 2025 |
| 56 | Palau | $21,571 | East Asia & Pacific · latest actual: FY2023/24 |
| 57 | Panama | $20,564 | Latin America & Caribbean · latest actual: 2025 |
| 58 | Costa Rica | $20,299 | Latin America & Caribbean · latest actual: 2025 |
| 59 | Chile | $20,240 | Latin America & Caribbean · latest actual: 2025 |
| 60 | Maldives | $19,464 | South Asia · latest actual: 2024 |
| 61 | Türkiye | $19,018 | Europe & Central Asia · latest actual: 2025 |
| 62 | Trinidad and Tobago | $18,616 | Latin America & Caribbean · latest actual: 2024 |
| 63 | Russia | $18,525 | Europe & Central Asia · latest actual: 2025 |
| 64 | Seychelles | $17,675 | Sub-Saharan Africa · latest actual: 2024 |
| 65 | Kazakhstan | $17,503 | Europe & Central Asia · latest actual: 2024 |
| 66 | Serbia | $17,252 | Europe & Central Asia · latest actual: 2025 |
| 67 | Montenegro | $16,377 | Europe & Central Asia · latest actual: 2025 |
| 68 | Nauru | $16,053 | East Asia & Pacific · latest actual: FY2020/21 |
| 69 | Mexico | $15,779 | Latin America & Caribbean · latest actual: 2024 |
| 70 | Saint Lucia | $15,135 | Latin America & Caribbean · latest actual: 2024 |
| 71 | Malaysia | $15,085 | East Asia & Pacific · latest actual: 2025 |
| 72 | China | $14,874 | East Asia & Pacific · latest actual: 2025 |
| 73 | Argentina | $14,357 | Latin America & Caribbean · latest actual: 2025 |
| 74 | Mauritius | $13,812 | Sub-Saharan Africa · latest actual: 2024 |
| 75 | Grenada | $12,689 | Latin America & Caribbean · latest actual: 2025 |
| 76 | Albania | $12,493 | Europe & Central Asia · latest actual: 2024 |
| 77 | Dominican Republic | $12,406 | Latin America & Caribbean · latest actual: 2025 |
| 78 | Brazil | $12,313 | Latin America & Caribbean · latest actual: 2025 |
| 79 | Turkmenistan | $12,300 | Europe & Central Asia · latest actual: 2024 |
| 80 | North Macedonia | $11,967 | Europe & Central Asia · latest actual: 2025 |
| 81 | Georgia | $11,574 | Europe & Central Asia · latest actual: 2025 |
| 82 | Belarus | $11,286 | Europe & Central Asia · latest actual: 2024 |
| 83 | Saint Vincent and the Grenadines | $11,098 | Latin America & Caribbean · latest actual: 2024 |
| 84 | Peru | $10,960 | Latin America & Caribbean · latest actual: 2025 |
| 85 | Bosnia and Herzegovina | $10,701 | Europe & Central Asia · latest actual: 2024 |
| 86 | Dominica | $10,459 | Latin America & Caribbean · latest actual: 2024 |
| 87 | Armenia | $10,410 | Europe & Central Asia · latest actual: 2025 |
| 88 | Colombia | $10,104 | Latin America & Caribbean · latest actual: 2025 |
| 89 | Gabon | $9,918 | Sub-Saharan Africa · latest actual: 2024 |
| 90 | Marshall Islands | $9,677 | East Asia & Pacific · latest actual: FY2023/24 |
| 91 | Paraguay | $9,372 | Latin America & Caribbean · latest actual: 2024 |
| 92 | Moldova | $9,354 | Europe & Central Asia · latest actual: 2025 |
| 93 | Suriname | $8,856 | Latin America & Caribbean · latest actual: 2025 |
| 94 | Botswana | $8,490 | Sub-Saharan Africa · latest actual: 2024 |
| 95 | Jamaica | $8,356 | Latin America & Caribbean · latest actual: 2024 |
| 96 | Equatorial Guinea | $8,152 | Sub-Saharan Africa · latest actual: 2024 |
| 97 | Belize | $8,134 | Latin America & Caribbean · latest actual: 2024 |
| 98 | Thailand | $8,105 | East Asia & Pacific · latest actual: 2025 |
| 99 | Mongolia | $7,853 | East Asia & Pacific · latest actual: 2025 |
| 100 | Ecuador | $7,575 | Latin America & Caribbean · latest actual: 2025 |
Ranks use unrounded values. The table rounds each result to the nearest dollar.
Patterns in the Top 100
Seven countries exceed $100,000
Liechtenstein, Luxembourg, Ireland, Switzerland, Iceland, Singapore and Norway are above $100,000 per resident.
Europe dominates the upper ranks
Europe and Central Asia accounts for 14 of the Top 20 countries and 47 of the Top 100.
The range is nearly thirtyfold
Liechtenstein’s value is about 29.9 times Ecuador’s value at rank 100.
The midpoint is $26,650
Uruguay at rank 50 and Romania at rank 51 place the Top 100 median between $27,608 and $25,693.
How to Interpret the Results
A high position means that current-price GDP is large relative to the resident population after conversion into U.S. dollars. It does not mean that every household receives an equivalent income.
Small economies can rank highly when cross-border workers contribute to production, multinational activity raises measured GDP, or natural-resource output is large relative to population. These effects are especially relevant when reading results for Liechtenstein, Luxembourg, Ireland and Qatar.
For comparisons of material living standards, PPP GDP per capita, household disposable income, median earnings and inequality measures provide useful additional context.
Download the GDP per Capita by Country 2026: Nominal GDP per Capita in Current US Dollars dataset
GDP per Capita by Country 2026: Nominal GDP per Capita in Current US Dollars
100 ranked entries · Excel + CSV + methodology + sources + chart · Snapshot: IMF WEO 2026 nominal GDP per capita projection · Version 1.0
The archive includes machine-readable data, methodology and source documentation. Quick human verification is required before the ZIP is delivered. Full Data Pack downloads require a free account. Free accounts can download 1 different Data Pack every 30 days; re-downloading the same pack does not use another slot. Annual Data Access provides unlimited manual downloads while annual access is active.
Download Excel + CSV Data PackFrequently Asked Questions
Which country ranks first?
Liechtenstein ranks first at $226,809 per resident in the April 2026 IMF WEO projection.
Are the 2026 values final?
No. They are IMF staff projections and may be revised in later WEO releases.
Why are only 100 countries shown?
The eligible set contains 184 countries. This page publishes the 100 highest values, with Ecuador at the cutoff.
Does 2026 always mean the calendar year?
Not in every case. Some country series follow fiscal-year conventions; Palau, Nauru and the Marshall Islands have fiscal-year notation in their latest actual references.
Why is the April database used after the July update?
The July 2026 update covers selected economies and headline indicators rather than replacing the complete April country database for NGDPDPC.
Is nominal GDP per capita the same as PPP GDP per capita?
No. Nominal GDP per capita uses market exchange rates and current U.S. dollars. PPP adjusts for differences in national price levels.
Why do exchange rates matter?
National-currency GDP is converted into U.S. dollars. Appreciation can lift the converted value, while depreciation can lower it even when real output changes more slowly.
Sources
IMF World Economic Outlook Database
April 2026 GDP per capita projections and country metadata.
April 2026 WEO Workbook
Country values, annual labels and latest actual reference periods.
April 2026 WEO Database Appendix
Coverage, global assumptions, reporting conventions and country notes.
July 2026 WEO Update
Updated global outlook and selected-economy revisions published after the full April database.
World Bank Country and Lending Groups
Reference for the geographic labels used in the region filter.
Ireland Central Statistics Office
Explanation of modified GNI and the effect of multinational activity on Irish GDP.
Luxembourg STATEC
Official labour-market data on cross-border employment in Luxembourg.
Liechtenstein National Economy Overview
Official context on inward commuters and economic output in Liechtenstein.
Qatar National Planning Council
Official GDP context for hydrocarbon and non-hydrocarbon activity.
