

Electricity Generation in the World by Source: Coal, Gas and Renewables in 2025
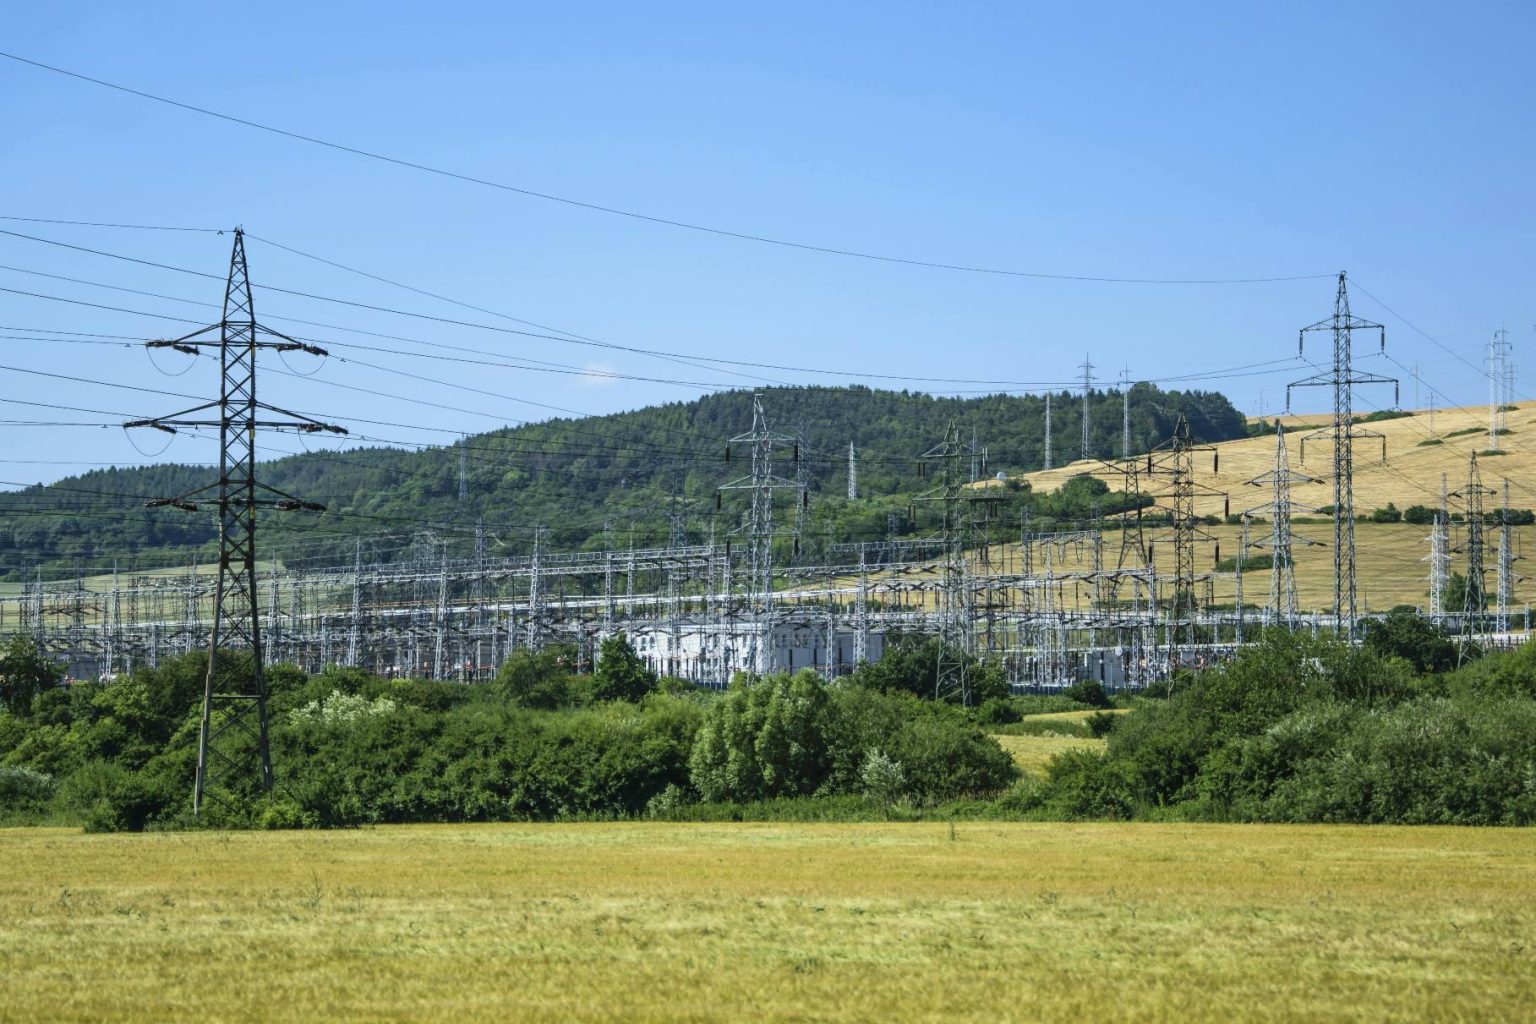
The 2025 Global Power Mix: Renewables Edge Ahead of Coal
World electricity generation reached 31,734.49 terawatt-hours in 2025. Ember’s global dataset places renewable sources at 10,717.06 TWh, or 33.78% of generation, slightly above coal at 10,490.32 TWh and 33.06%. Natural gas supplied 6,896.35 TWh, equal to 21.73%.
Renewables are an aggregate group containing hydro, solar, wind, bioenergy and other renewables. Coal remains the largest individual source. The ranking below therefore separates nine non-overlapping fuel categories so that renewable technologies are not counted twice.
The numeric values are source-published estimates from Ember’s Yearly Electricity Data CSV downloaded on July 15, 2026. Ember combines final annual statistics with latest-year estimates based on annualised monthly changes, projected missing months and estimates for country-years without current reporting.
Up 1.83 percentage points from 2024.
Down 1.04 percentage points from 2024.
Down 0.52 percentage points despite a small output increase.
Solar output rose 29.66% year over year.
What Changed Between 2024 and 2025
Total generation increased by 821.99 TWh, or 2.66%. Renewable output rose by 839.73 TWh, while fossil generation fell by 51.30 TWh. Solar supplied most of the renewable increase, wind added 203.70 TWh, hydropower was almost unchanged and nuclear generation rose by 33.56 TWh.
Wind and solar together increased by 839.39 TWh, which was 17.40 TWh more than the rise in total generation. The arithmetic balances because nuclear, bioenergy and other renewables also increased, while coal, other fossil generation and hydropower declined.
Ember reports a narrow renewable lead of 0.72 percentage points over coal. The International Energy Agency uses an independent global estimate, rounds both shares to about 34% and describes renewable generation as having virtually matched coal. The two sources agree on the direction of change, but the exact crossover depends on source coverage, fuel mapping, latest-year estimation and rounding.
World Electricity Generation by Individual Source
Coal and natural gas remained the two largest individual sources. Hydropower ranked third, while nuclear, solar and wind formed a close middle group. Solar moved ahead of wind and finished only 33.79 TWh below nuclear generation.
Methodology, Definitions and Data Reliability
The ranking metric is global electricity generated during calendar year 2025, measured in TWh. Rank is descending: a source with more generation ranks above a source with less. The table uses Ember’s nine fuel categories and Ember’s published 2024 and 2025 values.
Source-provided values
Generation, shares, 2024 comparison values, absolute changes and percentage changes come from the Ember CSV snapshot.
Page calculations
This page calculates ranks, percentage-point changes, the renewable–coal gap and selected combined-source comparisons.
Latest-year estimation
When final annual reporting is unavailable, Ember applies fuel-level changes from annualised monthly data. Missing months and country-years can also be estimated.
Coverage
Ember’s 2026 review covers 215 countries and economies and includes current 2025 data for 91 markets representing 93% of global electricity demand.
Gross, net and captive generation
Annual series are generally gross generation, but some monthly operator data use net boundaries. Captive industrial plants can be missing where they fall outside transmission-system reporting.
Distributed generation
Behind-the-meter solar and other small generators are not metered consistently. Ember includes estimates where available, but coverage differs by market.
Fuel definitions
Other fossil includes oil and petroleum products, manufactured gases and waste. Other renewables includes geothermal, tidal and wave generation.
Metric limits
TWh measures annual output, not installed capacity, consumption, affordability, reliability, emissions intensity or generation per person.
Data snapshot: Ember Yearly Electricity Data CSV downloaded on . The file is updated over time, so the download date is part of the result.
For independent context, the IEA Global Energy Review 2026 estimates that renewables and coal were practically level in 2025. It also reports that lower-than-normal wind speeds, especially in Europe, and weaker hydropower in Europe and Eurasia limited renewable growth, while solar recorded the largest increase.
Full Ranking of Global Electricity Sources
Search the nine source categories, filter by fuel family or change the display order. The rank column always preserves the original 2025 generation ranking.
9 of 9 sources shown.
World electricity generation by nine non-overlapping source categories, 2025
| Rank | Source | Generation | Share and change |
|---|---|---|---|
| 1 | Coal | 10,490.32 TWh | 33.06% share; −49.38 TWh (−0.47%); share −1.04 pp. |
| 2 | Natural gas | 6,896.35 TWh | 21.73% share; +16.82 TWh (+0.24%); share −0.52 pp. |
| 3 | Hydropower | 4,432.30 TWh | 13.97% share; −3.23 TWh (−0.07%); share −0.38 pp. |
| 4 | Nuclear | 2,812.39 TWh | 8.86% share; +33.56 TWh (+1.21%); share −0.13 pp. |
| 5 | Solar | 2,778.60 TWh | 8.76% share; +635.69 TWh (+29.66%); share +1.83 pp. |
| 6 | Wind | 2,711.90 TWh | 8.55% share; +203.70 TWh (+8.12%); share +0.44 pp. |
| 7 | Other fossil | 818.37 TWh | 2.58% share; −18.74 TWh (−2.24%); share −0.13 pp. |
| 8 | Bioenergy | 704.94 TWh | 2.22% share; +2.69 TWh (+0.38%); share −0.05 pp. |
| 9 | Other renewables | 89.32 TWh | 0.28% share; +0.88 TWh (+1.00%); share −0.01 pp. |
Percentage-point changes are calculated from Ember’s published share values and may not equal changes derived from rounded TWh values.
Why the 2025 Mix Changed Across Major Regions
China
Rapid solar, wind and nuclear growth met more demand and helped reduce coal-fired generation despite continued electricity demand expansion.
India
An early, strong monsoon increased hydropower and reduced cooling and agricultural pumping demand, while renewable additions also displaced coal generation.
United States
Higher gas prices, strong demand growth and slower coal-plant retirements encouraged switching from gas to coal, so US coal generation increased.
European Union
Record solar output was partly offset by weak wind and hydropower. Gas generation increased, and the fall in coal generation was smaller than recent trends suggested.
Solar dominated growth
Solar supplied about three-quarters of renewable generation growth in Ember’s figures. IEA estimates that roughly 55% of its solar increase occurred in China.
The crossover is narrow
A 0.72-point renewable lead is sensitive to methodological differences between independent global estimates, so the result should be read as near parity rather than a wide gap.
Coal still leads individually
The renewable total combines five technologies. No single renewable source approached coal’s output in 2025.
Fossil generation remains dominant
Coal, natural gas and other fossil sources still produced 18,205.04 TWh, more than half of world electricity.
What the Metric Means and How to Read It
This is an output ranking. TWh measures electricity actually generated during the year. It is not the same as installed capacity in GW, because plants operate for different numbers of hours and at different utilisation rates. A high generation rank also does not indicate low emissions, low prices or grid reliability.
Country and regional power mixes differ because of renewable resources, hydrology, fuel access, nuclear fleets, interconnections, industrial demand, weather, policy and legacy infrastructure. The 2025 regional examples show why the same global trend can coincide with falling coal generation in China and India, rising coal generation in the United States and higher gas generation in Europe.
Bioenergy is grouped with renewables for consistency with Ember’s classification, but its climate effect depends on feedstock, land use and supply-chain conditions. The renewable share therefore describes the generation mix, not a complete environmental assessment.
Frequently Asked Questions
Did renewables generate more electricity than coal in 2025?
Ember’s dataset shows a small renewable lead. IEA’s independent estimate rounds both to about 34% and describes them as practically level. Coal remained the largest individual source.
Are the 2025 figures final national statistics?
Not uniformly. Ember uses final annual data where available and estimates the latest year from monthly reporting or other methods where complete annual data are not yet available.
What is included in Other fossil?
Ember defines Other fossil as generation from oil and petroleum products, manufactured gases and waste.
Why did wind and solar grow by more than total generation?
Their combined increase was partly offset by lower coal, other fossil and hydropower generation. Nuclear, bioenergy and other renewables added smaller positive amounts.
Does higher generation mean more installed capacity?
No. Generation is annual output in TWh; capacity is the maximum installed power in GW. Capacity factors and operating conditions determine actual output.
Does renewable generation automatically mean zero emissions?
No. Lifecycle impacts vary by technology. Bioenergy is especially sensitive to feedstock and land-use assumptions.
Why can Ember and IEA produce slightly different world totals?
They compile separate datasets and may differ in source coverage, fuel mapping, treatment of missing data, latest-year estimation and rounding.
Sources
Ember Yearly Electricity Data
Numeric source for world generation, source shares and 2024–2025 changes. Snapshot downloaded July 15, 2026.
https://files.ember-energy.org/public-downloads/yearly_full_release_long_format.csv
Ember Global Electricity Review 2026
Context for the renewable–coal crossover, global coverage and the role of solar growth.
https://ember-energy.org/latest-insights/global-electricity-review-2026/
Ember Electricity Data Methodology
Definitions for fuel mapping, latest-year estimates, gross generation, distributed generation and captive plants.
https://files.ember-energy.org/public-downloads/ember_electricity_data_methodology.pdf
IEA Global Energy Review 2026
Independent comparison of global renewable, coal, gas and nuclear trends and regional drivers in 2025.
https://www.iea.org/reports/global-energy-review-2026/electricity-supply
Related rankings
Closely related StatRanker pages selected by topic. If no strong match exists, fewer links are shown instead of unrelated recommendations.
