

Top Countries in Electricity Production for 2025
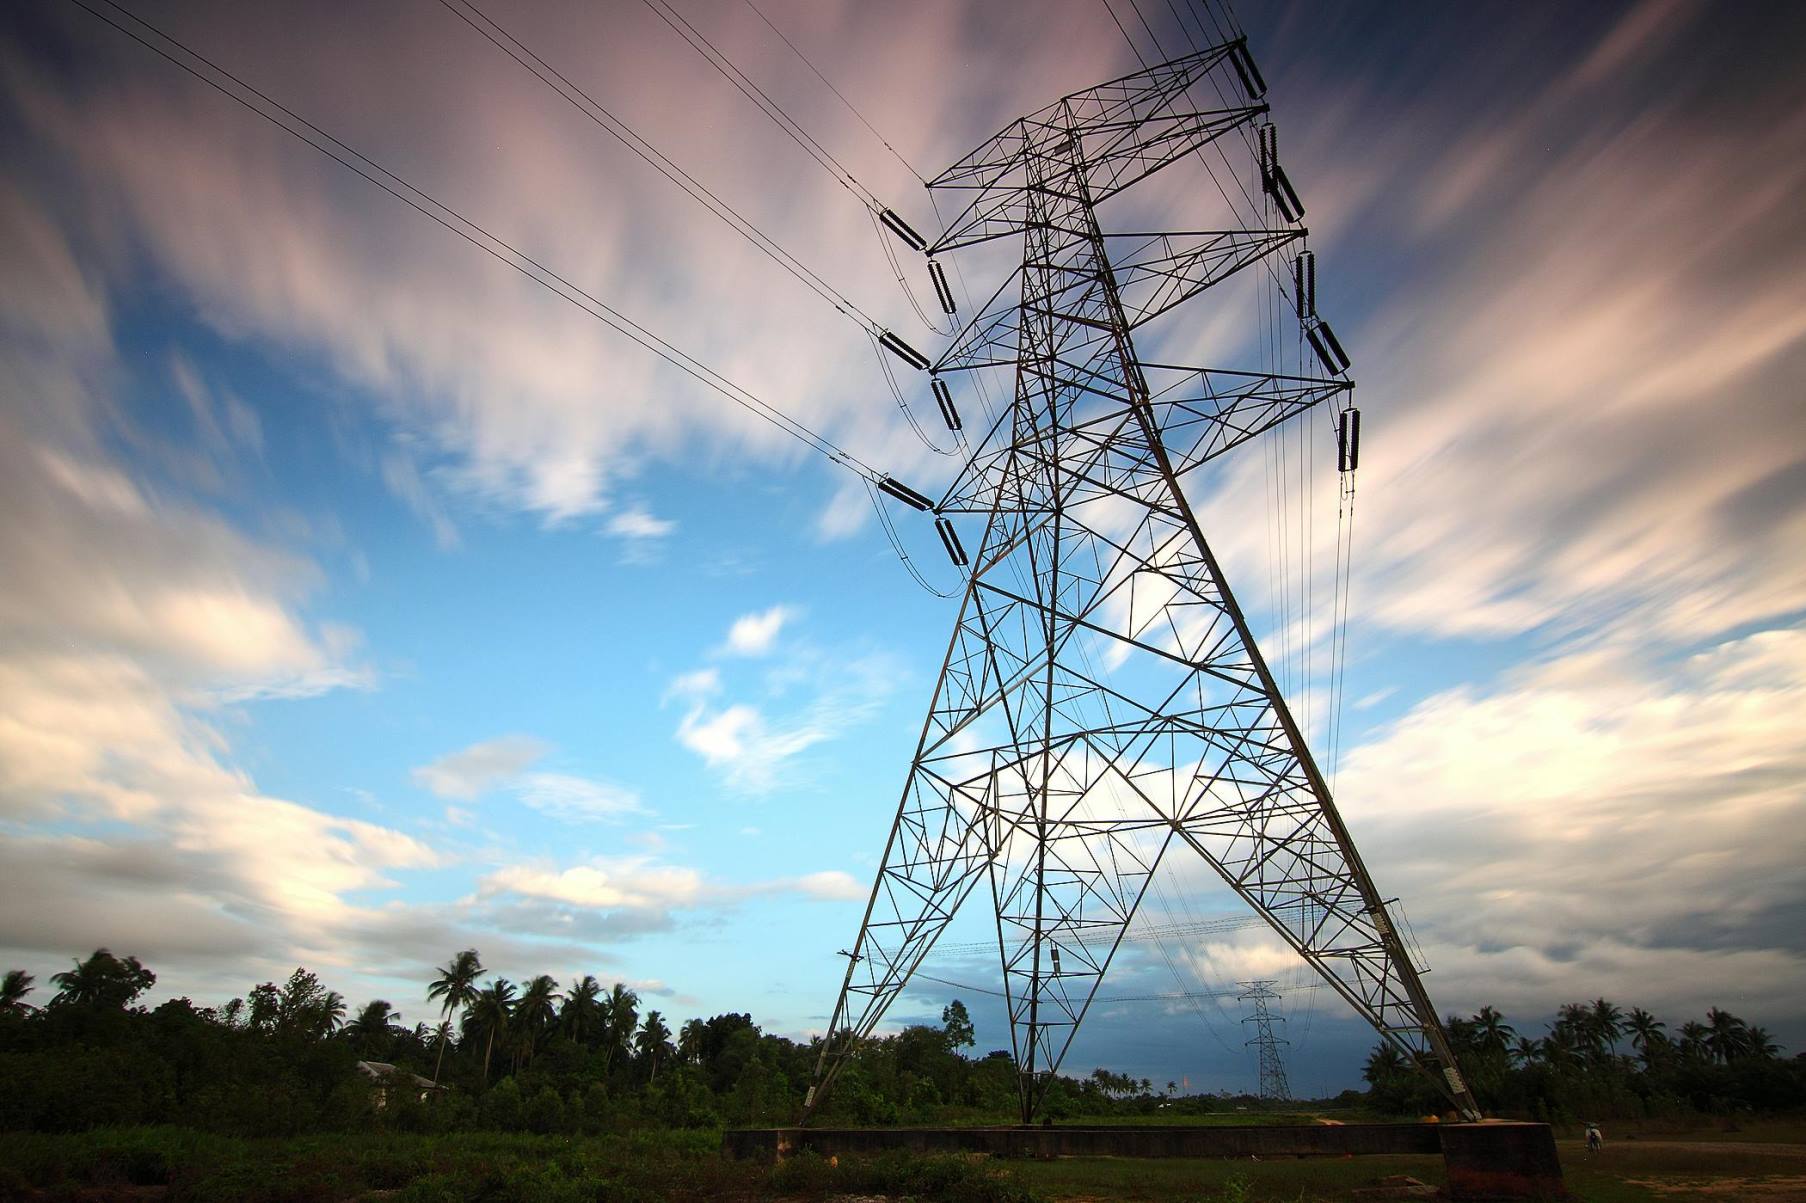
Top Countries and Economies in Electricity Production for 2025
China was the largest electricity producer in the Energy Institute Statistical Review of World Energy 2026, generating 10,575.25 TWh in 2025. The United States ranked second at 4,772.20 TWh, followed by India at 2,055.37 TWh.
This ranking compares 25 countries and separately reported economies by total electricity generation in calendar year 2025. All values are directly published observations from the Energy Institute dataset rather than StatRanker calculations or forecasts.
Coverage: Top 25 confirmed entries · Unit: TWh · Direction: higher generation ranks higher · Source: Energy Institute Statistical Review of World Energy 2026 · Status count: 25 industry_observed_value, 0 calculated_value, 0 official_forecast, 0 modeled_projection.
Continue exploring
More StatRanker pages connected by topic, category or ranking theme.
China generated a little more than twice as much electricity as the United States.
The United States recorded the second-largest electricity-generation value in the dataset.
Thailand is the lower endpoint of this Top 25 ranking, not the lowest electricity producer worldwide.
Countries and separately reported economies are retained when the source publishes them as individual entries.
Absolute electricity generation during calendar year 2025.
Directly published Energy Institute observations; not forecasts and not StatRanker-generated calculations.
What this electricity-production ranking measures
Electricity production here means total electricity generation during the year. Energy Institute methodology reports the series on a gross electrical output basis, covering generation from the full electricity mix rather than a single fuel or technology.
This is a ranking of power-system scale. It does not adjust for population, GDP, installed capacity, electricity prices, reliability, emissions or renewable share.
Generation is also different from final electricity consumption. International electricity trade, power-sector own use and network losses can make the amount generated different from the amount ultimately consumed.
Top 10 electricity producers in 2025
China, the United States and India form the clear top three by absolute electricity output. Russia and Japan complete the group of five entries exceeding 1,000 TWh.
Top 10 by total electricity generation, 2025
| Rank | Entity | Generation | Region / Note |
|---|---|---|---|
| 1 | China | 10,575.25 TWh | Asia-Pacific. Status: industry_observed_value; Source: Energy Institute Statistical Review of World Energy 2026; source release: 2026; observation year: 2025; target year: 2025. |
| 2 | United States | 4,772.20 TWh | North America. Status: industry_observed_value; Source: Energy Institute Statistical Review of World Energy 2026; source release: 2026; observation year: 2025; target year: 2025. |
| 3 | India | 2,055.37 TWh | Asia-Pacific. Status: industry_observed_value; Source: Energy Institute Statistical Review of World Energy 2026; source release: 2026; observation year: 2025; target year: 2025. |
| 4 | Russia | 1,194.44 TWh | Europe & Central Asia. Status: industry_observed_value; Source: Energy Institute Statistical Review of World Energy 2026; source release: 2026; observation year: 2025; target year: 2025. |
| 5 | Japan | 1,027.35 TWh | Asia-Pacific. Status: industry_observed_value; Source: Energy Institute Statistical Review of World Energy 2026; source release: 2026; observation year: 2025; target year: 2025. |
| 6 | Brazil | 763.67 TWh | Latin America. Status: industry_observed_value; Source: Energy Institute Statistical Review of World Energy 2026; source release: 2026; observation year: 2025; target year: 2025. |
| 7 | Canada | 660.18 TWh | North America. Status: industry_observed_value; Source: Energy Institute Statistical Review of World Energy 2026; source release: 2026; observation year: 2025; target year: 2025. |
| 8 | South Korea | 627.84 TWh | Asia-Pacific. Status: industry_observed_value; Source: Energy Institute Statistical Review of World Energy 2026; source release: 2026; observation year: 2025; target year: 2025. |
| 9 | France | 571.76 TWh | Europe. Status: industry_observed_value; Source: Energy Institute Statistical Review of World Energy 2026; source release: 2026; observation year: 2025; target year: 2025. |
| 10 | Germany | 507.53 TWh | Europe. Status: industry_observed_value; Source: Energy Institute Statistical Review of World Energy 2026; source release: 2026; observation year: 2025; target year: 2025. |
Ranking uses the underlying 2025 TWh values in descending order. These are directly published Energy Institute observations, not StatRanker calculations.
Chart: Top 20 electricity producers in 2025
The chart uses the same observed 2025 values as the ranking table. China is used as the 100% visual reference.
Methodology
The ranking uses the electricity-generation series published in the Energy Institute Statistical Review of World Energy 2026 for calendar year 2025. The Energy Institute is an independent professional body, and its Statistical Review combines government and third-party source inputs.
Metric and unit
Total electricity generation measured in terawatt-hours. Energy Institute methodology describes the electricity series as gross electrical output.
Ranking direction
Entries are ordered by raw 2025 TWh from highest to lowest. Larger electricity output receives a higher rank.
Target year
Every included row uses a directly published 2025 observation from the same 2026 Statistical Review release.
Data status
industry_observed_value
This label means the value is an observed figure directly published by the Energy Institute. It is not a StatRanker calculation, forecast or modeled projection, and the label does not imply that the Energy Institute is a national statistical authority.
Coverage
The table contains the 25 highest confirmed individual entries after sorting the source values. Separately reported economies are retained where the Energy Institute publishes them individually.
Regional labels
Broad regions are editorial navigation labels only. They do not change source values or ranking positions.
Missing values and conflicts
No previous-year values are substituted. Figures from different datasets are not averaged with Energy Institute values where definitions or revisions differ.
Limits
The ranking does not measure electricity per capita, installed capacity, renewable share, carbon intensity, prices, reliability or final electricity consumption.
Historical values can be revised in later Statistical Review editions as new source data or methodological updates become available. This page represents the observations published in the 2026 release.
Main ranking: Top 25 electricity producers in 2025
Search the ranking, filter the broad regional labels or data status, change the display order, or limit the table to the Top 10 or Top 20. Rank numbers preserve the original descending 2025 order.
Total electricity generation, 2025
| Rank | Entity | Generation | Region / Note |
|---|---|---|---|
| 1 | China | 10,575.25 TWh | Asia-Pacific. Status: industry_observed_value; Source: Energy Institute Statistical Review of World Energy 2026; source release: 2026; observation year: 2025; target year: 2025. |
| 2 | United States | 4,772.20 TWh | North America. Status: industry_observed_value; Source: Energy Institute Statistical Review of World Energy 2026; source release: 2026; observation year: 2025; target year: 2025. |
| 3 | India | 2,055.37 TWh | Asia-Pacific. Status: industry_observed_value; Source: Energy Institute Statistical Review of World Energy 2026; source release: 2026; observation year: 2025; target year: 2025. |
| 4 | Russia | 1,194.44 TWh | Europe & Central Asia. Status: industry_observed_value; Source: Energy Institute Statistical Review of World Energy 2026; source release: 2026; observation year: 2025; target year: 2025. |
| 5 | Japan | 1,027.35 TWh | Asia-Pacific. Status: industry_observed_value; Source: Energy Institute Statistical Review of World Energy 2026; source release: 2026; observation year: 2025; target year: 2025. |
| 6 | Brazil | 763.67 TWh | Latin America. Status: industry_observed_value; Source: Energy Institute Statistical Review of World Energy 2026; source release: 2026; observation year: 2025; target year: 2025. |
| 7 | Canada | 660.18 TWh | North America. Status: industry_observed_value; Source: Energy Institute Statistical Review of World Energy 2026; source release: 2026; observation year: 2025; target year: 2025. |
| 8 | South Korea | 627.84 TWh | Asia-Pacific. Status: industry_observed_value; Source: Energy Institute Statistical Review of World Energy 2026; source release: 2026; observation year: 2025; target year: 2025. |
| 9 | France | 571.76 TWh | Europe. Status: industry_observed_value; Source: Energy Institute Statistical Review of World Energy 2026; source release: 2026; observation year: 2025; target year: 2025. |
| 10 | Germany | 507.53 TWh | Europe. Status: industry_observed_value; Source: Energy Institute Statistical Review of World Energy 2026; source release: 2026; observation year: 2025; target year: 2025. |
| 11 | Saudi Arabia | 471.43 TWh | Middle East. Status: industry_observed_value; Source: Energy Institute Statistical Review of World Energy 2026; source release: 2026; observation year: 2025; target year: 2025. |
| 12 | Iran | 398.68 TWh | Middle East. Status: industry_observed_value; Source: Energy Institute Statistical Review of World Energy 2026; source release: 2026; observation year: 2025; target year: 2025. |
| 13 | Mexico | 389.73 TWh | North America. Status: industry_observed_value; Source: Energy Institute Statistical Review of World Energy 2026; source release: 2026; observation year: 2025; target year: 2025. |
| 14 | Indonesia | 382.67 TWh | Asia-Pacific. Status: industry_observed_value; Source: Energy Institute Statistical Review of World Energy 2026; source release: 2026; observation year: 2025; target year: 2025. |
| 15 | Türkiye | 369.39 TWh | Europe & Central Asia. Status: industry_observed_value; Source: Energy Institute Statistical Review of World Energy 2026; source release: 2026; observation year: 2025; target year: 2025. |
| 16 | Vietnam | 329.04 TWh | Asia-Pacific. Status: industry_observed_value; Source: Energy Institute Statistical Review of World Energy 2026; source release: 2026; observation year: 2025; target year: 2025. |
| 17 | Spain | 301.48 TWh | Europe. Status: industry_observed_value; Source: Energy Institute Statistical Review of World Energy 2026; source release: 2026; observation year: 2025; target year: 2025. |
| 18 | United Kingdom | 290.56 TWh | Europe. Status: industry_observed_value; Source: Energy Institute Statistical Review of World Energy 2026; source release: 2026; observation year: 2025; target year: 2025. |
| 19 | Taiwan | 288.93 TWh | Asia-Pacific. Status: industry_observed_value; Source: Energy Institute Statistical Review of World Energy 2026; source release: 2026; observation year: 2025; target year: 2025; separately reported source entry. |
| 20 | Australia | 285.92 TWh | Oceania. Status: industry_observed_value; Source: Energy Institute Statistical Review of World Energy 2026; source release: 2026; observation year: 2025; target year: 2025. |
| 21 | Italy | 276.47 TWh | Europe. Status: industry_observed_value; Source: Energy Institute Statistical Review of World Energy 2026; source release: 2026; observation year: 2025; target year: 2025. |
| 22 | Egypt | 242.42 TWh | Africa. Status: industry_observed_value; Source: Energy Institute Statistical Review of World Energy 2026; source release: 2026; observation year: 2025; target year: 2025. |
| 23 | South Africa | 231.10 TWh | Africa. Status: industry_observed_value; Source: Energy Institute Statistical Review of World Energy 2026; source release: 2026; observation year: 2025; target year: 2025. |
| 24 | Malaysia | 210.37 TWh | Asia-Pacific. Status: industry_observed_value; Source: Energy Institute Statistical Review of World Energy 2026; source release: 2026; observation year: 2025; target year: 2025. |
| 25 | Thailand | 200.50 TWh | Asia-Pacific. Status: industry_observed_value; Source: Energy Institute Statistical Review of World Energy 2026; source release: 2026; observation year: 2025; target year: 2025. |
All ranking values are 2025 observations directly published in the Energy Institute Statistical Review of World Energy 2026. Regional labels are used only for navigation.
Insights from the 2025 ranking
Key Insight
China stands in a separate scale tier at 10,575.25 TWh, more than double U.S. electricity generation and more than five times India’s output.
Notable Pattern
Five entries exceed 1,000 TWh: China, the United States, India, Russia and Japan. Brazil, ranked sixth, records 763.67 TWh.
Regional Concentration
Nine Asia-Pacific entries appear in the Top 25: China, India, Japan, South Korea, Indonesia, Vietnam, Taiwan, Malaysia and Thailand.
Outlier
The 5,803.05 TWh gap between China and the United States is larger than the full annual generation value of any entry ranked third or lower.
What this ranking means
The ranking identifies the largest electricity systems by annual output. It should not be interpreted as a ranking of electricity affordability, grid reliability or environmental performance.
Installed capacity is a separate metric. Capacity describes the rated power of generating equipment, while generation measures how much electricity was actually produced over the year.
For related comparisons, see StatRanker’s electricity consumption by country ranking, electricity generation by source, renewable electricity generation per capita ranking and nuclear share in the power mix.
FAQ
Which country produced the most electricity in 2025?
China ranks first with 10,575.25 TWh of electricity generation in the Energy Institute 2025 series.
Which countries ranked second and third?
The United States ranks second at 4,772.20 TWh, while India ranks third at 2,055.37 TWh.
Are these 2025 forecasts?
No. These are observed 2025 values published in the Energy Institute Statistical Review of World Energy 2026. StatRanker does not project missing 2025 values in this ranking.
What does industry_observed_value mean?
It means the figure is an observed value directly published by an industry data source, in this case the Energy Institute. It is not a StatRanker calculation or projection and is not labeled as a national-government official statistic.
Why is Taiwan included?
Taiwan is published as a separate entry in the source dataset and records 288.93 TWh in 2025. This ranking follows individual source entries rather than applying a sovereign-state-only filter.
Is electricity generation the same as electricity consumption?
No. Generation measures electricity produced. Consumption is affected by international trade, power-sector own use and network losses.
Does a high rank mean cleaner electricity?
No. This ranking measures total generation only. It does not compare renewable share, fossil-fuel share, nuclear share or carbon intensity.
Why can another source show a different value?
Datasets can differ because of revisions, gross-versus-net definitions, reporting boundaries and timing. Values from different sources are not averaged in this ranking.
Sources
Energy Institute — Statistical Review of World Energy
Primary publication for the observed 2025 electricity-generation values used in this ranking.
Energy Institute — Data Downloads and Archive
Official Energy Institute download hub for Statistical Review datasets and supporting materials.
https://www.energyinst.org/statistical-review/resources-and-data-downloads
Energy Institute — Statistical Review Methodology
Methodology source for electricity-generation definitions and the gross electrical output basis.
https://www.energyinst.org/__data/assets/file/0007/1827619/Methodology.pdf
Energy Institute — About the Statistical Review
Background on the publisher, compilation process, source inputs and Statistical Review governance.
Related rankings
More StatRanker pages connected by topic, category or ranking theme.
Tomato Production by Country 2026: Official FAOSTAT 2024 Ranking
Open rankingApple Production by Country 2026: Official FAOSTAT 2024 Ranking
Open rankingSugarcane Production by Country 2026: Official FAOSTAT 2024 Ranking
Open rankingBanana Production by Country 2026: Official FAOSTAT 2024 Ranking
Open ranking
StatRanker (Website)
administrator
