

Major U.S. Cities by Average Commute Time, 2026 Snapshot
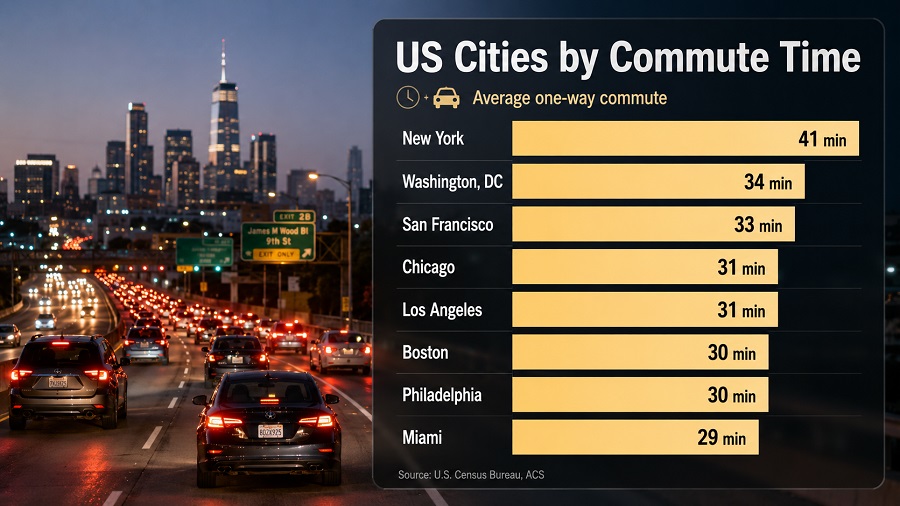
Major U.S. cities with the longest average commute times
This ranking compares average one-way travel time to work among the ten longest-commute cities identified in a published analysis of the 50 largest U.S. cities. The indicator is measured in minutes for workers age 16 and over who traveled to a workplace and did not work from home.
The city rows and year-over-year comparison come from Yardi Kube’s processed extraction from 2024 American Community Survey commute data. National context and metric definitions come from Census ACS 2024 commuting tables. The 2026 label describes this page snapshot, not measured 2026 travel behavior.
Commute time is not a live congestion score, distance measure, affordability index or round-trip estimate. It reflects the usual one-way travel time workers reported for getting from home to work during the survey reference period.
New York City ranks first among the ten listed long-commute cities.
National ACS 2024 mean travel time to work for workers who did not work from home.
The source analysis covers the 50 largest U.S. cities by population; this page displays its ten longest average commute times.
National share of commuters whose one-way travel time was 60 minutes or more in ACS 2024.
What average commute time shows
Average commute time captures the time burden of reaching work, not the physical distance between home and job. A 30-minute commute can be a short but slow urban trip, a multi-leg transit journey, or a longer highway drive from a lower-cost residential area to a regional employment center.
The upper end of this ranking is concentrated in older, dense and high-cost labor markets. The Northeast corridor is visible through New York, Philadelphia, Boston, Washington and Baltimore; California appears through San Francisco, Los Angeles, Long Beach and Oakland; Chicago represents a large Midwestern metro with deep regional commuting flows.
The table should be read as a large-city time-burden comparison. It is not a ranking of every incorporated place in the United States, and smaller commuter-belt municipalities may have longer average travel times.
Top 10 longest average commutes among major U.S. cities
New York is the clear outlier at 40.6 minutes. The next nine cities form a tighter above-average group, mostly between 30 and 34 minutes. The comparison column shows movement versus 2023 in the same published extraction; it is not used to assign rank.
| Rank | City | 2024 time | Change vs. 2023 |
|---|---|---|---|
| 1 | New York, NY | 40.6 min | +0.5 min |
| 2 | Chicago, IL | 33.5 min | +0.5 min |
| 3 | Philadelphia, PA | 33.2 min | +2.1 min |
| 4 | San Francisco, CA | 32.2 min | +1.3 min |
| 5 | Los Angeles, CA | 31.7 min | +0.3 min |
| 6 | Boston, MA | 31.7 min | +1.5 min |
| 7 | Long Beach, CA | 31.2 min | +0.8 min |
| 8 | Oakland, CA | 31.2 min | +1.3 min |
| 9 | Washington, DC | 31.0 min | +0.6 min |
| 10 | Baltimore, MD | 30.2 min | +1.7 min |
Unit: minutes per one-way trip to work. Values are rounded to one decimal minute. The rank column is based on 2024 average commute time, not on the size of the annual change.
Chart: average one-way commute time in the Top 10
The chart shows the scale of New York’s lead and the tight clustering from Chicago through Baltimore. The gap between ranks two and ten is 3.3 minutes, while New York is 7.1 minutes above Chicago.
Methodology
The indicator is mean travel time to work, reported in minutes for workers age 16 and over who did not work at home. In Census commute tables, the measure describes the usual one-way time needed to get from home to work during the reference week, across all transportation modes.
Metric formula
Average commute time = aggregate one-way travel time to work divided by workers age 16 and over who did not work at home.
Data year
The page uses ACS 2024 commute data because it is the latest complete annual ACS commute dataset available for this 2026 page snapshot.
Coverage
The source city analysis covers the 50 largest U.S. cities by population. This page displays the ten cities with the longest average commute times in that published analysis.
Rounding and uncertainty
Values are rounded to one decimal minute. ACS estimates are survey-based, so small differences between nearby ranks should not be overinterpreted.
The city ranking rows use Yardi Kube’s processed extraction from ACS 1-Year commute data, while the national benchmark and metric definition are cross-checked against Census ACS guidance and table S0801. This separation matters because Yardi Kube is the processed source for the displayed city ranking, and Census is the official statistical source for the underlying measure.
City boundaries affect interpretation. A central city can have a different commute profile from its broader metropolitan area because workers, housing supply and job centers are spread across multiple municipalities and counties. A city with extensive transit can still have a long average commute if many trips involve walking to stations, waiting, transfers and long cross-regional movement.
The 2023 comparison column is included to show direction of movement in the same published analysis. It is not used to assign rank and should not be treated as proof of a statistically significant year-to-year change.
Insights from the ranking
New York is structurally different
New York’s 40.6-minute average reflects a very large labor market, extensive public-transit use, cross-borough travel and regional trips into dense employment centers.
The rest of the Top 10 is a tight above-average tier
Chicago through Baltimore range from 33.5 to 30.2 minutes. These cities sit clearly above the U.S. average, but the gaps inside the group are much smaller than New York’s lead.
California’s pattern is regional, not just city-specific
San Francisco, Los Angeles, Long Beach and Oakland point to the commuting pressure of large coastal job markets where housing costs, cross-county travel and multi-center employment patterns shape daily travel time.
The comparison column points to renewed pressure
The displayed comparison column shows increases for all ten listed cities, with larger gains in Philadelphia and Baltimore. Because ACS values are survey estimates, small differences should be read cautiously.
The most useful interpretation is daily time burden. Long average commutes point to the combined effect of housing location, job concentration, transport networks and workplace attendance. They do not prove that one city is worse than another, but they show where reaching work consumes more of the typical commuter’s day.
What commute time means for readers
For residents, average commute time is a practical cost of location. For someone commuting five days a week, a 32-minute one-way average implies more than five hours per week in routine work travel before delays, errands, parking or transfers are added.
For employers, long commutes influence hiring, retention, office attendance and demand for hybrid schedules. A workplace can be inside a large labor market but still be hard to reach for many workers if housing and transport access are poorly aligned.
For local governments and planners, commute time is a signal for housing near jobs, transit reliability, bus priority, regional rail connections, road bottlenecks and land-use policy. The number becomes more useful when paired with affordability, mode choice, income, remote-work share and neighborhood-level access to employment.
FAQ
Which major U.S. city has the longest average commute in this snapshot?
New York City ranks first among the listed major cities, with an average one-way commute time of 40.6 minutes in the ACS 2024-based snapshot.
Is this a ranking of every U.S. city?
No. The source analysis covers the 50 largest U.S. cities by population, and this page displays the ten longest average commute times from that analysis. Smaller suburbs or commuter-belt places may have longer travel times.
Is commute time the same as congestion?
No. Congestion can lengthen travel time, but the Census commute measure also reflects trip distance, transit use, waiting, transfers, regional job patterns and where workers can afford to live.
Does the measure include people working from home?
No. Mean travel time to work applies to workers age 16 and over who did not work at home. Remote workers are part of the broader labor-market picture, but they do not report a usual trip to a separate workplace for this metric.
Why can a city with strong transit still have a long commute?
Transit access can reduce car dependence, but commute time also includes walking to stations, waiting, transfers and long cross-regional trips. Large job centers and expensive housing near employment districts can keep average travel times high even where transit networks are extensive.
Sources
-
Yardi Kube — “Commute Times Approaching Pre-Pandemic Levels as Remote Work Slightly Declines.”
Used for the displayed Top 10 city rows, 2024 commute-time values and the comparison with 2023 in the 50-largest-city analysis.
https://www.yardikube.com/blog/us-commute-times-stats/ -
U.S. Census Bureau — United States Commuting At A Glance: American Community Survey 1-Year Estimates.
Used for the national ACS 2024 benchmark: 27.2-minute mean travel time to work and 9.3% share of workers traveling 60 minutes or more.
https://www.census.gov/topics/employment/commuting/guidance/acs-1yr.html -
U.S. Census Bureau — ACS table S0801, Commuting Characteristics by Sex.
Used for the official definition and statistical context of mean travel time to work for workers age 16 and over who did not work at home.
https://data.census.gov/table/ACSST1Y2024.S0801 -
U.S. Census Bureau — Commuting (Journey to Work).
Used for broader Census guidance on commuting concepts, work-from-home status and journey-to-work interpretation.
https://www.census.gov/topics/employment/commuting.html
