


US Cities by Salary After Rent, 2026
U.S. cities where salaries stretch furthest after rent
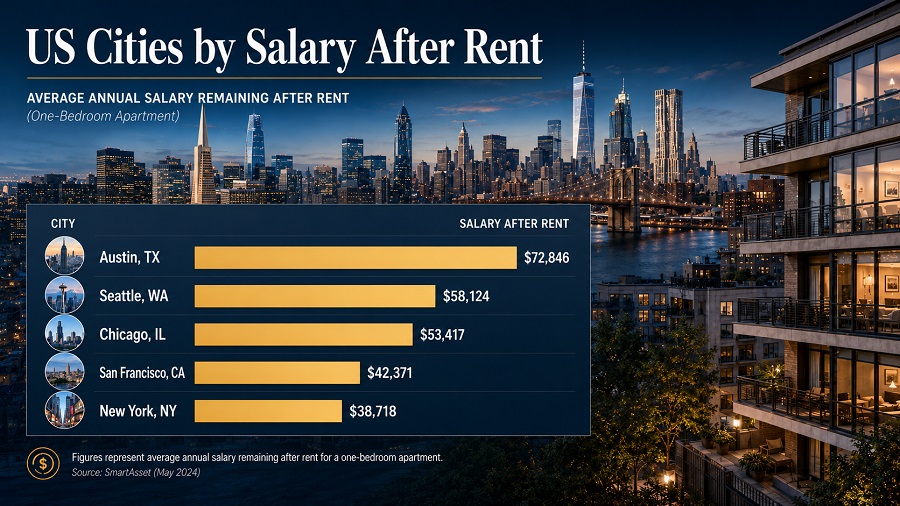
Salary after rent compares estimated monthly take-home pay with the monthly rent for a one-bedroom apartment in the city centre. The 2026 snapshot shows how much money remains after rent in the U.S. city entries included in the dataset.
Thank you for reading this post, don't forget to subscribe!The indicator is expressed in U.S. dollars per month. It is not full disposable income because it excludes utilities, groceries, transport, healthcare, childcare, debt payments, insurance, savings and household-specific tax circumstances.
Seattle ranks first among the U.S. entries shown.
Continue exploring
More StatRanker rankings on wages, income, housing costs and affordability.
Top 100 Cities by Salary After Rent in 2026
Open rankingTop 100 Cities by Rent-to-Income Ratio, 2026
Open rankingTop 50 U.S. States by Rent Burden (Rent-to-Income %), 2025
Open rankingRaleigh is the twentieth entry in this U.S. city table.
Boston has the highest rent burden among the listed U.S. entries.
The page lists the leading U.S. entries available in the 2026 salary-after-rent dataset.
What the upper part of the ranking shows
High pay matters more than low rent
Seattle, San Francisco, Arlington and Washington, DC are not low-cost markets. They rank high because estimated net salaries remain large enough to leave a strong monthly balance after rent.
Rent pressure still changes the result
Boston and Irvine keep high dollar remainders, but their rent burdens are heavy. A strong salary-after-rent value can still leave less flexibility once other monthly costs are included.
Top 20 U.S. cities by salary after rent in 2026
The table ranks the leading U.S. city entries by estimated monthly salary remaining after city-centre one-bedroom rent. Rent burden shows the rent share of estimated monthly net salary.
| U.S. rank | City | Salary after rent | Rent burden |
|---|---|---|---|
| 1 | Seattle, WA | $3,949 | 38.6% |
| 2 | San Francisco, CA | $3,857 | 47.1% |
| 3 | Arlington, VA | $3,817 | 39.4% |
| 4 | Washington, DC | $3,446 | 43.8% |
| 5 | Atlanta, GA | $3,133 | 38.4% |
| 6 | Boston, MA | $3,121 | 52.7% |
| 7 | Tacoma, WA | $3,101 | 36.3% |
| 8 | Oakland, CA | $2,976 | 43.2% |
| 9 | Irvine, CA | $2,945 | 49.5% |
| 10 | Austin, TX | $2,931 | 41.2% |
| 11 | Houston, TX | $2,882 | 37.0% |
| 12 | Ann Arbor, MI | $2,824 | 41.4% |
| 13 | Albany, NY | $2,798 | 33.8% |
| 14 | Boise, ID | $2,741 | 36.2% |
| 15 | Saint Louis, MO | $2,739 | 34.7% |
| 16 | Portland, OR | $2,718 | 42.8% |
| 17 | Rochester, NY | $2,708 | 33.3% |
| 18 | Fort Worth, TX | $2,707 | 37.6% |
| 19 | Salt Lake City, UT | $2,680 | 36.7% |
| 20 | Raleigh, NC | $2,678 | 39.2% |
Values are monthly estimates in U.S. dollars. Rent burden is rent divided by estimated monthly net salary.
Chart: monthly pay left after rent
The chart uses HTML and CSS bars rather than a canvas, so labels remain readable on mobile and the values stay visible without JavaScript.
Methodology
The calculation subtracts estimated monthly rent for a one-bedroom apartment in the city centre from estimated monthly net salary. Both inputs are treated as monthly U.S. dollar values in the 2026 snapshot.
Indicator logic
The result is a rent-adjusted income remainder. A city can rank high with expensive rent if its estimated net salary is high enough.
Rent burden
Rent burden is calculated as monthly rent divided by estimated monthly net salary, then expressed as a percentage.
Snapshot limits
City-centre rent varies sharply by neighbourhood, lease timing, building quality and listing source. Salary estimates also vary by occupation and household profile.
Rounding
Dollar values are rounded to the nearest whole dollar. Rent-burden percentages are shown to one decimal place.
The metric should be read as a comparable affordability screen, not as a full household budget. It does not include non-rent costs or the difference between individual and household income.
Insights from the 2026 ranking
At the top, Seattle, San Francisco and Arlington show the strongest rent-adjusted balances. Their advantage comes from high estimated take-home pay rather than low housing costs.
The middle of the listed group includes cities such as Houston, Ann Arbor, Albany, Boise and Saint Louis. These entries generally combine moderate rent pressure with enough salary strength to stay competitive after rent.
The lower part of the Top 20 still remains above $2,600 per month after rent. Portland, Rochester, Fort Worth, Salt Lake City and Raleigh are not weak outcomes; they simply sit below the high-salary coastal and federal-region markets at the top.
What this means for readers
For workers comparing job offers, salary after rent gives a clearer first filter than salary alone. A larger nominal salary can be offset by rent, while a slightly lower salary can perform better in a less pressured rental market.
For employers, the metric helps explain why pay expectations differ across cities. Housing costs affect relocation decisions, hiring competitiveness and the real value of compensation packages.
For analysts and local policymakers, the ranking highlights the connection between labour-market strength and housing affordability. A high-income city can still create affordability stress if rent absorbs too much of monthly pay.
FAQ
Which U.S. city ranks first by salary after rent in this 2026 table?
Seattle ranks first among the listed U.S. entries, with an estimated $3,949 left after monthly city-centre one-bedroom rent.
Is salary after rent the same as disposable income?
No. Disposable income requires a wider household budget that includes food, transport, utilities, healthcare, insurance, debt, savings and taxes.
Why can San Francisco rank near the top if rent is expensive?
San Francisco ranks high because estimated net salary is also high. Its rent burden is still heavy, so the result should be interpreted together with other living costs.
Does the ranking compare every U.S. city?
No. It compares the U.S. city entries available in the 2026 salary-after-rent dataset used for this table.
What should a renter check before using this for relocation?
Check actual neighbourhood rent, commute costs, health insurance, local taxes, household size, job security and whether the salary offer matches your occupation and experience level.
Sources
- StatRanker — Top 100 Cities by Salary After Rent in 2026
Used as the ranking source for the 2026 salary-after-rent city dataset. - Numbeo — Average Monthly Net Salary by City
Used for estimated monthly net salary input. - Numbeo — One-Bedroom Apartment Rent in City Centre by City
Used for the rent input in the salary-after-rent calculation. - U.S. Bureau of Labor Statistics — Occupational Employment and Wage Statistics
Reference source for occupational wage context in U.S. labour-market interpretation. - U.S. Census Bureau — American Community Survey 1-Year Data
Reference source for broader housing and income context.
Related rankings
More StatRanker rankings on wages, income, housing costs and affordability.
U.S. Metro Areas by Monthly Rent, 2026
Open rankingCalifornia Cities by Rent Burden
Open rankingUS Cities by Median Rent, 2026
Open rankingUS Cities by Rent Burden, 2026
Open rankingTop 100 Cities by Average Rent for 1-Bedroom Apartment, 2026
Open rankingTop 100 Cities by Housing Affordability (Price-to-Income Ratio), 2025
Open rankingTop 100 Countries by Cost of Housing vs Income, 2026
Open rankingCalifornia Cities by Median Home Sale Price, 2026
Open rankingStatRanker (Website)
administrator
