

Top 10 Airports by Cargo Volume, 2026
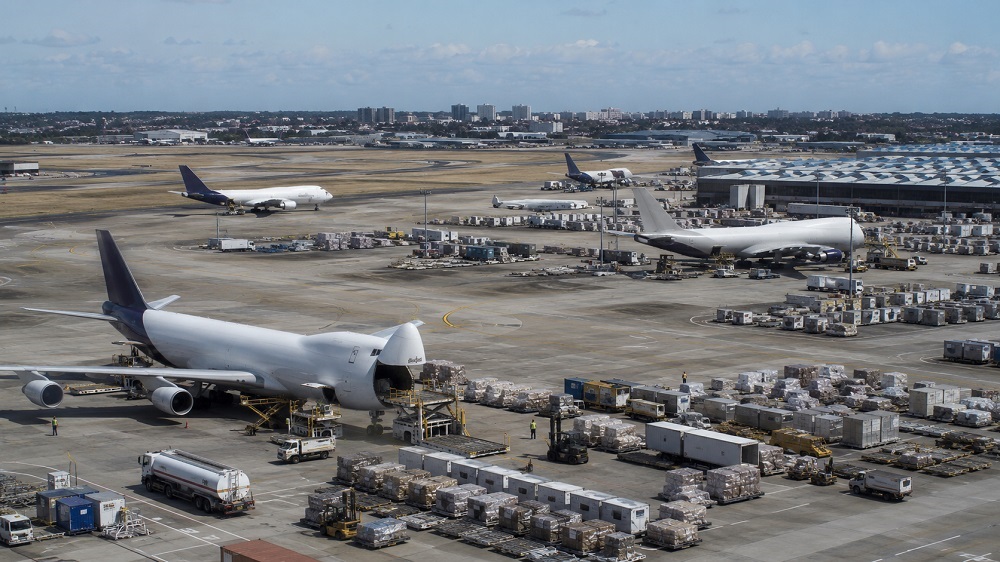
Busiest cargo airports by handled tonnes
Airport cargo volume measures the weight of freight and mail handled by an airport during the reporting year, expressed in metric tonnes. It reflects airport throughput, not airline cargo revenue, cargo value, passenger baggage, warehouse capacity or customs performance.
This 2026 snapshot uses ACI World’s preliminary 2025 airport traffic rankings, released on April 14, 2026. ACI estimated global air cargo volume at almost 128.9 million metric tonnes in 2025, up 2.9% year over year and almost 8.8% above 2019. The ten leading cargo airports handled close to 26% of global airport cargo traffic.
The public ACI release provides a preliminary Top 10 cargo snapshot. The table is therefore limited to airports with published values in that release and in the industry cross-check used for year-over-year figures.
Continue exploring
More StatRanker pages connected by topic, category or ranking theme.
Top 50 Airports by International Passenger Traffic, 2026
Open rankingTop 50 Airports by Passenger Traffic, 2026
Open rankingBusiest Airports by Passenger Traffic: 2026 Update Based on 2025 Data
Open rankingHong Kong International Airport ranked first with 5,070,256 tonnes.
Estimated worldwide airport cargo volume in 2025.
The ten busiest cargo airports accounted for close to 26% of global airport cargo traffic.
Preliminary 2025 actuals released in April 2026; final rankings may adjust slightly after full reporting.
What the 2026 cargo snapshot shows
The upper tier of global airport cargo is split between Asian export gateways, North American express hubs and a smaller number of long-haul transfer airports. Hong Kong and Shanghai Pudong remained first and second, confirming the continuing weight of Asia-Pacific manufacturing, e-commerce and high-value trade flows.
North America’s strongest cargo airports have a different profile. Anchorage benefits from its trans-Pacific location, while Louisville and Memphis are shaped by integrated parcel networks. Miami stands out because of Latin America–US flows, perishables, pharmaceuticals and regional freight specialization.
Cargo rankings do not mirror passenger rankings. An airport can handle fewer passengers than a global passenger hub and still rank higher in cargo if it has dedicated freighter capacity, express sorting infrastructure, strong customs connectivity or a strategic role in long-distance freight routing.
Top 10 airports by cargo volume
Hong Kong International Airport led the 2026 snapshot with just over 5.07 million tonnes of cargo. Shanghai Pudong remained second, while Anchorage moved into third place. The list shows a concentrated mix of express networks, electronics flows, perishables, pharmaceuticals and long-haul transfer traffic.
| Rank | Airport | Cargo tonnes | YoY |
|---|---|---|---|
| 1 | Hong Kong International Airport (HKG) | 5,070,256 | +2.7% |
| 2 | Shanghai Pudong International Airport (PVG) | 4,096,016 | +8.6% |
| 3 | Ted Stevens Anchorage International Airport (ANC) | 3,854,614 | +4.2% |
| 4 | Louisville Muhammad Ali International Airport (SDF) | 3,396,437 | +13.5% |
| 5 | Miami International Airport (MIA) | 3,128,165 | +13.6% |
| 6 | Memphis International Airport (MEM) | 2,969,502 | −20.9% |
| 7 | Incheon International Airport (ICN) | 2,954,684 | +0.3% |
| 8 | Hamad International Airport (DOH) | 2,614,214 | −0.1% |
| 9 | Taiwan Taoyuan International Airport (TPE) | 2,499,899 | +10.1% |
| 10 | Guangzhou Baiyun International Airport (CAN) | 2,439,248 | +2.4% |
Source: ACI World preliminary 2025 airport traffic rankings released in April 2026, with metric tonnes used as the unit of comparison. Year-over-year values are cross-checked against the cited industry summary.
Chart: cargo volume among the leading airports
The top ten range from just over 5.07 million tonnes at Hong Kong International Airport to 2.44 million tonnes at Guangzhou Baiyun. The first two positions remain distinctly above the rest of the top tier, while several airports from third to seventh form a compact high-volume group.
Methodology
The ranking uses airport-level cargo throughput measured in metric tonnes. It ranks individual airports, not countries, airport systems, airlines, logistics companies or metropolitan regions. The order is based on total cargo handled during the reporting year.
Indicator definition
Cargo volume means freight and mail handled by an airport during the year, measured in metric tonnes. It is a throughput measure, not a measure of cargo value or airline revenue.
Data period
The values are preliminary 2025 actuals released by ACI World on April 14, 2026. They are used as the latest available 2026 snapshot for airport cargo traffic.
Ranking logic
Airports are ranked from highest to lowest cargo tonnage. Exact tonnes are kept in the tables; summary text rounds selected values to millions for readability.
Limitations
Cargo tonnage does not capture shipment value, cold-chain quality, customs speed, warehouse capacity, route reliability, profitability or the split between belly cargo and freighter cargo.
ACI describes these figures as preliminary. Final annual traffic datasets can revise airport positions slightly after detailed submissions are completed. The main pattern is still clear: cargo traffic is highly concentrated among a small group of Asian gateways, North American express hubs and strategic long-haul transfer points.
The metric should not be compared directly with passenger traffic. Passenger megahubs may carry substantial belly cargo, but dedicated freighter networks and parcel-sorting operations can push airports such as Louisville, Memphis and Anchorage much higher in cargo rankings than in passenger rankings.
Ranking table: top cargo airports by handled tonnes
The table lists the ten airports with published preliminary 2025 cargo values in the ACI World 2026 snapshot. Search and filter options help compare regions and airport types without changing the underlying ranking.
| Rank | Airport | Region | Cargo tonnes |
|---|---|---|---|
| 1 | Hong Kong International Airport (HKG) | Asia-Pacific | 5,070,256 |
| 2 | Shanghai Pudong International Airport (PVG) | Asia-Pacific | 4,096,016 |
| 3 | Ted Stevens Anchorage International Airport (ANC) | North America | 3,854,614 |
| 4 | Louisville Muhammad Ali International Airport (SDF) | North America | 3,396,437 |
| 5 | Miami International Airport (MIA) | North America | 3,128,165 |
| 6 | Memphis International Airport (MEM) | North America | 2,969,502 |
| 7 | Incheon International Airport (ICN) | Asia-Pacific | 2,954,684 |
| 8 | Hamad International Airport (DOH) | Middle East | 2,614,214 |
| 9 | Taiwan Taoyuan International Airport (TPE) | Asia-Pacific | 2,499,899 |
| 10 | Guangzhou Baiyun International Airport (CAN) | Asia-Pacific | 2,439,248 |
Source: ACI World preliminary 2025 airport traffic rankings, released April 14, 2026. Values are metric tonnes.
Key insights from the cargo-airport ranking
Asia-Pacific anchors the gateway layer
Hong Kong, Shanghai Pudong, Incheon, Taiwan Taoyuan and Guangzhou show how strongly air cargo remains tied to electronics, high-value manufacturing, cross-border e-commerce and dense Asian trade corridors.
Express networks shape North America
Louisville and Memphis rank high because integrated parcel networks concentrate sorting and redistribution at dedicated super-hubs. Their cargo role is much larger than their passenger profile would suggest.
Anchorage is the clearest geography-driven outlier. Its position reflects the logic of trans-Pacific freighter routing, where location, refueling capability and operational flexibility matter more than the size of the local consumer market.
Miami’s cargo profile is closely tied to Latin America and the Caribbean. Perishables, flowers, pharmaceuticals and time-sensitive regional trade help explain why it ranks ahead of many larger passenger hubs.
The lower end of the disclosed top ten still represents enormous scale. Guangzhou Baiyun, ranked tenth in this snapshot, handled more than 2.4 million tonnes, showing how concentrated global air cargo remains among a small set of high-capacity gateways.
What cargo volume means for readers
For shippers, high cargo volume can indicate route density, handling scale, freight-forwarder depth and the presence of specialized cargo services. It does not automatically mean the airport is the cheapest or fastest option for every shipment, but it often signals a mature logistics ecosystem.
For investors, cargo rankings point to places where demand for warehouses, cold-chain facilities, express sorting, apron capacity and airport-adjacent industrial real estate can be structurally stronger.
For policymakers, large cargo hubs are strategic infrastructure. They support trade resilience, emergency logistics, medical supply chains, semiconductor and electronics flows, perishables exports and e-commerce distribution.
For analysts, airport cargo tonnage should be compared with passenger traffic, airline networks, regional manufacturing output, customs performance, trucking connectivity and the split between belly cargo and dedicated freighter capacity.
FAQ
Which airport handled the most cargo in the 2026 snapshot?
Hong Kong International Airport ranked first with 5,070,256 metric tonnes in ACI World’s preliminary 2025 cargo ranking released in April 2026.
Is this a Top 100 airport cargo ranking?
No. This version is limited to the ten airports with published preliminary values in the cited 2026 snapshot. A Top 100 version should include all 100 airport rows from a complete annual airport traffic dataset.
Does airport cargo volume include passenger baggage?
No. Airport cargo rankings refer to freight and mail handled as air cargo. Passenger baggage belongs to passenger operations and should not be treated as cargo throughput.
Why is Anchorage ranked so high?
Anchorage is strategically located on trans-Pacific routes between Asia and North America. Its geography supports refueling, transfer flows and freighter operations that are much larger than local cargo demand alone.
Why do Louisville and Memphis rank above many larger passenger airports?
Louisville and Memphis are shaped by integrated express networks. UPS and FedEx operations concentrate large overnight sorting and parcel flows at these airports, making them cargo super-hubs.
Is cargo volume the same as cargo value?
No. This ranking measures tonnes, not monetary value. A tonne of electronics or pharmaceuticals can be worth much more than a tonne of lower-value freight.
Why can a passenger megahub rank lower in cargo?
Passenger traffic and cargo traffic depend on different operating models. A passenger hub may move cargo in aircraft belly holds, while a dedicated express or freighter hub can handle far more total tonnes.
How often should the ranking be updated?
The table should be updated when ACI publishes final annual airport traffic data or a newer preliminary ranking. If a full Top 100 dataset is used later, every airport row should be added directly to the HTML table.
Sources
-
Airports Council International (ACI World) — World’s busiest airports revealed in latest global rankings, April 14, 2026
Main source for the preliminary 2025 cargo snapshot, global cargo volume, top-ten concentration, ranking context and final-data caveat. -
ACI World Store — Data & Reports / Annual World Airport Traffic Dataset
Used to identify the official ACI data environment for full annual airport traffic datasets. -
Air Cargo Week — Top 10 air cargo airports in 2025 revealed
Secondary industry cross-check for published Top 10 cargo values, airport codes and year-over-year changes.
Related rankings
More StatRanker pages connected by topic, category or ranking theme.
Top Countries by Passenger Car Production, 2025 Snapshot
Open rankingLargest Car Manufacturers by Vehicle Sales: 2026 Snapshot
Open rankingTop 100 Airlines by Passengers Carried, 2026 Snapshot
Open rankingTop 100 Countries by Air Transport Passengers Carried, Latest Year
Open ranking
StatRanker (Website)
administrator
