

Largest Car Manufacturers by Vehicle Sales: 2026 Snapshot
Global Automotive Group Sales Leaders Based on 2025 Reported Volumes
This ranking compares global automotive groups by reported 2025 vehicle sales or deliveries. Toyota and Volkswagen are anchored in company-published annual figures; the remaining rows use public industry ranking tables because manufacturers do not all report global group volume on the same basis.
The metric counts vehicles sold or delivered by manufacturer group, not revenue, profit, production capacity or single-brand registrations. It is a scale measure for corporate auto groups, not a ranking of profitability, brand strength or factory output.
Key figures
Toyota remained the largest group; its published total includes Toyota, Lexus, Daihatsu and Hino.
Toyota, Hyundai-Kia and BYD show the weight of Japanese, Korean and Chinese groups near the top of global volume.
Geely shows the strongest growth among the listed groups, helped by China’s domestic scale and export expansion.
Coverage is limited to the largest manufacturer groups with usable annual global volume figures.
Overview of the 2025 sales leaders
The upper end of the ranking is led by groups with broad geographic coverage, multi-brand portfolios and deep distribution networks. Toyota, Volkswagen and Hyundai-Kia remain structurally larger than most rivals because they combine mass-market brands, commercial vehicles or premium divisions with strong positions across Asia, Europe and North America.
The main shift is the acceleration of Chinese manufacturers. BYD, Geely and Changan show how quickly volume is moving toward electrified vehicles, domestic Chinese scale and export growth. BYD’s position is especially important because it is built around new-energy vehicles rather than traditional internal-combustion volume alone.
Top 10 automotive groups by reported 2025 volume
| Rank | Manufacturer group | 2025 sales | YoY |
|---|---|---|---|
| 1 | Toyota | 11,322,575 | +3% |
| 2 | Volkswagen Group | 8,983,978 | −1% |
| 3 | Hyundai-Kia | 7,272,453 | +1% |
| 4 | General Motors | 6,183,928 | +3% |
| 5 | Stellantis | 5,600,000 | +1% |
| 6 | Ford | 4,650,000 | +4% |
| 7 | BYD | 4,602,436 | +8% |
| 8 | Honda | 3,521,905 | −5% |
| 9 | Suzuki | 3,295,013 | +2% |
| 10 | Nissan | 3,202,137 | −4% |
Unit: vehicles sold or delivered in 2025, depending on manufacturer reporting language. The full 15-row table appears below.
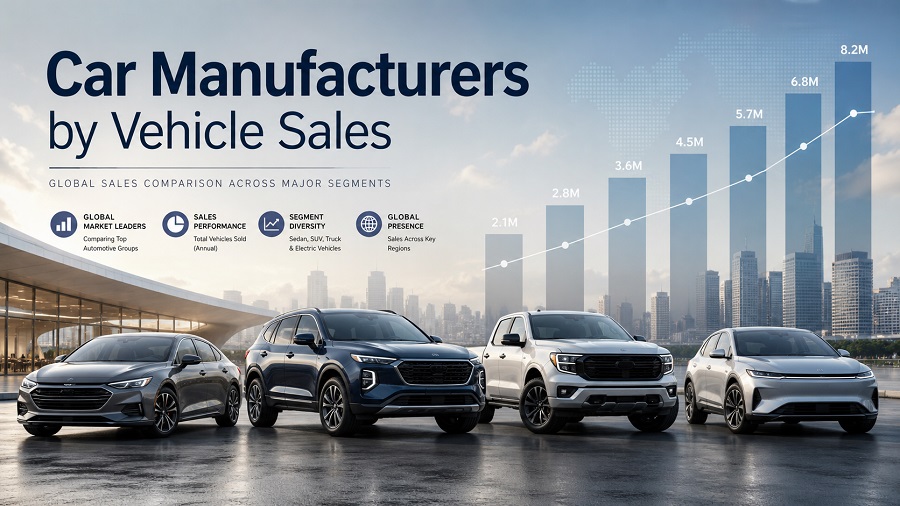
Chart: sales volume among the largest manufacturers
Bar lengths are scaled to Toyota’s 2025 volume, the highest value in the table.
Methodology
The ranking uses 2025 full-year vehicle sales or deliveries by automotive group. The table uses vehicles as the unit, with values rounded only where the public source reports rounded figures. YoY values follow the reporting basis used for each manufacturer group.
Manufacturer groups are used instead of single brands. For example, Volkswagen Group includes brands such as Volkswagen, Audi, Porsche and Škoda; Hyundai-Kia combines Hyundai, Kia and Genesis; Stellantis combines brands such as Peugeot, Fiat, Jeep, Citroën and others. This makes the ranking a corporate group comparison rather than a brand popularity ranking.
The main limitation is comparability. Automakers may report retail sales, wholesale sales, deliveries, registrations, group totals or brand totals. Some totals include commercial vehicles or subsidiaries; others focus on passenger vehicles or brand-group deliveries. Close differences between nearby ranks should therefore be treated cautiously.
Main table: largest automotive groups by reported 2025 volume
| Rank | Manufacturer group | 2025 sales | YoY |
|---|---|---|---|
| 1 | Toyota | 11,322,575 | +3% |
| 2 | Volkswagen Group | 8,983,978 | −1% |
| 3 | Hyundai-Kia | 7,272,453 | +1% |
| 4 | General Motors | 6,183,928 | +3% |
| 5 | Stellantis | 5,600,000 | +1% |
| 6 | Ford | 4,650,000 | +4% |
| 7 | BYD | 4,602,436 | +8% |
| 8 | Honda | 3,521,905 | −5% |
| 9 | Suzuki | 3,295,013 | +2% |
| 10 | Nissan | 3,202,137 | −4% |
| 11 | Geely | 3,024,567 | +39% |
| 12 | Changan | 2,913,177 | +9% |
| 13 | BMW Group | 2,463,715 | +1% |
| 14 | Renault Group | 2,336,807 | +3% |
| 15 | Mercedes-Benz Group | 2,160,354 | −10% |
Coverage: 15 manufacturer groups. Data year: 2025. Unit: vehicles sold or delivered, depending on manufacturer reporting language.
What the sales ranking shows
The ranking shows that legacy global groups still dominate absolute volume because they control dense dealer networks, large fleet channels and multi-brand portfolios. Toyota’s lead is especially large: its 2025 volume is more than twice Ford’s and almost five times Renault Group’s reported sales.
The growth pattern is different from the volume pattern. Geely, Changan and BYD show stronger momentum than most older groups, reflecting China’s scale, competitive electrified models and export growth. Honda, Nissan and Mercedes-Benz declined, showing that pressure is visible in both mass-market and premium segments.
What manufacturer volume means in the auto market
Manufacturer volume matters because modern vehicle platforms, batteries, software systems and safety technology are expensive to develop. Large groups can spread those costs across more models and regions. The ranking also separates local brand visibility from global scale: a brand may dominate one market but belong to a much smaller group worldwide.
The rise of BYD, Geely and Changan also changes the competitive map. China is no longer only the largest sales market; it is becoming a source of global-scale manufacturers, especially in electrified vehicles and export-oriented models.
FAQ
Why does the table stop at 15 groups?
Below the largest manufacturers, public reporting becomes less consistent across sales, deliveries, registrations, wholesale figures and brand-level totals. The 15-row cut-off keeps the comparison focused on groups with usable annual global volume figures.
Are these brand sales or group sales?
They are manufacturer group sales. Toyota includes Toyota group activity, Volkswagen Group includes multiple brands, and Hyundai-Kia combines Hyundai, Kia and Genesis.
Does vehicle sales mean production?
No. Sales, deliveries and production are different measures. This table ranks reported vehicle sales or deliveries, not factory output.
Why are Chinese manufacturers rising so quickly?
China combines the world’s largest domestic auto market, strong EV supply chains, aggressive pricing, fast model cycles and rising exports. That combination is moving BYD, Geely and Changan higher in global rankings.
Sources
- OICA — Sales Statistics. Provides global vehicle-sales context and market-level definitions.
- F&I Tools — Worldwide Car Sales by Manufacturer. Public manufacturer ranking used for the broader 15-row comparison where company reporting bases differ.
- CarNewsChina — 2025 global automaker ranking summary. Cross-check for Chinese manufacturer movement in the global top group.
- CarExpert — Global auto sales 2025. Additional cross-check for top-group order and growth pattern.
- Toyota — 2025 sales, production and export results. Company source for Toyota’s reported 2025 group total.
- Volkswagen Group — 2025 deliveries. Company source for Volkswagen Group’s reported 2025 delivery total and YoY movement.
Information updated: May 3, 2026. Figures are 2025 annual manufacturer-group sales or delivery data.
StatRanker (Website)
administrator
