

U.S. Metro Areas by Population: 2026 Snapshot Based on 2025 Census Estimates
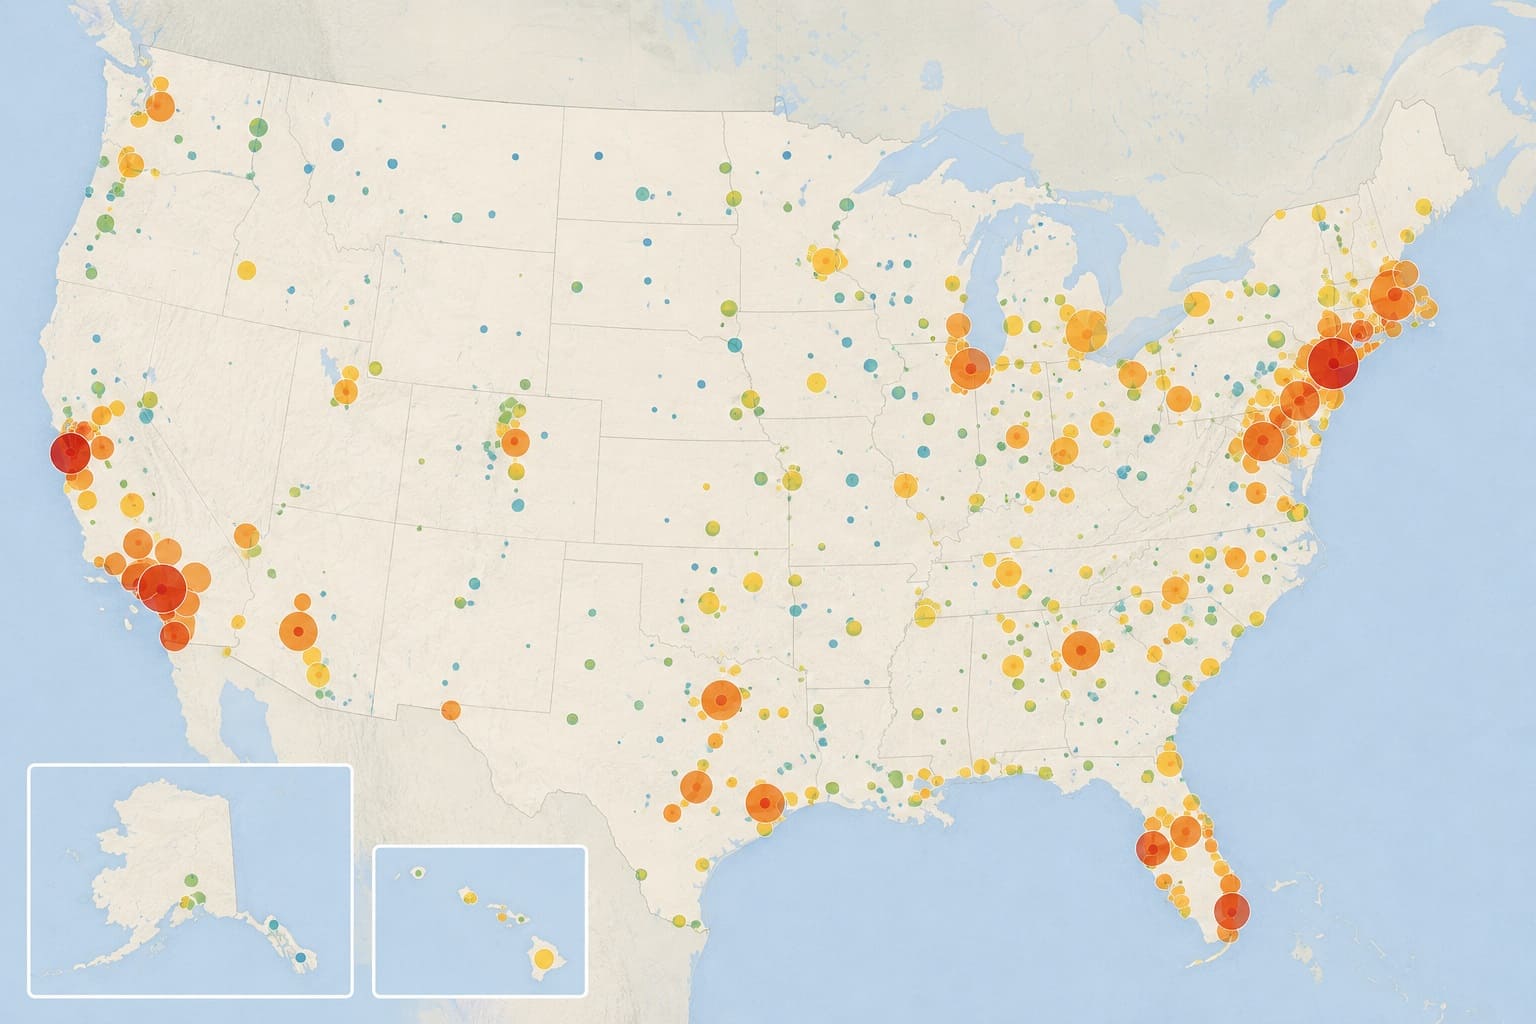
New York Leads the 2025 U.S. Metro Population Ranking
New York-Newark-Jersey City is the largest U.S. metropolitan statistical area in the Census Bureau Vintage 2025 estimates, followed by Los Angeles-Long Beach-Anaheim and Chicago-Naperville-Elgin. The metric is resident population within each official metropolitan statistical area as of July 1, 2025.
This 2026 snapshot covers the Top 100 of 387 MSAs in the 50 states and the District of Columbia using the official Census release published on March 26, 2026. All 100 entries are official Census estimates; no forecasts or modeled projections are used. Puerto Rico MSAs are excluded, and the ranking does not mix metro population with city proper, combined statistical area, GDP, rent or growth measures.
Coverage is limited to confirmed official MSA records. Higher population ranks higher, and every displayed row uses the same unit, geography type and July 1, 2025 reference date.
Continue exploring
More StatRanker rankings on population structure, growth and demographic change.
U.S. States by Population: 2026 Snapshot Based on 2025 Census Estimates
Open rankingMost Populous ZIP Codes in the U.S. 2026: Top 100 Census ZCTAs
Open rankingLargest U.S. Counties by Population 2026: Top 100
Open rankingOverview: what this metropolitan population ranking measures
A metropolitan statistical area is a county-based geographic entity delineated by the U.S. Office of Management and Budget for federal statistical use. It contains at least one urban area with 50,000 or more people, together with adjacent counties that have strong social and economic integration with the core, primarily measured through commuting ties.
The values below are Census Bureau estimates of resident population, not decennial census counts and not projections for 2026. Every row uses the same July 1, 2025 reference date, the same population concept and the same official metropolitan geography framework.
Metro population is not city proper population. An MSA can include multiple cities, suburbs and entire counties across state lines. It is also not a combined statistical area, which can aggregate two or more adjacent metropolitan or micropolitan areas.
Top 10 U.S. metropolitan areas by 2025 population
The Top 10 are ranked strictly by the official July 1, 2025 resident population estimate. New York is the only MSA above 20 million, while Los Angeles is the only other MSA above 10 million.
Top 10 metropolitan statistical areas by resident population
| Rank | Metro area | Population | State(s) / note |
|---|---|---|---|
| 1 | New York-Newark-Jersey City, NY-NJ | 20,112,448 | NY-NJ · Official Census estimate · July 1, 2025 |
| 2 | Los Angeles-Long Beach-Anaheim, CA | 12,844,441 | CA · Official Census estimate · July 1, 2025 |
| 3 | Chicago-Naperville-Elgin, IL-IN | 9,434,123 | IL-IN · Official Census estimate · July 1, 2025 |
| 4 | Dallas-Fort Worth-Arlington, TX | 8,477,157 | TX · Official Census estimate · July 1, 2025 |
| 5 | Houston-Pasadena-The Woodlands, TX | 7,904,627 | TX · Official Census estimate · July 1, 2025 |
| 6 | Atlanta-Sandy Springs-Roswell, GA | 6,482,182 | GA · Official Census estimate · July 1, 2025 |
| 7 | Washington-Arlington-Alexandria, DC-VA-MD-WV | 6,465,724 | DC-VA-MD-WV · Official Census estimate · July 1, 2025 |
| 8 | Miami-Fort Lauderdale-West Palm Beach, FL | 6,391,072 | FL · Official Census estimate · July 1, 2025 |
| 9 | Philadelphia-Camden-Wilmington, PA-NJ-DE-MD | 6,329,118 | PA-NJ-DE-MD · Official Census estimate · July 1, 2025 |
| 10 | Phoenix-Mesa-Chandler, AZ | 5,228,938 | AZ · Official Census estimate · July 1, 2025 |
Ranks are calculated from the unrounded July 1, 2025 Census estimates, from largest to smallest.
Chart: Top 20 U.S. metro areas by population
The bar lengths use the exact Census estimates from the table. Labels are shortened to millions for readability, while the ranking tables retain the full resident counts.
Methodology
The metric is the U.S. Census Bureau annual estimate of resident population for each metropolitan statistical area as of July 1, 2025. Higher population ranks higher. The table uses one official numeric dataset, CBSA-MET-EST2025-POP, and the official MSA titles supplied in that file.
Metric and unit
Metric: resident population estimate. Unit: persons. Direction: descending. Values are shown as whole residents with comma separators and are not converted to percentages, per-capita rates or monetary measures.
Target year and status
Target date: July 1, 2025. This 2026 publication uses the latest completed Vintage 2025 estimates. Every included value is an official Census estimate; no forecasts or modeled projections are used.
Geographic definition
Only official metropolitan statistical areas are included. The current delineations apply the 2020 standards and were announced by OMB in July 2023. City proper, micropolitan area, metropolitan division and combined statistical area records are excluded.
Coverage and exclusions
Coverage includes the Top 100 of the 387 MSAs in the 50 states and District of Columbia. Six Puerto Rico MSAs in the broader Census workbook are excluded from this U.S. comparison.
Inclusion rule: a row must be an official MSA record in the Census table and have a July 1, 2025 population estimate. Missing values are not imputed, and no conflicting sources are averaged. Census supplies every ranking value; OMB and Census geography documentation are used to define the statistical area.
Ranking formula: sort each included MSA by its July 1, 2025 resident population estimate from highest to lowest; assign rank 1 to the largest value and continue sequentially through rank 100. No rounding occurs before ranking.
Limits: a metropolitan estimate describes the official county-based area, not the population inside a single municipal boundary. It does not measure economic output, rent, density, land area, affordability, quality of life or population growth. Vintage estimates are revised when a new annual vintage is released, so earlier published estimates can be superseded.
Main ranking: Top 100 U.S. metro areas by population
Narrow the table by metro name or state code, then reorder it by rank, population or name. Top 10 and Top 20 views provide shorter comparisons, while the full view retains all 100 confirmed entries.
Showing 100 entries.
Top 100 metropolitan statistical areas by July 1, 2025 resident population
| Rank | Metro area | Population | State(s) / note |
|---|---|---|---|
| 1 | New York-Newark-Jersey City, NY-NJ | 20,112,448 | NY-NJ · Official Census estimate · July 1, 2025 |
| 2 | Los Angeles-Long Beach-Anaheim, CA | 12,844,441 | CA · Official Census estimate · July 1, 2025 |
| 3 | Chicago-Naperville-Elgin, IL-IN | 9,434,123 | IL-IN · Official Census estimate · July 1, 2025 |
| 4 | Dallas-Fort Worth-Arlington, TX | 8,477,157 | TX · Official Census estimate · July 1, 2025 |
| 5 | Houston-Pasadena-The Woodlands, TX | 7,904,627 | TX · Official Census estimate · July 1, 2025 |
| 6 | Atlanta-Sandy Springs-Roswell, GA | 6,482,182 | GA · Official Census estimate · July 1, 2025 |
| 7 | Washington-Arlington-Alexandria, DC-VA-MD-WV | 6,465,724 | DC-VA-MD-WV · Official Census estimate · July 1, 2025 |
| 8 | Miami-Fort Lauderdale-West Palm Beach, FL | 6,391,072 | FL · Official Census estimate · July 1, 2025 |
| 9 | Philadelphia-Camden-Wilmington, PA-NJ-DE-MD | 6,329,118 | PA-NJ-DE-MD · Official Census estimate · July 1, 2025 |
| 10 | Phoenix-Mesa-Chandler, AZ | 5,228,938 | AZ · Official Census estimate · July 1, 2025 |
| 11 | Boston-Cambridge-Newton, MA-NH | 5,034,221 | MA-NH · Official Census estimate · July 1, 2025 |
| 12 | Riverside-San Bernardino-Ontario, CA | 4,769,007 | CA · Official Census estimate · July 1, 2025 |
| 13 | San Francisco-Oakland-Fremont, CA | 4,630,041 | CA · Official Census estimate · July 1, 2025 |
| 14 | Detroit-Warren-Dearborn, MI | 4,390,913 | MI · Official Census estimate · July 1, 2025 |
| 15 | Seattle-Tacoma-Bellevue, WA | 4,161,883 | WA · Official Census estimate · July 1, 2025 |
| 16 | Minneapolis-St. Paul-Bloomington, MN-WI | 3,790,295 | MN-WI · Official Census estimate · July 1, 2025 |
| 17 | Tampa-St. Petersburg-Clearwater, FL | 3,418,895 | FL · Official Census estimate · July 1, 2025 |
| 18 | San Diego-Chula Vista-Carlsbad, CA | 3,282,248 | CA · Official Census estimate · July 1, 2025 |
| 19 | Denver-Aurora-Centennial, CO | 3,092,037 | CO · Official Census estimate · July 1, 2025 |
| 20 | Orlando-Kissimmee-Sanford, FL | 2,957,672 | FL · Official Census estimate · July 1, 2025 |
| 21 | Charlotte-Concord-Gastonia, NC-SC | 2,938,830 | NC-SC · Official Census estimate · July 1, 2025 |
| 22 | Baltimore-Columbia-Towson, MD | 2,857,781 | MD · Official Census estimate · July 1, 2025 |
| 23 | St. Louis, MO-IL | 2,814,421 | MO-IL · Official Census estimate · July 1, 2025 |
| 24 | San Antonio-New Braunfels, TX | 2,813,140 | TX · Official Census estimate · July 1, 2025 |
| 25 | Austin-Round Rock-San Marcos, TX | 2,620,945 | TX · Official Census estimate · July 1, 2025 |
| 26 | Portland-Vancouver-Hillsboro, OR-WA | 2,542,282 | OR-WA · Official Census estimate · July 1, 2025 |
| 27 | Sacramento-Roseville-Folsom, CA | 2,477,274 | CA · Official Census estimate · July 1, 2025 |
| 28 | Pittsburgh, PA | 2,421,992 | PA · Official Census estimate · July 1, 2025 |
| 29 | Las Vegas-Henderson-North Las Vegas, NV | 2,407,226 | NV · Official Census estimate · July 1, 2025 |
| 30 | Cincinnati, OH-KY-IN | 2,312,858 | OH-KY-IN · Official Census estimate · July 1, 2025 |
| 31 | Kansas City, MO-KS | 2,270,682 | MO-KS · Official Census estimate · July 1, 2025 |
| 32 | Columbus, OH | 2,242,028 | OH · Official Census estimate · July 1, 2025 |
| 33 | Indianapolis-Carmel-Greenwood, IN | 2,205,695 | IN · Official Census estimate · July 1, 2025 |
| 34 | Nashville-Davidson--Murfreesboro--Franklin, TN | 2,197,416 | TN · Official Census estimate · July 1, 2025 |
| 35 | Cleveland, OH | 2,165,775 | OH · Official Census estimate · July 1, 2025 |
| 36 | San Jose-Sunnyvale-Santa Clara, CA | 1,984,473 | CA · Official Census estimate · July 1, 2025 |
| 37 | Virginia Beach-Chesapeake-Norfolk, VA-NC | 1,797,213 | VA-NC · Official Census estimate · July 1, 2025 |
| 38 | Jacksonville, FL | 1,785,500 | FL · Official Census estimate · July 1, 2025 |
| 39 | Providence-Warwick, RI-MA | 1,708,161 | RI-MA · Official Census estimate · July 1, 2025 |
| 40 | Raleigh-Cary, NC | 1,595,720 | NC · Official Census estimate · July 1, 2025 |
| 41 | Milwaukee-Waukesha, WI | 1,575,010 | WI · Official Census estimate · July 1, 2025 |
| 42 | Oklahoma City, OK | 1,512,813 | OK · Official Census estimate · July 1, 2025 |
| 43 | Louisville/Jefferson County, KY-IN | 1,402,509 | KY-IN · Official Census estimate · July 1, 2025 |
| 44 | Richmond, VA | 1,389,338 | VA · Official Census estimate · July 1, 2025 |
| 45 | Memphis, TN-MS-AR | 1,341,412 | TN-MS-AR · Official Census estimate · July 1, 2025 |
| 46 | Salt Lake City-Murray, UT | 1,308,377 | UT · Official Census estimate · July 1, 2025 |
| 47 | Fresno, CA | 1,203,383 | CA · Official Census estimate · July 1, 2025 |
| 48 | Birmingham, AL | 1,197,766 | AL · Official Census estimate · July 1, 2025 |
| 49 | Grand Rapids-Wyoming-Kentwood, MI | 1,183,645 | MI · Official Census estimate · July 1, 2025 |
| 50 | Hartford-West Hartford-East Hartford, CT | 1,171,426 | CT · Official Census estimate · July 1, 2025 |
| 51 | Buffalo-Cheektowaga, NY | 1,155,653 | NY · Official Census estimate · July 1, 2025 |
| 52 | Tucson, AZ | 1,074,685 | AZ · Official Census estimate · July 1, 2025 |
| 53 | Tulsa, OK | 1,069,273 | OK · Official Census estimate · July 1, 2025 |
| 54 | Rochester, NY | 1,056,149 | NY · Official Census estimate · July 1, 2025 |
| 55 | Greenville-Anderson-Greer, SC | 1,014,101 | SC · Official Census estimate · July 1, 2025 |
| 56 | Omaha, NE-IA | 1,009,836 | NE-IA · Official Census estimate · July 1, 2025 |
| 57 | Urban Honolulu, HI | 988,703 | HI · Official Census estimate · July 1, 2025 |
| 58 | Bridgeport-Stamford-Danbury, CT | 978,179 | CT · Official Census estimate · July 1, 2025 |
| 59 | New Orleans-Metairie, LA | 970,849 | LA · Official Census estimate · July 1, 2025 |
| 60 | Knoxville, TN | 968,137 | TN · Official Census estimate · July 1, 2025 |
| 61 | North Port-Bradenton-Sarasota, FL | 948,158 | FL · Official Census estimate · July 1, 2025 |
| 62 | Bakersfield-Delano, CA | 927,068 | CA · Official Census estimate · July 1, 2025 |
| 63 | Albuquerque, NM | 925,279 | NM · Official Census estimate · July 1, 2025 |
| 64 | McAllen-Edinburg-Mission, TX | 921,549 | TX · Official Census estimate · July 1, 2025 |
| 65 | Albany-Schenectady-Troy, NY | 915,835 | NY · Official Census estimate · July 1, 2025 |
| 66 | Charleston-North Charleston, SC | 889,263 | SC · Official Census estimate · July 1, 2025 |
| 67 | Baton Rouge, LA | 888,699 | LA · Official Census estimate · July 1, 2025 |
| 68 | Worcester, MA | 888,502 | MA · Official Census estimate · July 1, 2025 |
| 69 | Allentown-Bethlehem-Easton, PA-NJ | 887,615 | PA-NJ · Official Census estimate · July 1, 2025 |
| 70 | El Paso, TX | 881,291 | TX · Official Census estimate · July 1, 2025 |
| 71 | Columbia, SC | 879,918 | SC · Official Census estimate · July 1, 2025 |
| 72 | Cape Coral-Fort Myers, FL | 875,607 | FL · Official Census estimate · July 1, 2025 |
| 73 | Lakeland-Winter Haven, FL | 874,790 | FL · Official Census estimate · July 1, 2025 |
| 74 | Boise City, ID | 864,243 | ID · Official Census estimate · July 1, 2025 |
| 75 | Oxnard-Thousand Oaks-Ventura, CA | 830,851 | CA · Official Census estimate · July 1, 2025 |
| 76 | Dayton-Kettering-Beavercreek, OH | 826,554 | OH · Official Census estimate · July 1, 2025 |
| 77 | Stockton-Lodi, CA | 823,815 | CA · Official Census estimate · July 1, 2025 |
| 78 | Greensboro-High Point, NC | 805,945 | NC · Official Census estimate · July 1, 2025 |
| 79 | Colorado Springs, CO | 781,796 | CO · Official Census estimate · July 1, 2025 |
| 80 | Little Rock-North Little Rock-Conway, AR | 777,607 | AR · Official Census estimate · July 1, 2025 |
| 81 | Provo-Orem-Lehi, UT | 773,426 | UT · Official Census estimate · July 1, 2025 |
| 82 | Des Moines-West Des Moines, IA | 758,539 | IA · Official Census estimate · July 1, 2025 |
| 83 | Deltona-Daytona Beach-Ormond Beach, FL | 746,933 | FL · Official Census estimate · July 1, 2025 |
| 84 | Kiryas Joel-Poughkeepsie-Newburgh, NY | 718,377 | NY · Official Census estimate · July 1, 2025 |
| 85 | Winston-Salem, NC | 712,206 | NC · Official Census estimate · July 1, 2025 |
| 86 | Madison, WI | 709,685 | WI · Official Census estimate · July 1, 2025 |
| 87 | Akron, OH | 701,780 | OH · Official Census estimate · July 1, 2025 |
| 88 | Ogden, UT | 672,784 | UT · Official Census estimate · July 1, 2025 |
| 89 | Palm Bay-Melbourne-Titusville, FL | 663,982 | FL · Official Census estimate · July 1, 2025 |
| 90 | Wichita, KS | 663,809 | KS · Official Census estimate · July 1, 2025 |
| 91 | Syracuse, NY | 652,273 | NY · Official Census estimate · July 1, 2025 |
| 92 | Augusta-Richmond County, GA-SC | 641,231 | GA-SC · Official Census estimate · July 1, 2025 |
| 93 | Durham-Chapel Hill, NC | 625,485 | NC · Official Census estimate · July 1, 2025 |
| 94 | Fayetteville-Springdale-Rogers, AR | 622,177 | AR · Official Census estimate · July 1, 2025 |
| 95 | Harrisburg-Carlisle, PA | 617,427 | PA · Official Census estimate · July 1, 2025 |
| 96 | Jackson, MS | 609,847 | MS · Official Census estimate · July 1, 2025 |
| 97 | Spokane-Spokane Valley, WA | 608,012 | WA · Official Census estimate · July 1, 2025 |
| 98 | Toledo, OH | 599,376 | OH · Official Census estimate · July 1, 2025 |
| 99 | Chattanooga, TN-GA | 594,530 | TN-GA · Official Census estimate · July 1, 2025 |
| 100 | New Haven, CT | 578,741 | CT · Official Census estimate · July 1, 2025 |
Official data: U.S. Census Bureau Vintage 2025 table CBSA-MET-EST2025-POP. Reference date: July 1, 2025. Release date: March 26, 2026. Values are displayed without rounding.
Insights from the Top 100 metro population ranking
Key insight
The ten largest MSAs contain 89,669,830 residents, equal to 39.1% of the 229,612,703 residents represented by the displayed Top 100.
Notable pattern
The Top 20 contain 129,197,042 residents, or 56.3% of the Top 100 total. More than half of the population represented in the table is concentrated in the first 20 positions.
State concentration
California appears in 10 Top 100 MSA titles and Florida in nine. Texas, New York, North Carolina and Ohio each appear in six; multi-state MSAs count toward every code shown.
Outlier
New York-Newark-Jersey City has 7,268,007 more residents than Los Angeles-Long Beach-Anaheim and is 1.57 times as large as the second-ranked MSA.
What this ranking means
The ranking measures the population living within each official county-based metropolitan statistical geography. It is useful for comparing the scale of metro regions and for separating regional population from the much narrower population inside a principal city boundary.
Every value is an official estimate rather than a 2026 forecast. Rankings can change when populations shift or when a later Census vintage revises earlier estimates. All comparisons on this page use Vintage 2025.
Do not compare these values directly with city-proper or combined statistical area lists. New York City, for example, covers a different geography from the New York-Newark-Jersey City MSA, while a CSA can include additional neighboring statistical areas.
FAQ
What is the largest U.S. metro area by population?
New York-Newark-Jersey City ranks first with an official July 1, 2025 resident population estimate of 20,112,448.
Are these 2026 population estimates?
No. This is a 2026 snapshot based on official July 1, 2025 Census estimates released on March 26, 2026. The page does not project metro populations forward to 2026.
Is a metropolitan statistical area the same as a city?
No. An MSA is a county-based federal statistical geography that can include a principal city, suburbs, other municipalities and adjacent counties connected to the core through commuting.
Is an MSA the same as a combined statistical area?
No. A CSA can combine two or more adjacent metropolitan or micropolitan statistical areas. This ranking uses individual MSAs only.
Does the ranking include micropolitan areas?
No. Micropolitan statistical areas are excluded. The source table used here is specifically the Census Bureau metropolitan statistical area population table.
Why can one metro area cross state lines?
MSA boundaries follow counties and commuting integration rather than state borders. The official title therefore lists every state or district included in the metropolitan statistical area.
Does the ranking use GDP, rent or population growth?
No. The only ranking metric is the July 1, 2025 resident population estimate. GDP, rent, density, growth and other measures are not used to calculate rank.
Can Census metro estimates be revised?
Yes. Each new annual vintage can revise the full post-2020 estimate series. Vintage 2025 is the consistent official snapshot used on this page.
Sources
U.S. Census Bureau — Metropolitan and Micropolitan Statistical Area Population Totals
Official landing page identifying Vintage 2025 as the latest completed consistent set and linking the annual MSA resident population table.
CBSA-MET-EST2025-POP official workbook
Primary numeric source for every MSA title and July 1, 2025 resident population value used in the ranking.
Census Bureau Vintage 2025 release
Confirms the March 26, 2026 release date and the 387-MSA universe for the 50 states and District of Columbia.
https://www.census.gov/newsroom/press-releases/2026/2025-popest-metro-micro-counties.html
Census Bureau — Metropolitan and Micropolitan Delineation Files
Explains that OMB delineates MSAs by applying published standards to Census data and that current post-2020 delineations were announced in July 2023.
https://www.census.gov/programs-surveys/metro-micro/about/delineation-files.html
Census Bureau — Metropolitan Statistical Area glossary
Definition source for the county-based MSA concept, the 50,000-person urban-area threshold and commuting-based integration.
https://www.census.gov/programs-surveys/metro-micro/about/glossary.html
Related rankings
More StatRanker rankings on population structure, growth and demographic change.
Fastest-Growing U.S. Counties 2026: Top 100 by 2020–2025 Population Growth
Open rankingTOP 10 Fastest-Growing Populations (2025)
Open rankingTop 10 megacities by population and density
Open rankingGlobal Population in 2025: A Comprehensive Overview
Open ranking
StatRanker (Website)
administrator
