

Largest U.S. Cities by Population: 2026 Snapshot Based on 2025 Census Estimates
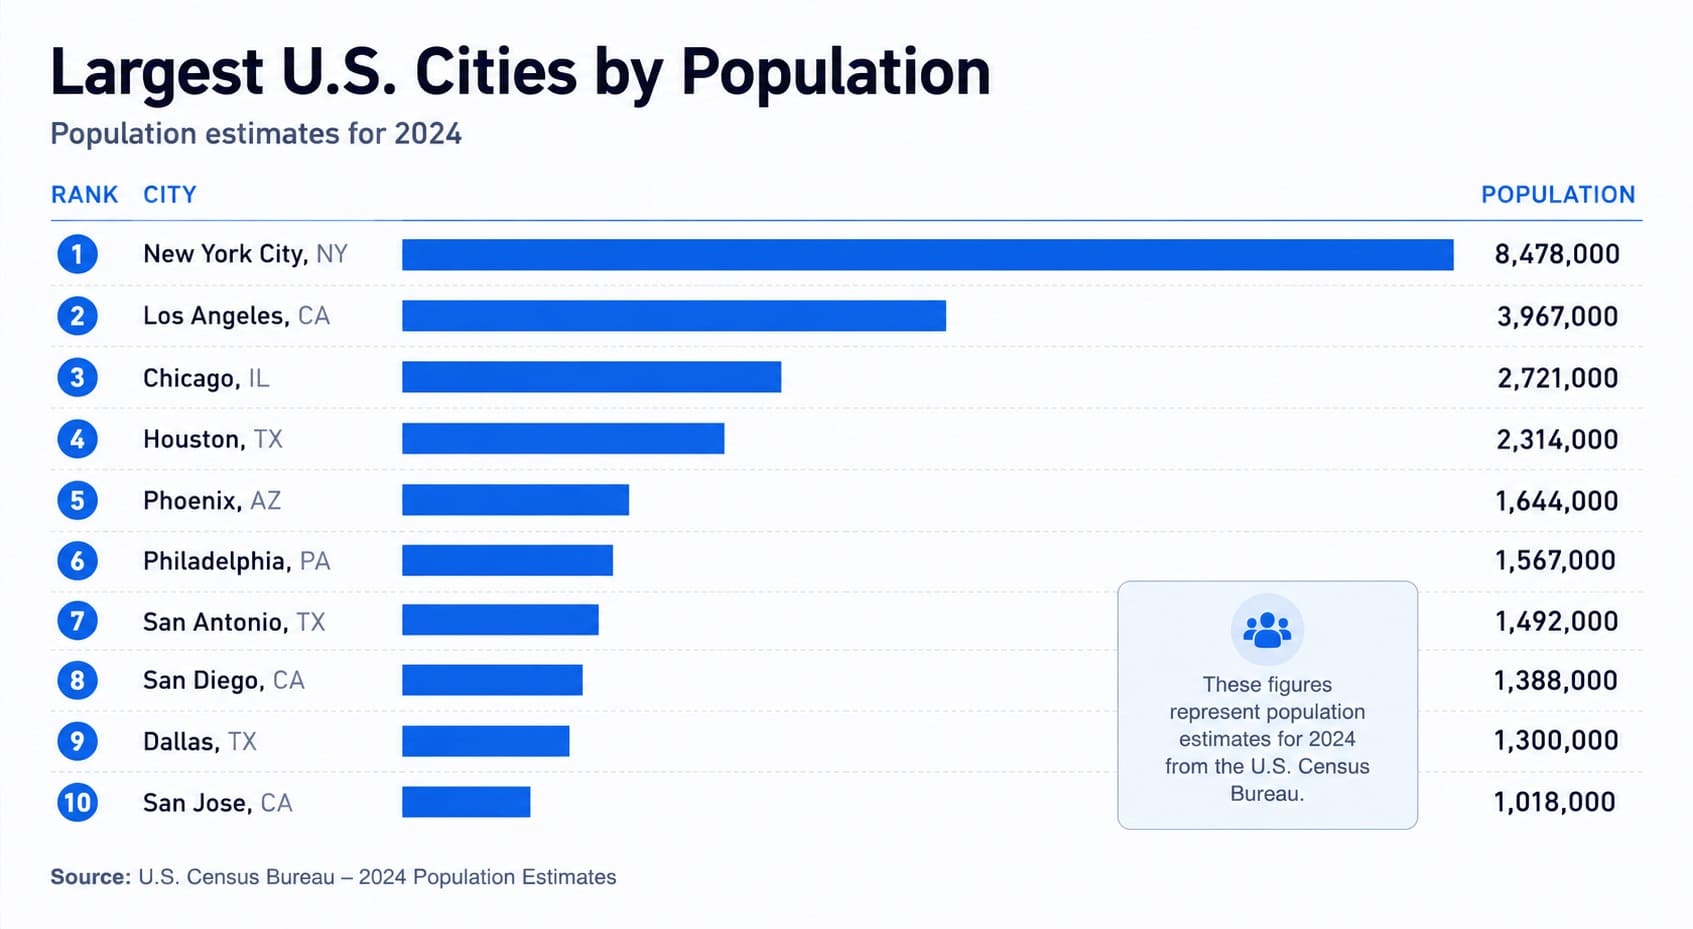
New York leads the 2025 U.S. city population ranking
New York ranks first with 8,584,629 residents, followed by Los Angeles with 3,869,089 and Chicago with 2,731,585. The metric is resident population within the city or government geography listed in the Census source table. Metropolitan population and population growth are measured separately.
This page uses U.S. Census Bureau Vintage 2025 estimates for July 1, 2025, released on May 14, 2026. The population values are reproduced from the official source.
Urban Honolulu CDP is excluded, so the ranks below that row and the summary calculations are produced for this page.
Continue exploring
More StatRanker rankings on health systems, outcomes and medical capacity.
US Cities by Job Growth, 2026
Open rankingCities by Public Transport Monthly Pass Price, 2026
Open rankingU.S. Metro Areas by Monthly Rent, 2026
Open rankingTop 10 largest U.S. cities by population
The first ten contain four Texas cities. New York is more than twice the population of Los Angeles within the boundaries represented by the source table.
Top 10 U.S. cities by resident population, July 1, 2025
| Rank | City | Population | State / geography |
|---|---|---|---|
| 1 | New York | 8,584,629 | New York · Northeast. |
| 2 | Los Angeles | 3,869,089 | California · West. |
| 3 | Chicago | 2,731,585 | Illinois · Midwest. |
| 4 | Houston | 2,397,315 | Texas · South. |
| 5 | Phoenix | 1,665,481 | Arizona · West. |
| 6 | Philadelphia | 1,574,281 | Pennsylvania · Northeast. |
| 7 | San Antonio | 1,548,422 | Texas · South. |
| 8 | San Diego | 1,406,106 | California · West. |
| 9 | Dallas | 1,329,491 | Texas · South. |
| 10 | Fort Worth | 1,028,117 | Texas · South. |
Higher population ranks higher. “Balance” entries are the portions of consolidated governments identified that way in Census geography.
What the ranking includes and excludes
The source is the Census Bureau table SUB-IP-EST2025-ANNRNK. This ranking includes incorporated places, consolidated city or consolidated-government balances, Lexington-Fayette urban county government, Anchorage municipality and the District of Columbia.
Urban Honolulu is removed because the Census Bureau classifies it as a census-designated place, a statistical geography for an unincorporated community. Rows below it move up one position, and Norfolk becomes the 100th city in this version of the ranking.
This is an absolute population ranking, not a metropolitan ranking. Metropolitan statistical areas cover regional labor markets and use different boundaries, so their population totals should not be substituted for the city values shown here.
Boundary note: each value applies only to the Census geography named in that row. Incorporated cities and consolidated governments do not cover uniform amounts of territory.
Population gap across the 20 largest cities
New York is the reference bar. Every other bar is scaled to its 2025 population value, making the distance between the first three cities and the rest of the ranking easy to see.
Methodology, geography and verification
Metric and direction
Metric: resident population. Unit: people. Reference date: July 1, 2025. Entries are ordered from the largest value to the smallest.
Source values
Every population value comes from the Census Bureau Vintage 2025 ranked table and is shown without alteration.
Calculated results
After Urban Honolulu CDP is removed, the remaining rows are re-ranked. The Top 100 total, Top 20 share, regional counts, state counts and chart widths are calculated from the displayed values.
Region assignment
Northeast, Midwest, South and West follow the official Census regions and divisions. The District of Columbia is grouped in the South.
Included geographies: incorporated places, consolidated city or consolidated-government balances, Lexington-Fayette urban county government, Anchorage municipality and the District of Columbia. Official terminology is documented in the Census Bureau’s geography definitions. Census-designated places are excluded; no metropolitan areas, standalone counties or minor civil divisions are added.
Verification: each displayed row was checked against the official ranked table for name, state, population and source order. Urban Honolulu CDP was then removed, the remaining values were sorted from largest to smallest, and the summary totals were recalculated.
Limitations: city and consolidated-government boundaries differ. The rank measures population inside the listed geography, not the size of a continuous urban area. The Census Bureau may revise earlier post-2020 estimates when it releases a new vintage; the current series is documented on the city and town population totals page.
Source values and calculated results: the population cells reproduce Census values. The revised rank, totals, shares, region counts and state counts are calculated for this page after Urban Honolulu CDP is excluded.
Full ranking of the 100 largest U.S. cities
Search and region filters are applied first, then the selected sort order, then the row limit. The Rank column always shows the overall page rank based on population after the CDP exclusion. The table initially shows 20 rows; choose All 100 to expand it.
Showing 20 of 100 matching entries.
Top 100 U.S. cities by resident population, July 1, 2025
| Rank | City | Population | State / geography |
|---|---|---|---|
| 1 | New York | 8,584,629 | New York · Northeast. |
| 2 | Los Angeles | 3,869,089 | California · West. |
| 3 | Chicago | 2,731,585 | Illinois · Midwest. |
| 4 | Houston | 2,397,315 | Texas · South. |
| 5 | Phoenix | 1,665,481 | Arizona · West. |
| 6 | Philadelphia | 1,574,281 | Pennsylvania · Northeast. |
| 7 | San Antonio | 1,548,422 | Texas · South. |
| 8 | San Diego | 1,406,106 | California · West. |
| 9 | Dallas | 1,329,491 | Texas · South. |
| 10 | Fort Worth | 1,028,117 | Texas · South. |
| 11 | Jacksonville | 1,017,689 | Florida · South. |
| 12 | Austin | 1,002,632 | Texas · South. |
| 13 | San Jose | 989,814 | California · West. |
| 14 | Charlotte | 964,784 | North Carolina · South. |
| 15 | Columbus | 938,396 | Ohio · Midwest. |
| 16 | Indianapolis (balance) | 901,116 | Indiana · Midwest · consolidated city balance. |
| 17 | San Francisco | 826,079 | California · West. |
| 18 | Seattle | 784,777 | Washington · West. |
| 19 | Denver | 740,613 | Colorado · West. |
| 20 | Nashville-Davidson (balance) | 721,074 | Tennessee · South · consolidated government balance. |
| 21 | Oklahoma City | 719,849 | Oklahoma · South. |
| 22 | Washington | 693,645 | District of Columbia · South · District of Columbia. |
| 23 | El Paso | 683,012 | Texas · South. |
| 24 | Las Vegas | 679,817 | Nevada · West. |
| 25 | Boston | 672,973 | Massachusetts · Northeast. |
| 26 | Detroit | 649,095 | Michigan · Midwest. |
| 27 | Louisville/Jefferson County (balance) | 641,962 | Kentucky · South · consolidated government balance. |
| 28 | Portland | 635,109 | Oregon · West. |
| 29 | Memphis | 609,647 | Tennessee · South. |
| 30 | Baltimore | 569,997 | Maryland · South. |
| 31 | Milwaukee | 562,407 | Wisconsin · Midwest. |
| 32 | Albuquerque | 556,588 | New Mexico · West. |
| 33 | Fresno | 555,549 | California · West. |
| 34 | Tucson | 548,371 | Arizona · West. |
| 35 | Sacramento | 536,449 | California · West. |
| 36 | Atlanta | 529,110 | Georgia · South. |
| 37 | Kansas City | 521,220 | Missouri · Midwest. |
| 38 | Mesa | 513,656 | Arizona · West. |
| 39 | Raleigh | 506,306 | North Carolina · South. |
| 40 | Colorado Springs | 494,743 | Colorado · West. |
| 41 | Miami | 489,812 | Florida · South. |
| 42 | Omaha | 488,797 | Nebraska · Midwest. |
| 43 | Virginia Beach | 453,737 | Virginia · South. |
| 44 | Long Beach | 450,469 | California · West. |
| 45 | Oakland | 440,838 | California · West. |
| 46 | Minneapolis | 430,324 | Minnesota · Midwest. |
| 47 | Bakersfield | 422,165 | California · West. |
| 48 | Tulsa | 416,209 | Oklahoma · South. |
| 49 | Tampa | 413,554 | Florida · South. |
| 50 | Aurora | 410,053 | Colorado · West. |
| 51 | Arlington | 402,134 | Texas · South. |
| 52 | Wichita | 400,987 | Kansas · Midwest. |
| 53 | Cleveland | 363,608 | Ohio · Midwest. |
| 54 | New Orleans | 362,154 | Louisiana · South. |
| 55 | Henderson | 353,289 | Nevada · West. |
| 56 | Anaheim | 341,008 | California · West. |
| 57 | Orlando | 333,888 | Florida · South. |
| 58 | Lexington-Fayette | 329,751 | Kentucky · South · urban county government. |
| 59 | Stockton | 324,597 | California · West. |
| 60 | Newark | 323,808 | New Jersey · Northeast. |
| 61 | Riverside | 323,057 | California · West. |
| 62 | Irvine | 318,764 | California · West. |
| 63 | Corpus Christi | 317,247 | Texas · South. |
| 64 | Santa Ana | 315,586 | California · West. |
| 65 | Cincinnati | 314,367 | Ohio · Midwest. |
| 66 | Greensboro | 308,667 | North Carolina · South. |
| 67 | Pittsburgh | 307,632 | Pennsylvania · Northeast. |
| 68 | St. Paul | 306,684 | Minnesota · Midwest. |
| 69 | Durham | 305,561 | North Carolina · South. |
| 70 | Jersey City | 302,013 | New Jersey · Northeast. |
| 71 | Lincoln | 301,522 | Nebraska · Midwest. |
| 72 | North Las Vegas | 296,653 | Nevada · West. |
| 73 | Plano | 293,028 | Texas · South. |
| 74 | Gilbert | 287,285 | Arizona · West. |
| 75 | Anchorage | 287,155 | Alaska · West · unified municipality. |
| 76 | Madison | 286,233 | Wisconsin · Midwest. |
| 77 | Reno | 283,621 | Nevada · West. |
| 78 | Chandler | 278,748 | Arizona · West. |
| 79 | St. Louis | 278,144 | Missouri · Midwest. |
| 80 | Chula Vista | 275,533 | California · West. |
| 81 | Fort Wayne | 275,203 | Indiana · Midwest. |
| 82 | Buffalo | 274,613 | New York · Northeast. |
| 83 | Lubbock | 273,071 | Texas · South. |
| 84 | Laredo | 269,515 | Texas · South. |
| 85 | Port St. Lucie | 268,062 | Florida · South. |
| 86 | St. Petersburg | 264,033 | Florida · South. |
| 87 | Toledo | 263,423 | Ohio · Midwest. |
| 88 | Glendale | 260,572 | Arizona · West. |
| 89 | Winston-Salem | 257,271 | North Carolina · South. |
| 90 | Irving | 257,076 | Texas · South. |
| 91 | Chesapeake | 255,332 | Virginia · South. |
| 92 | Garland | 249,625 | Texas · South. |
| 93 | Scottsdale | 243,006 | Arizona · West. |
| 94 | Boise City | 238,429 | Idaho · West. |
| 95 | Richmond | 237,257 | Virginia · South. |
| 96 | Frisco | 236,955 | Texas · South. |
| 97 | Cape Coral | 236,264 | Florida · South. |
| 98 | McKinney | 236,001 | Texas · South. |
| 99 | Huntsville | 233,627 | Alabama · South. |
| 100 | Norfolk | 231,013 | Virginia · South. |
Population reference date: July 1, 2025. Census release: May 14, 2026. Page updated: July 18, 2026.
What the Top 100 reveals
Large lead at the top
New York exceeds the combined populations of Los Angeles and Chicago by 1,983,955 residents. Its value is 2.22 times Los Angeles.
Regional concentration
The South contributes 42 entries and the West 34. Together they account for 76 of the 100 cities; the Midwest has 17 and the Northeast 7.
State concentration
California and Texas each place 15 cities in the Top 100. Their combined 30 cities represent 30% of the ranking.
Long upper tail
The 20 largest cities contain 53.1% of the Top 100 population, while New York alone represents 13.0% of the total.
How to use the ranking without mixing geographies
Use this page as a population baseline for statistics that use the same city or government boundary. This city ranking should not be treated as a metropolitan population ranking.
A higher population rank does not indicate faster growth. The companion growth page uses Census-reported one-year percentage change for a different candidate set based on its own population threshold; it is not a re-ranking of these same 100 rows.
Fastest-growing U.S. cities
Compare Census-reported one-year percentage growth for the page’s separate candidate set.
U.S. states by population
Compare official Vintage 2025 resident population across all 50 states and the District of Columbia.
Major U.S. cities by reported violent crime rate
Use a rate-based city comparison with its own coverage and reporting limits.
Largest U.S. metropolitan economies
Compare metro-area GDP without treating city boundaries as labor-market boundaries.
FAQ
Why is Urban Honolulu excluded?
The Census Bureau classifies Urban Honolulu as a census-designated place rather than an incorporated municipality. Removing that row changes the page ranks below it but does not alter any population value.
What does “balance” mean in several city names?
A balance is the portion of a consolidated city or government that remains after separately recognized incorporated places or other components are excluded under Census geography.
Why is Washington, D.C. assigned to the South?
The regional filter follows the Census Bureau’s official four-region classification, which places the District of Columbia in the South Atlantic division of the South region.
Can a later Census vintage change these ranks?
Yes. A new vintage can revise earlier post-2020 estimates as the Census Bureau updates source data and geographic inputs. Closely spaced cities are the most likely to exchange positions.
Can these values be used to calculate city rates?
Only when the numerator uses the same city or government geography and a compatible reference period. A metropolitan, county or service-area numerator should not be divided by these city population values.
Sources
City and Town Population Totals: 2020–2025
Official Census landing page for Vintage 2025 city and town files and the notice that later vintages supersede earlier estimates.
https://www.census.gov/data/tables/time-series/demo/popest/2020s-total-cities-and-towns.html
SUB-IP-EST2025-ANNRNK ranked table
Primary source for the place names, source order and every 2025 resident population value.
Population Estimates geography terms
Official definitions for incorporated places, consolidated cities, balances, counties and metropolitan geographies.
https://www.census.gov/programs-surveys/popest/guidance-geographies/terms-and-definitions.html
Census Designated Places
Official definition supporting the exclusion of Urban Honolulu as a statistical, unincorporated geography.
https://www.census.gov/programs-surveys/bas/information/cdp.html
Census Regions and Divisions
Official state assignments used for the Northeast, Midwest, South and West row filters and regional counts.
https://www2.census.gov/geo/pdfs/maps-data/maps/reference/us_regdiv.pdf
Vintage 2025 city and town release
Official May 14, 2026 release context for the Vintage 2025 estimates.
https://www.census.gov/newsroom/press-releases/2026/vintage-2025-city-town-pop-estimates.html
Related rankings
More StatRanker rankings on health systems, outcomes and medical capacity.
US Cities by Air Quality, 2026
Open rankingCalifornia Cities by Air Quality, 2026
Open rankingMajor U.S. Cities by Average Commute Time, 2026 Snapshot
Open rankingUS Cities by Traffic Congestion, 2026
Open ranking
StatRanker (Website)
administrator
