

U.S. Trade Deficit by Country: January–August 2026 Ranking
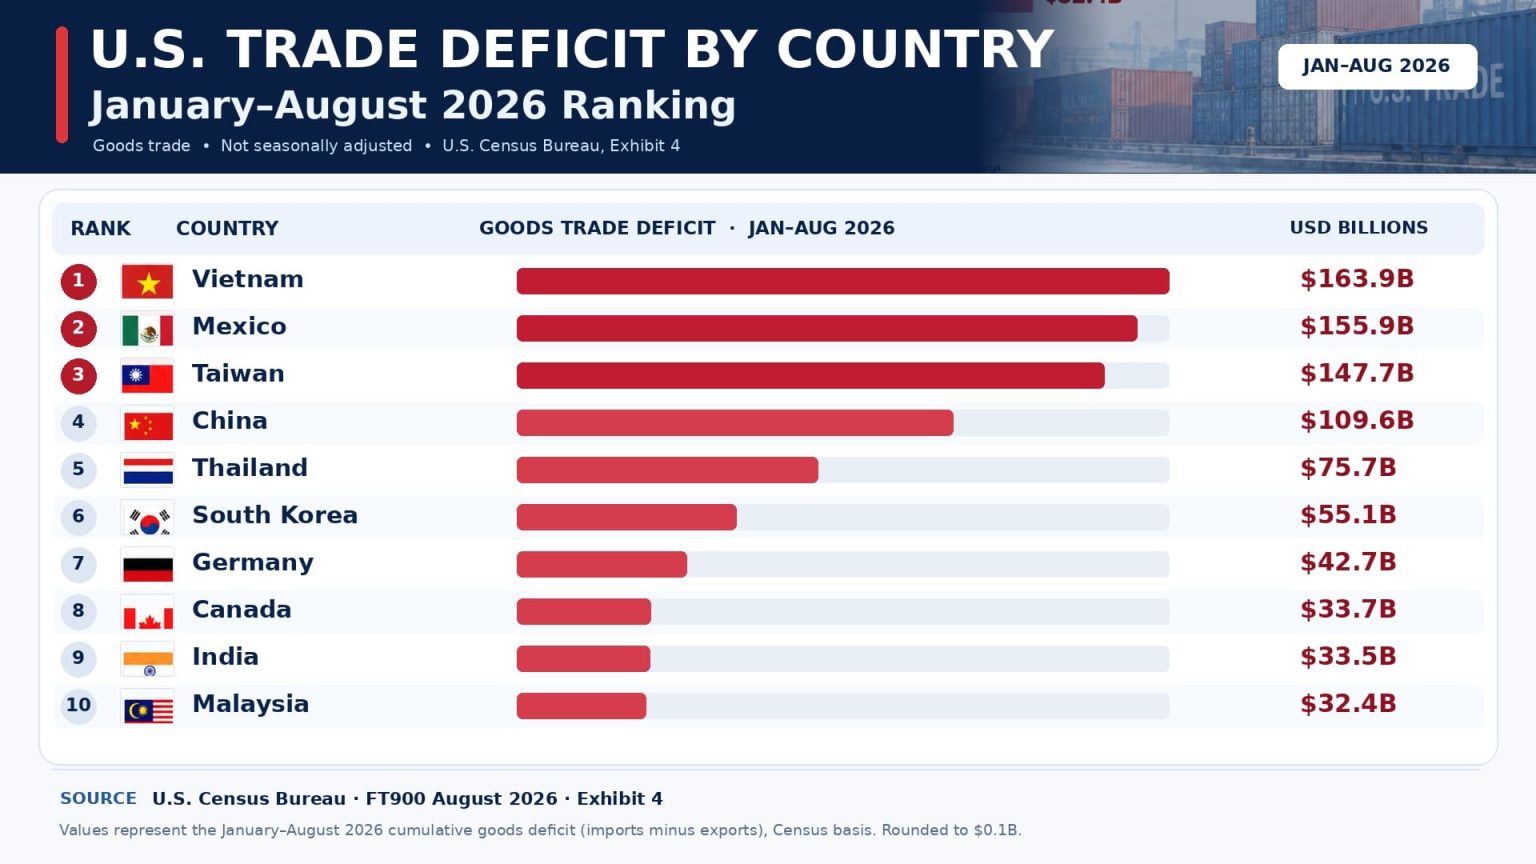
U.S. Trade Deficit by Country: Top 15 Partners in January–August 2026
Vietnam had the largest U.S. bilateral goods trade deficit in January–August 2026, at $163.9 billion. Mexico followed with $155.9 billion, Taiwan ranked third at $147.7 billion, and China was fourth at $109.6 billion.
This ranking covers the 15 largest negative U.S. merchandise trade balances with individual trading partners. The source is the U.S. Census Bureau's official Year-to-Date Deficits ranking, supplemented by country-specific trade-balance tables containing the more precise values used throughout this analysis.
The ranking uses nominal, not seasonally adjusted goods-trade data. Larger deficit magnitudes rank higher. It does not include trade in services, seasonally adjusted country balances or projected values.
Period: January 1–August 31, 2026
Source type: U.S. Census Bureau, official government data
Coverage: 15 confirmed trading partners, matching the official Year-to-Date Top 15
Unit: Current US$ billions, converted from published US$ millions
Direction: Descending deficit magnitude
Ranking status: 15 official_value; 0 modeled values or forecasts
Separate research: calculated_value statistics derived from published data
Official release date: October 6, 2026
Data retrieval: October 25, 2026
Overview: How the U.S. Goods Deficit Was Distributed
The official ranking places Vietnam, Mexico and Taiwan ahead of China for the first eight months of 2026. Together, these three partners recorded $467.4407 billion in negative bilateral goods balances. The next-largest deficit was China's $109.6208 billion, $38.0444 billion below Taiwan.
The 15 listed partners collectively accounted for $953.6512 billion in deficit magnitudes. That figure adds only negative balances for the selected partners; it is not the United States' net goods trade deficit with the world.
National balance versus selected deficits: The U.S. net goods deficit with the world was $773.9327 billion for January–August 2026. The Top 15 deficit magnitudes sum to more because the national balance also offsets negative balances against positive trade balances with other partners.
The most important change becomes visible when the same four leading 2026 partners are compared with January–August 2025. Taiwan's deficit magnitude rose by 76.0%, Vietnam's by 45.0% and Mexico's by 21.2%. China's decreased by 24.9%.
Those figures describe changes in the recorded merchandise balance. They do not establish whether shifts were caused by tariffs, shipment timing, supply-chain relocation, exchange rates or changing product demand.
Top 10 U.S. Trade Deficits by Country in January–August 2026
The leading three deficit partners were separated by relatively small amounts: Vietnam exceeded Mexico by $8.0329 billion, while Mexico exceeded Taiwan by $8.2061 billion. A much larger gap separated Taiwan from fourth-ranked China.
| Rank | Country | Deficit | Region / Note |
|---|---|---|---|
| 1 | Vietnam | $163.9B | Asia · official_value · Census Jan–Aug 2026 |
| 2 | Mexico | $155.9B | North America · official_value · Census Jan–Aug 2026 |
| 3 | Taiwan | $147.7B | Asia · official_value · Census Jan–Aug 2026 |
| 4 | China | $109.6B | Asia · official_value · Census Jan–Aug 2026 |
| 5 | Thailand | $75.7B | Asia · official_value · Census Jan–Aug 2026 |
| 6 | South Korea | $55.1B | Asia · official_value · Census Jan–Aug 2026 |
| 7 | Germany | $42.7B | Europe · official_value · Census Jan–Aug 2026 |
| 8 | Canada | $33.7B | North America · official_value · Census Jan–Aug 2026 |
| 9 | India | $33.5B | Asia · official_value · Census Jan–Aug 2026 |
| 10 | Malaysia | $32.4B | Asia · official_value · Census Jan–Aug 2026 |
Displayed deficit magnitudes are positive for comparison. The Census Bureau publishes these bilateral trade balances as negative amounts. The rank is based on the more precise published figures, before rounding.
Chart: The 15 Largest Bilateral Goods Deficits
Bars represent official January–August 2026 deficit magnitudes. Vietnam is the 100% visual reference, and every other bar is scaled against Vietnam's $163.9042 billion. Bar lengths do not represent shares of the national deficit.
Chart finding: The three leading deficits together total $467.4407 billion, compared with $109.6208 billion for China in fourth place. At the lower end of the chart, Indonesia and France appear equal after rounding, although their underlying balances differ by $0.9 million.
Methodology and Historical Comparison
The ranking reproduces the country coverage and ordering in the Census Bureau's August 2026 Year-to-Date Deficits table. Precise values are taken from the corresponding country trade-balance series. The page's concentration, regional and historical comparisons are calculated separately from those source-published observations.
Metric and direction
Goods imports minus goods exports for trading partners with negative U.S. bilateral balances. Larger deficit magnitude ranks higher.
Year and coverage
January–August 2026 only. Exactly 15 entries, matching the officially published Year-to-Date Top 15. No unconfirmed or older-year rows.
Units and adjustments
Nominal current U.S. dollars. Original Census units are US$ millions. Data are on a Census basis and are not seasonally adjusted.
Source status
Every main-ranking row is official_value. Regional totals, concentration, medians and historical changes are calculated_value, not official forecasts.
Inclusion and exclusion
Included: the official 15 largest negative bilateral goods balances. Excluded: smaller deficits, trade surpluses, services, forecasts and regional aggregates.
Validation and conflicts
The official Year-to-Date ranking establishes the Top 15. Individual Census country pages validate precise values. No secondary values are substituted or averaged.
Ranking Formula
For a negative balance:
Deficit magnitude (US$B) = −published balance (US$M) ÷ 1,000
Example: Vietnam = −(−163,904.2) ÷ 1,000 = $163.9042B
Rank = descending order of the underlying deficit magnitudes
Display labels are normally rounded to one decimal place in billions. Raw values are retained for ranking, calculations and chart scaling. Country observations remain official_value because their underlying balances were directly published; the change of sign and unit is disclosed.
January–August 2025 Versus 2026: Same-Partner Comparison
The following comparison uses the four largest deficit partners in 2026 and Ireland. The 2025 values are calculated by summing eight published monthly balances for January through August of that year. The 2026 values come directly from the Census Bureau's cumulative year-to-date country totals.
| Partner | 2025 Jan–Aug | 2026 Jan–Aug | Change, US$B | Change, % |
|---|---|---|---|---|
| Vietnam | $113.0543B | $163.9042B | +$50.8499B | +45.0% |
| Mexico | $128.5766B | $155.8713B | +$27.2947B | +21.2% |
| Taiwan | $83.9083B | $147.6652B | +$63.7569B | +76.0% |
| China | $145.9303B | $109.6208B | −$36.3095B | −24.9% |
| Ireland | $87.8923B | $24.0703B | −$63.8220B | −72.6% |
2025 columns: calculated_value from observed monthly Census balances. 2026 columns: official_value. Changes: calculated_value. Figures are not adjusted for inflation or seasonality.
What Changed Among the Four Largest 2026 Partners?
For the same four partners, the combined deficit magnitude increased from $471.4695 billion in January–August 2025 to $577.0615 billion in January–August 2026, a rise of $105.5920 billion, or 22.4%.
China had the largest deficit among these four partners in the 2025 comparison period, at $145.9303 billion. Vietnam led the same four in 2026. Taiwan recorded the largest absolute increase, $63.7569 billion, while China was the only one of the four with a declining deficit magnitude.
2026 subtotal = 163.9042 + 155.8713 + 147.6652 + 109.6208 = $577.0615B
Absolute increase = 577.0615 − 471.4695 = $105.5920B
Relative increase = (577.0615 ÷ 471.4695 − 1) × 100 = 22.4%
Historical Calculation Inputs
Each sequence below lists the eight January–August 2025 monthly deficit magnitudes, in US$ millions. These are observed Census inputs, not estimates. The figures are added and divided by 1,000 to obtain billions.
Vietnam: 2025 monthly inputs
January 12,044.6; February 10,908.4; March 13,558.9; April 13,574.1; May 14,718.7; June 16,567.8; July 16,644.6; August 15,037.2.
Sum = $113,054.3 million = $113.0543 billion. Source: U.S. Census Bureau, Vietnam goods-balance series, 2025. Status: calculated_value.
Mexico: 2025 monthly inputs
January 13,596.2; February 14,817.5; March 18,621.4; April 14,085.5; May 17,973.1; June 17,113.7; July 16,370.8; August 15,998.4.
Sum = $128,576.6 million = $128.5766 billion. Source: U.S. Census Bureau, Mexico goods-balance series, 2025. Status: calculated_value.
Taiwan: 2025 monthly inputs
January 7,715.4; February 6,885.2; March 7,772.1; April 9,597.0; May 11,630.5; June 12,620.7; July 14,566.6; August 13,120.8.
Sum = $83,908.3 million = $83.9083 billion. Source: U.S. Census Bureau, Taiwan goods-balance series, 2025. Status: calculated_value.
China: 2025 monthly inputs
January 31,895.2; February 21,224.9; March 18,001.3; April 17,241.8; May 13,946.7; June 9,432.3; July 17,084.5; August 17,103.6.
Sum = $145,930.3 million = $145.9303 billion. Source: U.S. Census Bureau, China goods-balance series, 2025. Status: calculated_value.
Ireland: 2025 monthly inputs
January 12,353.4; February 13,965.9; March 29,650.5; April 9,424.5; May 11,820.0; June 5,282.9; July 2,557.3; August 2,837.8.
Sum = $87,892.3 million = $87.8923 billion. Source: U.S. Census Bureau, Ireland goods-balance series, 2025. Status: calculated_value.
Concentration and Regional Calculations
Top 3 = 163.9042 + 155.8713 + 147.6652 = $467.4407B
Top 3 concentration = 467.4407 ÷ 953.6512 × 100 = 49.0%
Median = 8th ranked value = $33.6730B
Asia = 9 partners, $661.4918B, or 69.4%
North America = 2 partners, $189.5443B, or 19.9%
Europe = 4 partners, $102.6151B, or 10.8%
The geographic groupings are descriptive classifications for the selected partners, not full Census regional totals. All percentages use the combined magnitude of the 15 listed negative balances as denominator. Regional percentages may add to 100.1% after rounding.
Source Hierarchy, Limitations and Revisions
- Numeric authority: U.S. Census Bureau's Year-to-Date Top 15 and country trade-balance series.
- Validation: Same-publisher Census balance tables and FT900 archived release materials. These are consistency checks, not additional independent numeric publishers.
- Context: BEA and Census explanatory material clarifies Census basis, balance-of-payments adjustments and seasonal adjustment.
- Historical years: The main ranking is 2026 only. The separately labeled historical comparison uses observed January–August 2025 monthly figures.
- Missing values: No missing or stale observations are substituted into the ranking.
- Conflict handling: Source-published Census balances take priority. Differently defined BEA goods-and-services balances are not mixed with goods-only figures.
- Revisions: Country trade data can be revised in subsequent releases. This ranking is tied to the October 25, 2026 retrieval.
- Excluded measures: Services, tariff revenue, real goods volume, domestic value added, GDP-adjusted balances, supply-chain origin and full-year forecasts.
The official year-to-date highlights page is a live resource and may display a later reporting period after new releases. For the August 2026 snapshot, the historical FT900 release index and country tables provide the relevant reporting records.
Main Ranking: Top 15 U.S. Bilateral Goods Trade Deficits
These 15 entries reproduce the official Year-to-Date Deficits ranking for August 2026. Use the controls to search, filter or reorder the existing entries. All values represent deficit magnitudes in current U.S. dollars.
| Rank | Partner | Deficit | Source / Method Note |
|---|---|---|---|
| 1 | Vietnam | $163.9B | Asia · official_value · Census Jan–Aug 2026 · Published balance −$163,904.2M; magnitude displayed |
| 2 | Mexico | $155.9B | North America · official_value · Census Jan–Aug 2026 · Published balance −$155,871.3M |
| 3 | Taiwan | $147.7B | Asia · official_value · Census Jan–Aug 2026 · Published balance −$147,665.2M |
| 4 | China | $109.6B | Asia · official_value · Census Jan–Aug 2026 · Published balance −$109,620.8M |
| 5 | Thailand | $75.7B | Asia · official_value · Census Jan–Aug 2026 · Published balance −$75,661.6M |
| 6 | South Korea | $55.1B | Asia · official_value · Census "Korea, South" · Jan–Aug 2026 · Balance −$55,055.9M |
| 7 | Germany | $42.7B | Europe · official_value · Census Jan–Aug 2026 · Published balance −$42,701.3M |
| 8 | Canada | $33.7B | North America · official_value · Census Jan–Aug 2026 · Published balance −$33,673.0M |
| 9 | India | $33.5B | Asia · official_value · Census Jan–Aug 2026 · Published balance −$33,480.1M |
| 10 | Malaysia | $32.4B | Asia · official_value · Census Jan–Aug 2026 · Published balance −$32,407.1M |
| 11 | Japan | $29.8B | Asia · official_value · Census Jan–Aug 2026 · Published balance −$29,815.0M |
| 12 | Ireland | $24.1B | Europe · official_value · Census Jan–Aug 2026 · Published balance −$24,070.3M |
| 13 | Italy | $22.0B | Europe · official_value · Census Jan–Aug 2026 · Published balance −$21,962.5M |
| 14 | Indonesia | $13.9B | Asia · official_value · Census Jan–Aug 2026 · Balance −$13,881.9M; $0.9M above France |
| 15 | France | $13.9B | Europe · official_value · Census Jan–Aug 2026 · Balance −$13,881.0M; smallest in Top 15 |
No matching country in this Top 15. Clear the search or change the filters.
Numeric publisher for every ranking row: U.S. Census Bureau, country-specific balance series, 2026 TOTAL through August. Exact country source addresses appear in the Sources section.
Key Findings from the Trade Deficit Data
Key Insight: Top Three Account for 49.0%
Vietnam ($163.9042B), Mexico ($155.8713B) and Taiwan ($147.6652B) accounted for $467.4407 billion, or 49.0% of the combined deficit magnitudes of the 15 listed partners. This is a Top 15 concentration measure, not a share of the national net deficit.
Notable Pattern: The Leading Four Changed Unevenly
For Vietnam, Mexico, Taiwan and China combined, the January–August deficit magnitude rose 22.4% from 2025 to 2026. Taiwan had the largest absolute increase, $63.7569B, while China recorded a $36.3095B decrease. The four partners were compared over identical eight-month periods.
Regional Concentration: Asia Accounts for 69.4%
Nine Asian partners in the Top 15 had $661.4918B in combined deficit magnitudes, equal to 69.4% of the listed total. Mexico and Canada accounted for 19.9%, and the four European partners for 10.8%. The figures are restricted to the selected 15 partners.
Outlier: Indonesia and France Are Almost Tied
Indonesia ranked 14th with $13,881.9M and France 15th with $13,881.0M. The difference is $0.9 million, or approximately 0.0065% of France's deficit magnitude. Both display as $13.9B after rounding, but their official raw balances determine the order.
What the Trade Deficit Ranking Means
The country positions identify where the United States recorded the largest negative bilateral merchandise balances during the first eight months of 2026. They are useful for identifying major trade relationships to examine further, but they are not measures of economic loss or partner-country benefit.
The 2025–2026 comparison shows why a single ranking can be misleading when interpreted without a time dimension. Even among the four leading 2026 partners, the recorded deficit moved in different directions. A reader investigating a particular change should examine bilateral imports, exports and product categories rather than inferring causes from the trade balance alone.
The selected-country total also requires care. Adding only negative bilateral balances describes the concentration of deficits among selected partners, while the U.S. worldwide balance nets both deficits and surpluses. Using the worldwide net figure as the denominator for the Top 15 concentration calculation would answer a different question.
Practical interpretation: Read the ranking as an eight-month goods-only comparison. Treat the historical changes as observed arithmetic differences, and use additional commodity-level or economic evidence before attributing those changes to policy or business decisions.
Frequently Asked Questions
Which country had the largest U.S. goods trade deficit in January–August 2026?
Vietnam ranked first at $163.9042 billion, followed by Mexico at $155.8713 billion and Taiwan at $147.6652 billion. These are Census-basis merchandise trade deficit magnitudes for the eight-month period.
Is the ranking for August alone or January through August?
It covers the cumulative January–August 2026 period. The Census Bureau publishes separate monthly and Year-to-Date Deficits rankings. This page uses the year-to-date measure, not August alone.
Does the ranking include trade in services?
No. It includes goods only. A goods-and-services trade balance can differ because it also includes categories such as travel, transport, financial and business services.
Why is China fourth rather than first?
For January–August 2026, China's published bilateral goods deficit with the United States was $109.6208 billion, below Vietnam, Mexico and Taiwan. The ranking reflects this particular period and measure, rather than historical trade rankings.
How did the four largest 2026 deficit partners compare with 2025?
Compared with January–August 2025, Vietnam's deficit magnitude increased 45.0%, Mexico's 21.2% and Taiwan's 76.0%, while China's decreased 24.9%. The 2025 figures were calculated by summing the eight published monthly Census balances.
Why does the sum of the Top 15 deficits exceed the national goods deficit?
The $953.6512 billion Top 15 total adds negative balances only. The U.S. worldwide goods balance, −$773.9327 billion, nets deficits against trade surpluses across all partners. The two measures are not interchangeable.
Are the 2026 values official or calculated?
All 15 main-ranking values are official published Census country balances, displayed as positive deficit magnitudes. The historical comparisons, median, concentration measures and regional subtotals are calculated_value statistics derived from observed inputs.
Why do Indonesia and France show the same rounded deficit?
Indonesia recorded $13,881.9 million and France $13,881.0 million in deficit magnitudes. The $0.9 million difference disappears when the values are rounded to $13.9 billion. The raw values determine ranks 14 and 15.
Are these values seasonally adjusted or inflation-adjusted?
No. The figures are nominal, current-dollar, not seasonally adjusted Census-basis goods balances. Changes can reflect both prices and quantities, so the ranking does not isolate real trade-volume changes.
Do the calculations forecast the rest of 2026?
No. Every calculation uses already observed figures from January–August 2025 or 2026. No forecast, growth assumption or projected September–December 2026 balance is included.
Sources and Data Provenance
The ranking uses one independent numeric publishing organization: the U.S. Census Bureau. The official Year-to-Date Deficits table establishes the Top 15 coverage and order. Individual country series supply precise balances and the observed historical comparison inputs. Multiple Census URLs do not constitute independent numeric sources.
U.S. Census Bureau — Year-to-Date Top Trading Partners
numeric_source · validation_sourceThe official Year-to-Date Deficits table establishes the Top 15 partner set and ranking order. The August 2026 snapshot lists Vietnam, Mexico, Taiwan and China in the first four positions.
https://www.census.gov/foreign-trade/statistics/highlights/topyr.html
This is a live page. Its reporting month may change after later Census releases.
U.S. Census Bureau — FT900 Historical Releases
validation_source · methodology_sourceOfficial archive of U.S. international trade releases. The August 2026 release is dated October 6, 2026. The archive preserves monthly release materials used for reporting-period verification.
https://www.census.gov/foreign-trade/Press-Release/ft900_index.html
U.S. Census Bureau — Country-Level Trade Balances
numeric_source · methodology_sourceOfficial index of country-specific goods export, import and balance series. Values are published in nominal US$ millions, not seasonally adjusted. The 2026 country totals through August provide precise values for the ranking.
https://www.census.gov/foreign-trade/statistics/country/index.html
Country Source Records — Ranks 1–5
numeric_source · Census BureauPrimary country-level numeric records for the five largest deficit magnitudes. The first four records also provide the January–August 2025 monthly inputs for historical comparisons.
- Vietnamhttps://www.census.gov/foreign-trade/balance/c5520.html
- Mexicohttps://www.census.gov/foreign-trade/balance/c2010.html
- Taiwanhttps://www.census.gov/foreign-trade/balance/c5830.html
- Chinahttps://www.census.gov/foreign-trade/balance/c5700.html
- Thailandhttps://www.census.gov/foreign-trade/balance/c5490.html
Country Source Records — Ranks 6–10
numeric_source · Census BureauOfficial January–August 2026 balances for South Korea, Germany, Canada, India and Malaysia.
- South Koreahttps://www.census.gov/foreign-trade/balance/c5800.html
- Germanyhttps://www.census.gov/foreign-trade/balance/c4280.html
- Canadahttps://www.census.gov/foreign-trade/balance/c1220.html
- Indiahttps://www.census.gov/foreign-trade/balance/c5330.html
- Malaysiahttps://www.census.gov/foreign-trade/balance/c5570.html
Country Source Records — Ranks 11–15
numeric_source · Census BureauOfficial country balances for Japan, Ireland, Italy, Indonesia and France. Ireland's 2025 monthly figures also supply the observed inputs for its historical comparison.
- Japanhttps://www.census.gov/foreign-trade/balance/c5880.html
- Irelandhttps://www.census.gov/foreign-trade/balance/c4190.html
- Italyhttps://www.census.gov/foreign-trade/balance/c4759.html
- Indonesiahttps://www.census.gov/foreign-trade/balance/c5600.html
- Francehttps://www.census.gov/foreign-trade/balance/c4279.html
U.S. Census Bureau — Worldwide Goods Balance
numeric_source · validation_sourceOfficial worldwide Census-basis goods balance for January–August 2026. Supports the net deficit of $773.9327 billion used to distinguish the worldwide balance from the sum of selected negative bilateral balances.
U.S. Bureau of Economic Analysis — August 2026 Trade Release
context_sourceOfficial explanatory material on goods-and-services trade, Census-basis goods statistics, balance-of-payments adjustments and seasonally adjusted reporting. This source does not replace the bilateral numeric values used in the ranking.
https://www.bea.gov/news/2026/us-international-trade-goods-and-services-august-2026
