

Women in National Parliaments by Country: August 2026 Ranking
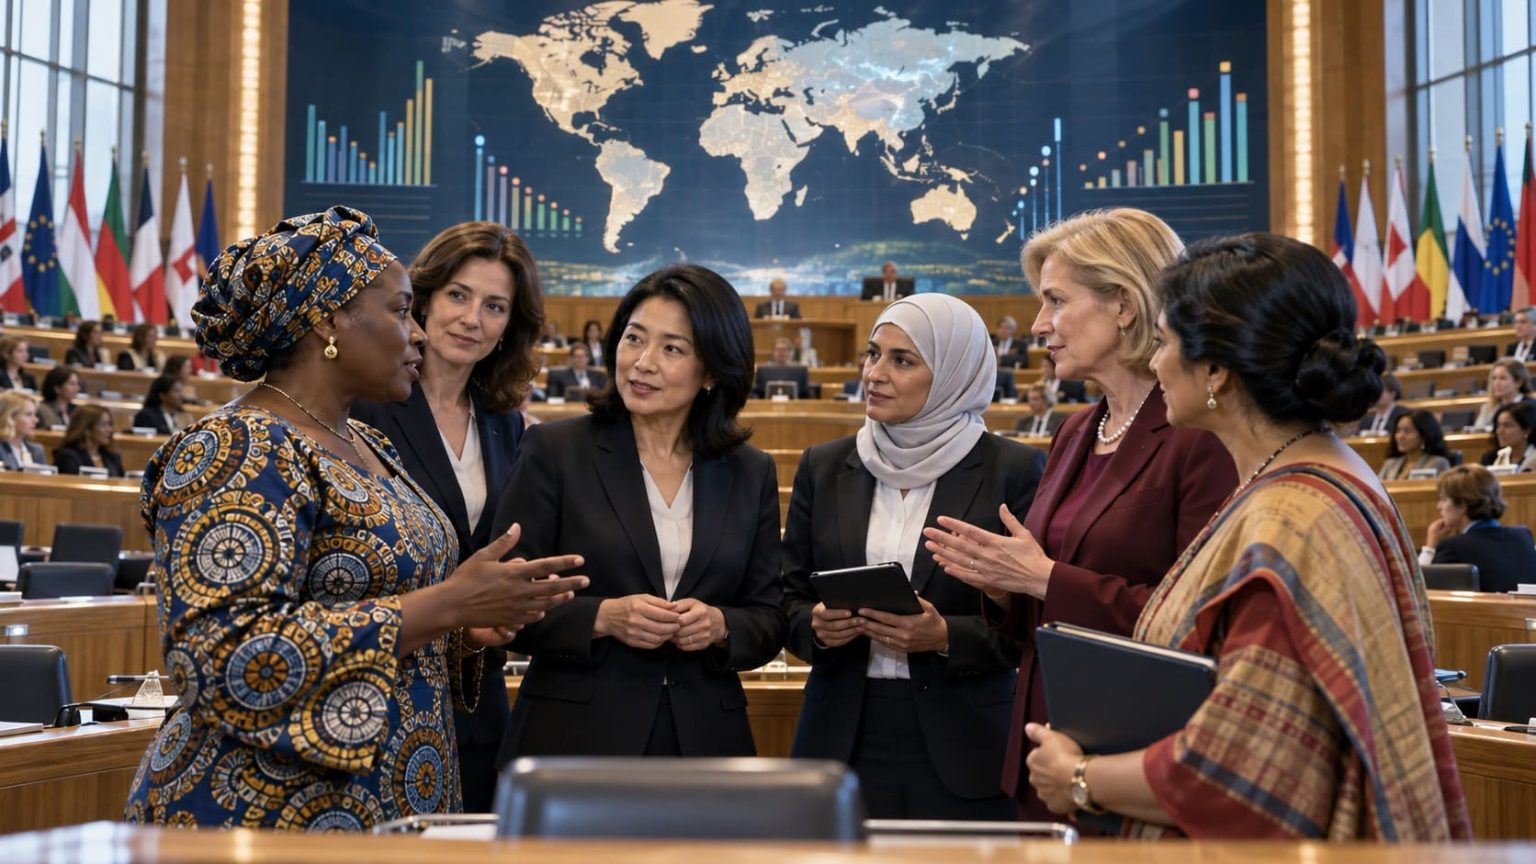
Where Women Hold the Largest Share of Parliamentary Seats
Rwanda led the August 2026 ranking with 63.8% women (51 of 80 filled seats) in its lower chamber. Cuba ranked second at 57.2%, followed by Nicaragua at 56.0%. The metric is the percentage of women among members of the lower or single parliamentary chamber, published by the Inter-Parliamentary Union (IPU). Higher percentages rank higher.
Snapshot: 1 August 2026. Unit: percent of filled lower/single-house seats. Coverage: 183 countries with ranked values; six countries lack a reported lower-house percentage and four parliaments are suspended. Data status: 183 official_value; no estimated or projected values. Numeric publisher: IPU Parline, using reports from national parliaments. Retrieved: 14 October 2026.
Rank 1; 51 women among 80 filled lower-house seats.
Oman, Tuvalu and Yemen share rank 181 in the IPU lower/single-house ranking.
IPU seat-weighted figure: 10,022 women among 36,778 MPs with known gender.
183 published country values; 6 unavailable; 4 suspended. Snapshot 1 Aug 2026.
Overview of the August 2026 parliamentary gender ranking
The ranking compares representation within the same type of chamber: lower houses in bicameral parliaments and the sole house in unicameral parliaments. It does not combine upper houses with lower houses, and the election dates shown beside countries are not the observation dates. Every reported percentage is from the IPU's 1 August 2026 snapshot.
Eight of the 183 ranked countries had at least 50% women in the relevant chamber. At the opposite end, 59 had fewer than 20%. The median country value was 26.5%, calculated from all 183 IPU-published percentages, whereas the IPU global seat-weighted average was 27.2%; those two figures have different denominators.
The ranked list excludes missing percentages rather than treating them as zero. It also preserves tied ranks from the IPU publication, so a rank can appear more than once.
Top 10 countries for women's parliamentary representation
The Top 10 begins with Rwanda at 63.8% and ends with Cabo Verde at 47.2%, a 16.6-percentage-point spread. Five of these ten countries are in the IPU Americas region.
Percent of women in filled lower or single parliamentary chamber seats, 1 August 2026
| Rank | Country | Women (%) | Region / note |
|---|---|---|---|
| 1 | Rwanda | 63.8% | Sub-Saharan Africa; 51/80 filled seats; IPU 01 Aug 2026; official_value. |
| 2 | Cuba | 57.2% | Americas; 267/467 filled seats; IPU 01 Aug 2026; official_value. |
| 3 | Nicaragua | 56.0% | Americas; 51/91 filled seats; IPU 01 Aug 2026; official_value. |
| 4 | Costa Rica | 52.6% | Americas; 30/57 filled seats; IPU 01 Aug 2026; official_value. |
| 5 | Bolivia (Plurinational State of) | 50.8% | Americas; 66/130 filled seats; IPU 01 Aug 2026; official_value. |
| 6 | Mexico | 50.4% | Americas; 252/500 filled seats; IPU 01 Aug 2026; official_value. |
| 7 | Andorra | 50.0% | Europe; 14/28 filled seats; IPU 01 Aug 2026; official_value. |
| 7 | United Arab Emirates | 50.0% | Middle East and North Africa; 20/40 filled seats; IPU 01 Aug 2026; official_value. |
| 9 | Denmark | 48.0% | Europe; 86/179 filled seats; IPU 01 Aug 2026; official_value. |
| 10 | Cabo Verde | 47.2% | Sub-Saharan Africa; 34/72 filled seats; IPU 01 Aug 2026; official_value. |
Tied places retain the published IPU rank: Andorra and the United Arab Emirates are both rank 7 at 50.0%.
Chart: Top 20 by women in the lower or single chamber
Each bar uses the same IPU-published country percentage as the tables, divided by the 63.8% leader value to set the bar length. The percentages are not shares of a 100% total across countries.
Source: IPU published percentage of filled lower/single-house seats as of 1 August 2026. Chart scale: Rwanda = 100% of the maximum bar, not 100% women.
Methodology, data quality and exclusions
Measure, unit and rank
IPU publishes the percentage of female members among filled seats in the lower or sole parliamentary chamber. Unit: %. Direction: descending. Tied percentages share the same published rank; ranks are based on IPU one-decimal reported values, not on independently reconstructed percentages.
Dates and publication status
Every percentage is IPU's 1 August 2026 observation and has official_value status. The election month/year in each row describes when its chamber was last elected; it must not be interpreted as the percentage's observation year. No forecasts or modeled 2026 numbers are used.
Geography and source roles
Regions follow IPU's regional groupings. The monthly ranking is the sole numeric source; the separate IPU averages page validates only the published aggregate lower/single-house totals (women and MPs with known gender), not any individual country percentage or chamber count; the IPU regional-grouping page defines the region filter. Three URLs from the same publishing organization are one independent publisher, not three.
Coverage and missingness
183 ranked countries are included. Six without a lower/single-house percentage are Eritrea, Ethiopia, Guinea-Bissau, Haiti, Kazakhstan and Venezuela. Four with suspended parliaments are Afghanistan, Kuwait, Myanmar and Sudan. All ten are omitted from ranking arithmetic and filters.
Calculation methods: the official lower/single-house global average is 10,022 women / 36,778 filled seats with known member gender × 100 = 27.24999%, shown by IPU as 27.2%. StatRanker's unweighted country mean = sum of 183 published percentages / 183 = 26.7% (one decimal); median = position 92 of the 183 values ordered by percentage = 26.5%. The unweighted country median and mean are calculated_value analytical summaries from official observed inputs, not official IPU country-average statistics, estimates or forecasts.
Reconciliation check: summing the 183 reported row-level female counts and filled-seat counts yields exactly 10,022 / 36,778, matching the IPU global table's known-gender totals. The IPU separately lists 37,821 total lower/single-house MPs; its 1,043-seat difference is associated with membership lacking a known gender breakdown in the underlying published tally. Countries without a numeric percentage are not assigned zero.
Six source-percentage cross-check flags: Ecuador (IPU 43.1%; 65/151 rounds to 43.0%), Uganda (35.4%; 187/529 to 35.3%), Chile (33.6%; 52/155 to 33.5%), Egypt (26.9%; 160/596 to 26.8%), Bosnia and Herzegovina (19.1%; 8/42 to 19.0%) and Sao Tome and Principe (14.6%; 8/55 to 14.5%). These are approximately 0.1 percentage-point differences at displayed precision. The ranking preserves the IPU-published percentages; the underlying discrepancy is not silently corrected or attributed to an unverified cause.
Limits: shares reflect filled seats, not all constitutionally authorized seats, candidate shares, equal voting power, election quality, cabinet positions or women's influence over legislation. Upper-chamber figures are not ranked here. Percentages are rounded to one decimal and can change when IPU updates the monthly report. Historical election dates, including Libya (2014) and Yemen (2003), should not be mistaken for an election held in August 2026.
Full country ranking: all 183 reported parliamentary percentages
Search countries, filter by IPU region or status, reorder existing rows, or limit the view to the Top 10 or Top 20. The published rank remains unchanged when you sort alphabetically or by percentage.
August 2026 ranking (IPU Parline) · Lower or single chamber · Percent women
| Rank | Country | Women (%) | Region / source / method note |
|---|---|---|---|
| 1 | Rwanda | 63.8% | Sub-Saharan Africa; IPU 1 Aug 2026; 51/80 filled seats; election 07.2024; official_value. |
| 2 | Cuba | 57.2% | Americas; IPU 1 Aug 2026; 267/467 filled seats; election 03.2023; official_value. |
| 3 | Nicaragua | 56.0% | Americas; IPU 1 Aug 2026; 51/91 filled seats; election 11.2021; official_value. |
| 4 | Costa Rica | 52.6% | Americas; IPU 1 Aug 2026; 30/57 filled seats; election 02.2026; official_value. |
| 5 | Bolivia (Plurinational State of) | 50.8% | Americas; IPU 1 Aug 2026; 66/130 filled seats; election 08.2025; official_value. |
| 6 | Mexico | 50.4% | Americas; IPU 1 Aug 2026; 252/500 filled seats; election 06.2024; official_value. |
| 7 | Andorra | 50.0% | Europe; IPU 1 Aug 2026; 14/28 filled seats; election 04.2023; official_value. |
| 7 | United Arab Emirates | 50.0% | Middle East and North Africa; IPU 1 Aug 2026; 20/40 filled seats; election 10.2023; official_value. |
| 9 | Denmark | 48.0% | Europe; IPU 1 Aug 2026; 86/179 filled seats; election 03.2026; official_value. |
| 10 | Cabo Verde | 47.2% | Sub-Saharan Africa; IPU 1 Aug 2026; 34/72 filled seats; election 05.2026; official_value. |
| 11 | New Zealand | 46.3% | Pacific; IPU 1 Aug 2026; 57/123 filled seats; election 10.2023; official_value. |
| 12 | Australia | 46.0% | Pacific; IPU 1 Aug 2026; 69/150 filled seats; election 05.2025; official_value. |
| 12 | Iceland | 46.0% | Europe; IPU 1 Aug 2026; 29/63 filled seats; election 11.2024; official_value. |
| 14 | Monaco | 45.8% | Europe; IPU 1 Aug 2026; 11/24 filled seats; election 02.2023; official_value. |
| 15 | Finland | 45.5% | Europe; IPU 1 Aug 2026; 91/200 filled seats; election 04.2023; official_value. |
| 16 | South Africa | 45.1% | Sub-Saharan Africa; IPU 1 Aug 2026; 179/397 filled seats; election 05.2024; official_value. |
| 17 | Sweden | 44.7% | Europe; IPU 1 Aug 2026; 156/349 filled seats; election 09.2022; official_value. |
| 18 | Spain | 44.0% | Europe; IPU 1 Aug 2026; 154/350 filled seats; election 07.2023; official_value. |
| 19 | Netherlands | 43.3% | Europe; IPU 1 Aug 2026; 65/150 filled seats; election 10.2025; official_value. |
| 20 | Ecuador | 43.1% | Americas; IPU 1 Aug 2026; 65/151 filled seats; election 02.2025; official_value. Check: seat ratio 43.0% vs IPU 43.1%. |
| 21 | Norway | 42.6% | Europe; IPU 1 Aug 2026; 72/169 filled seats; election 09.2025; official_value. |
| 22 | Namibia | 42.3% | Sub-Saharan Africa; IPU 1 Aug 2026; 44/104 filled seats; election 11.2024; official_value. |
| 23 | Peru | 41.5% | Americas; IPU 1 Aug 2026; 54/130 filled seats; election 04.2026; official_value. |
| 24 | Angola | 41.4% | Sub-Saharan Africa; IPU 1 Aug 2026; 91/220 filled seats; election 08.2022; official_value. |
| 25 | Senegal | 41.2% | Sub-Saharan Africa; IPU 1 Aug 2026; 68/165 filled seats; election 11.2024; official_value. |
| 26 | Switzerland | 41.0% | Europe; IPU 1 Aug 2026; 82/200 filled seats; election 10.2023; official_value. |
| 26 | United Kingdom | 41.0% | Europe; IPU 1 Aug 2026; 266/649 filled seats; election 07.2024; official_value. |
| 28 | Argentina | 40.9% | Americas; IPU 1 Aug 2026; 105/257 filled seats; election 10.2025; official_value. |
| 29 | Guinea | 40.8% | Sub-Saharan Africa; IPU 1 Aug 2026; 60/147 filled seats; election 05.2026; official_value. |
| 30 | Belgium | 40.7% | Europe; IPU 1 Aug 2026; 61/150 filled seats; election 06.2024; official_value. |
| 31 | Dominica | 40.6% | Americas; IPU 1 Aug 2026; 13/32 filled seats; election 12.2022; official_value. |
| 32 | Burundi | 39.6% | Sub-Saharan Africa; IPU 1 Aug 2026; 44/111 filled seats; election 06.2025; official_value. |
| 32 | Republic of Moldova | 39.6% | Europe; IPU 1 Aug 2026; 40/101 filled seats; election 09.2025; official_value. |
| 34 | North Macedonia | 39.2% | Europe; IPU 1 Aug 2026; 47/120 filled seats; election 05.2024; official_value. |
| 34 | Uzbekistan | 39.2% | Asia; IPU 1 Aug 2026; 58/148 filled seats; election 10.2024; official_value. |
| 36 | Mozambique | 38.0% | Sub-Saharan Africa; IPU 1 Aug 2026; 95/250 filled seats; election 10.2024; official_value. |
| 37 | Serbia | 37.6% | Europe; IPU 1 Aug 2026; 94/250 filled seats; election 12.2023; official_value. |
| 37 | United Republic of Tanzania | 37.6% | Sub-Saharan Africa; IPU 1 Aug 2026; 147/391 filled seats; election 10.2025; official_value. |
| 39 | Dominican Republic | 37.4% | Americas; IPU 1 Aug 2026; 71/190 filled seats; election 05.2024; official_value. |
| 40 | Latvia | 37.0% | Europe; IPU 1 Aug 2026; 37/100 filled seats; election 10.2022; official_value. |
| 41 | Slovenia | 36.7% | Europe; IPU 1 Aug 2026; 33/90 filled seats; election 03.2026; official_value. |
| 42 | Portugal | 36.5% | Europe; IPU 1 Aug 2026; 84/230 filled seats; election 05.2025; official_value. |
| 43 | France | 36.2% | Europe; IPU 1 Aug 2026; 208/575 filled seats; election 06.2024; official_value. |
| 44 | Guyana | 36.1% | Americas; IPU 1 Aug 2026; 26/72 filled seats; election 09.2025; official_value. |
| 45 | Timor-Leste | 35.4% | Asia; IPU 1 Aug 2026; 23/65 filled seats; election 05.2023; official_value. |
| 45 | Uganda | 35.4% | Sub-Saharan Africa; IPU 1 Aug 2026; 187/529 filled seats; election 01.2026; official_value. Check: seat ratio 35.3% vs IPU 35.4%. |
| 47 | Armenia | 35.2% | Europe; IPU 1 Aug 2026; 37/105 filled seats; election 06.2026; official_value. |
| 48 | Austria | 35.0% | Europe; IPU 1 Aug 2026; 64/183 filled seats; election 09.2024; official_value. |
| 48 | Luxembourg | 35.0% | Europe; IPU 1 Aug 2026; 21/60 filled seats; election 10.2023; official_value. |
| 48 | San Marino | 35.0% | Europe; IPU 1 Aug 2026; 21/60 filled seats; election 06.2024; official_value. |
| 51 | Nepal | 34.9% | Asia; IPU 1 Aug 2026; 96/275 filled seats; election 03.2026; official_value. |
| 52 | Albania | 34.3% | Europe; IPU 1 Aug 2026; 48/140 filled seats; election 05.2025; official_value. |
| 53 | Malta | 34.2% | Europe; IPU 1 Aug 2026; 27/79 filled seats; election 05.2026; official_value. |
| 54 | Belarus | 33.9% | Europe; IPU 1 Aug 2026; 37/109 filled seats; election 02.2024; official_value. |
| 54 | Cameroon | 33.9% | Sub-Saharan Africa; IPU 1 Aug 2026; 61/180 filled seats; election 02.2020; official_value. |
| 56 | Chile | 33.6% | Americas; IPU 1 Aug 2026; 52/155 filled seats; election 11.2025; official_value. Check: seat ratio 33.5% vs IPU 33.6%. |
| 57 | Chad | 33.5% | Sub-Saharan Africa; IPU 1 Aug 2026; 63/188 filled seats; election 12.2024; official_value. |
| 57 | Czechia | 33.5% | Europe; IPU 1 Aug 2026; 67/200 filled seats; election 10.2025; official_value. |
| 59 | Kyrgyzstan | 33.3% | Asia; IPU 1 Aug 2026; 30/90 filled seats; election 11.2025; official_value. |
| 60 | Italy | 32.8% | Europe; IPU 1 Aug 2026; 131/400 filled seats; election 09.2022; official_value. |
| 61 | Croatia | 32.7% | Europe; IPU 1 Aug 2026; 49/150 filled seats; election 04.2024; official_value. |
| 62 | Germany | 32.5% | Europe; IPU 1 Aug 2026; 205/630 filled seats; election 02.2025; official_value. |
| 63 | South Sudan | 32.4% | Sub-Saharan Africa; IPU 1 Aug 2026; 178/550 filled seats; election 05.2021; official_value. |
| 64 | Singapore | 32.3% | Asia; IPU 1 Aug 2026; 32/99 filled seats; election 05.2025; official_value. |
| 65 | Liechtenstein | 32.0% | Europe; IPU 1 Aug 2026; 8/25 filled seats; election 02.2025; official_value. |
| 66 | El Salvador | 31.7% | Americas; IPU 1 Aug 2026; 19/60 filled seats; election 02.2024; official_value. |
| 67 | Poland | 31.5% | Europe; IPU 1 Aug 2026; 145/460 filled seats; election 10.2023; official_value. |
| 68 | Suriname | 31.4% | Americas; IPU 1 Aug 2026; 16/51 filled seats; election 05.2025; official_value. |
| 69 | Grenada | 31.3% | Americas; IPU 1 Aug 2026; 5/16 filled seats; election 06.2022; official_value. |
| 69 | Saint Kitts and Nevis | 31.3% | Americas; IPU 1 Aug 2026; 5/16 filled seats; election 08.2022; official_value. |
| 71 | Equatorial Guinea | 31.0% | Sub-Saharan Africa; IPU 1 Aug 2026; 31/100 filled seats; election 11.2022; official_value. |
| 72 | Canada | 30.6% | Americas; IPU 1 Aug 2026; 105/343 filled seats; election 04.2025; official_value. |
| 73 | Saint Vincent and the Grenadines | 30.4% | Americas; IPU 1 Aug 2026; 7/23 filled seats; election 11.2025; official_value. |
| 74 | Uruguay | 30.3% | Americas; IPU 1 Aug 2026; 30/99 filled seats; election 10.2024; official_value. |
| 75 | Jamaica | 30.2% | Americas; IPU 1 Aug 2026; 19/63 filled seats; election 09.2025; official_value. |
| 76 | Mali | 30.1% | Sub-Saharan Africa; IPU 1 Aug 2026; 40/133 filled seats; election 12.2020; official_value. |
| 76 | Zimbabwe | 30.1% | Sub-Saharan Africa; IPU 1 Aug 2026; 84/279 filled seats; election 08.2023; official_value. |
| 78 | Viet Nam | 30.0% | Asia; IPU 1 Aug 2026; 150/500 filled seats; election 03.2026; official_value. |
| 79 | Estonia | 29.7% | Europe; IPU 1 Aug 2026; 30/101 filled seats; election 03.2023; official_value. |
| 79 | Honduras | 29.7% | Americas; IPU 1 Aug 2026; 38/128 filled seats; election 11.2025; official_value. |
| 79 | Lao People's Democratic Republic | 29.7% | Asia; IPU 1 Aug 2026; 52/175 filled seats; election 02.2026; official_value. |
| 82 | Barbados | 29.0% | Americas; IPU 1 Aug 2026; 9/31 filled seats; election 02.2026; official_value. |
| 82 | Tajikistan | 29.0% | Asia; IPU 1 Aug 2026; 18/62 filled seats; election 03.2025; official_value. |
| 84 | United States of America | 28.8% | Americas; IPU 1 Aug 2026; 124/431 filled seats; election 11.2024; official_value. |
| 85 | Lithuania | 28.4% | Europe; IPU 1 Aug 2026; 40/141 filled seats; election 10.2024; official_value. |
| 86 | Philippines | 28.3% | Asia; IPU 1 Aug 2026; 90/318 filled seats; election 05.2025; official_value. |
| 87 | Sierra Leone | 28.2% | Sub-Saharan Africa; IPU 1 Aug 2026; 42/149 filled seats; election 06.2023; official_value. |
| 88 | Colombia | 27.9% | Americas; IPU 1 Aug 2026; 51/183 filled seats; election 03.2026; official_value. |
| 89 | Montenegro | 27.2% | Europe; IPU 1 Aug 2026; 22/81 filled seats; election 06.2023; official_value. |
| 90 | Hungary | 27.1% | Europe; IPU 1 Aug 2026; 54/199 filled seats; election 04.2026; official_value. |
| 91 | Egypt | 26.9% | Middle East and North Africa; IPU 1 Aug 2026; 160/596 filled seats; election 11.2025; official_value. Check: seat ratio 26.8% vs IPU 26.9%. |
| 92 | China | 26.5% | Asia; IPU 1 Aug 2026; 790/2977 filled seats; election 03.2023; official_value. |
| 92 | Seychelles | 26.5% | Sub-Saharan Africa; IPU 1 Aug 2026; 9/34 filled seats; election 09.2025; official_value. |
| 94 | Djibouti | 26.2% | Sub-Saharan Africa; IPU 1 Aug 2026; 17/65 filled seats; election 02.2023; official_value. |
| 95 | Israel | 25.8% | Middle East and North Africa; IPU 1 Aug 2026; 31/120 filled seats; election 11.2022; official_value. |
| 96 | Benin | 25.7% | Sub-Saharan Africa; IPU 1 Aug 2026; 28/109 filled seats; election 01.2026; official_value. |
| 97 | Iraq | 25.5% | Middle East and North Africa; IPU 1 Aug 2026; 84/329 filled seats; election 11.2025; official_value. |
| 98 | Mongolia | 25.4% | Asia; IPU 1 Aug 2026; 32/126 filled seats; election 06.2024; official_value. |
| 98 | Turkmenistan | 25.4% | Asia; IPU 1 Aug 2026; 31/122 filled seats; election 03.2023; official_value. |
| 100 | Ireland | 25.0% | Europe; IPU 1 Aug 2026; 43/172 filled seats; election 11.2024; official_value. |
| 100 | Lesotho | 25.0% | Sub-Saharan Africa; IPU 1 Aug 2026; 30/120 filled seats; election 10.2022; official_value. |
| 100 | Palau | 25.0% | Pacific; IPU 1 Aug 2026; 4/16 filled seats; election 11.2024; official_value. |
| 103 | Morocco | 24.3% | Middle East and North Africa; IPU 1 Aug 2026; 96/395 filled seats; election 09.2021; official_value. |
| 104 | Greece | 23.9% | Europe; IPU 1 Aug 2026; 71/297 filled seats; election 06.2023; official_value. |
| 105 | Bulgaria | 23.8% | Europe; IPU 1 Aug 2026; 57/240 filled seats; election 04.2026; official_value. |
| 105 | Paraguay | 23.8% | Americas; IPU 1 Aug 2026; 19/80 filled seats; election 04.2023; official_value. |
| 105 | Trinidad and Tobago | 23.8% | Americas; IPU 1 Aug 2026; 10/42 filled seats; election 04.2025; official_value. |
| 108 | Mauritania | 23.3% | Middle East and North Africa; IPU 1 Aug 2026; 41/176 filled seats; election 05.2023; official_value. |
| 109 | Kenya | 23.0% | Sub-Saharan Africa; IPU 1 Aug 2026; 80/348 filled seats; election 08.2022; official_value. |
| 110 | Romania | 22.7% | Europe; IPU 1 Aug 2026; 75/330 filled seats; election 12.2024; official_value. |
| 111 | Indonesia | 22.2% | Asia; IPU 1 Aug 2026; 129/580 filled seats; election 02.2024; official_value. |
| 112 | Slovakia | 22.0% | Europe; IPU 1 Aug 2026; 33/150 filled seats; election 09.2023; official_value. |
| 113 | Pakistan | 21.7% | Asia; IPU 1 Aug 2026; 72/332 filled seats; election 02.2024; official_value. |
| 113 | Panama | 21.7% | Americas; IPU 1 Aug 2026; 15/69 filled seats; election 05.2024; official_value. |
| 115 | Gabon | 21.6% | Sub-Saharan Africa; IPU 1 Aug 2026; 30/139 filled seats; election 09.2025; official_value. |
| 115 | Togo | 21.6% | Sub-Saharan Africa; IPU 1 Aug 2026; 24/111 filled seats; election 04.2024; official_value. |
| 117 | Micronesia (Federated States of) | 21.4% | Pacific; IPU 1 Aug 2026; 3/14 filled seats; election 03.2025; official_value. |
| 118 | Republic of Korea | 21.3% | Asia; IPU 1 Aug 2026; 64/300 filled seats; election 04.2024; official_value. |
| 119 | Ukraine | 21.1% | Europe; IPU 1 Aug 2026; 83/393 filled seats; election 07.2019; official_value. |
| 120 | Azerbaijan | 20.8% | Europe; IPU 1 Aug 2026; 26/125 filled seats; election 09.2024; official_value. |
| 121 | Malawi | 20.7% | Sub-Saharan Africa; IPU 1 Aug 2026; 47/227 filled seats; election 09.2025; official_value. |
| 122 | Eswatini | 20.3% | Sub-Saharan Africa; IPU 1 Aug 2026; 15/74 filled seats; election 09.2023; official_value. |
| 123 | Bahrain | 20.0% | Middle East and North Africa; IPU 1 Aug 2026; 8/40 filled seats; election 11.2022; official_value. |
| 123 | Guatemala | 20.0% | Americas; IPU 1 Aug 2026; 32/160 filled seats; election 06.2023; official_value. |
| 125 | Saudi Arabia | 19.9% | Middle East and North Africa; IPU 1 Aug 2026; 30/151 filled seats; election 09.2024; official_value. |
| 125 | Türkiye | 19.9% | Europe; IPU 1 Aug 2026; 118/592 filled seats; election 05.2023; official_value. |
| 127 | Thailand | 19.8% | Asia; IPU 1 Aug 2026; 99/500 filled seats; election 02.2026; official_value. |
| 128 | Cyprus | 19.6% | Europe; IPU 1 Aug 2026; 11/56 filled seats; election 05.2026; official_value. |
| 128 | Jordan | 19.6% | Middle East and North Africa; IPU 1 Aug 2026; 27/138 filled seats; election 09.2024; official_value. |
| 128 | Niger | 19.6% | Sub-Saharan Africa; IPU 1 Aug 2026; 38/194 filled seats; election 05.2025; official_value. |
| 131 | Bahamas | 19.5% | Americas; IPU 1 Aug 2026; 8/41 filled seats; election 05.2026; official_value. |
| 132 | Bosnia and Herzegovina | 19.1% | Europe; IPU 1 Aug 2026; 8/42 filled seats; election 10.2022; official_value. Check: seat ratio 19.0% vs IPU 19.1%. |
| 133 | Burkina Faso | 19.0% | Sub-Saharan Africa; IPU 1 Aug 2026; 11/58 filled seats; election 03.2026; official_value. |
| 133 | Somalia | 19.0% | Sub-Saharan Africa; IPU 1 Aug 2026; 52/274 filled seats; election 11.2021; official_value. |
| 135 | Comoros | 18.2% | Sub-Saharan Africa; IPU 1 Aug 2026; 6/33 filled seats; election 01.2025; official_value. |
| 136 | Mauritius | 17.9% | Sub-Saharan Africa; IPU 1 Aug 2026; 12/67 filled seats; election 11.2024; official_value. |
| 136 | Russian Federation | 17.9% | Europe; IPU 1 Aug 2026; 78/435 filled seats; election 09.2021; official_value. |
| 138 | Brazil | 17.2% | Americas; IPU 1 Aug 2026; 88/513 filled seats; election 10.2022; official_value. |
| 139 | Georgia | 16.8% | Europe; IPU 1 Aug 2026; 17/101 filled seats; election 10.2024; official_value. |
| 140 | Libya | 16.5% | Middle East and North Africa; IPU 1 Aug 2026; 28/170 filled seats; election 06.2014; official_value. Election 2014: historical chamber date. |
| 141 | Bangladesh | 16.4% | Asia; IPU 1 Aug 2026; 57/348 filled seats; election 02.2026; official_value. |
| 142 | Madagascar | 16.0% | Sub-Saharan Africa; IPU 1 Aug 2026; 26/163 filled seats; election 05.2024; official_value. |
| 143 | Tunisia | 15.8% | Middle East and North Africa; IPU 1 Aug 2026; 24/152 filled seats; election 12.2022; official_value. |
| 144 | Democratic People's Republic of Korea | 15.7% | Asia; IPU 1 Aug 2026; 108/687 filled seats; election 03.2026; official_value. |
| 145 | Zambia | 15.0% | Sub-Saharan Africa; IPU 1 Aug 2026; 25/167 filled seats; election 08.2021; official_value. |
| 146 | Côte d'Ivoire | 14.9% | Sub-Saharan Africa; IPU 1 Aug 2026; 38/255 filled seats; election 12.2025; official_value. |
| 147 | Congo | 14.6% | Sub-Saharan Africa; IPU 1 Aug 2026; 22/151 filled seats; election 07.2022; official_value. |
| 147 | Japan | 14.6% | Asia; IPU 1 Aug 2026; 68/465 filled seats; election 02.2026; official_value. |
| 147 | Sao Tome and Principe | 14.6% | Sub-Saharan Africa; IPU 1 Aug 2026; 8/55 filled seats; election 09.2022; official_value. Check: seat ratio 14.5% vs IPU 14.6%. |
| 150 | Ghana | 14.5% | Sub-Saharan Africa; IPU 1 Aug 2026; 40/276 filled seats; election 12.2024; official_value. |
| 151 | India | 13.8% | Asia; IPU 1 Aug 2026; 75/542 filled seats; election 04.2024; official_value. |
| 152 | Cambodia | 13.6% | Asia; IPU 1 Aug 2026; 17/125 filled seats; election 07.2023; official_value. |
| 152 | Malaysia | 13.6% | Asia; IPU 1 Aug 2026; 30/221 filled seats; election 11.2022; official_value. |
| 154 | Democratic Republic of the Congo | 12.8% | Sub-Saharan Africa; IPU 1 Aug 2026; 64/500 filled seats; election 12.2023; official_value. |
| 155 | Belize | 12.5% | Americas; IPU 1 Aug 2026; 4/32 filled seats; election 03.2025; official_value. |
| 156 | Marshall Islands | 12.1% | Pacific; IPU 1 Aug 2026; 4/33 filled seats; election 11.2023; official_value. |
| 157 | Brunei Darussalam | 11.4% | Asia; IPU 1 Aug 2026; 4/35 filled seats; election 01.2023; official_value. |
| 157 | Central African Republic | 11.4% | Sub-Saharan Africa; IPU 1 Aug 2026; 16/140 filled seats; election 12.2025; official_value. |
| 159 | Antigua and Barbuda | 11.1% | Americas; IPU 1 Aug 2026; 2/18 filled seats; election 04.2026; official_value. |
| 159 | Kiribati | 11.1% | Pacific; IPU 1 Aug 2026; 5/45 filled seats; election 08.2024; official_value. |
| 161 | Liberia | 11.0% | Sub-Saharan Africa; IPU 1 Aug 2026; 8/73 filled seats; election 10.2023; official_value. |
| 162 | Syrian Arab Republic | 10.7% | Middle East and North Africa; IPU 1 Aug 2026; 22/206 filled seats; election 10.2025; official_value. |
| 163 | Naoero | 10.5% | Pacific; IPU 1 Aug 2026; 2/19 filled seats; election 10.2025; official_value. |
| 163 | Saint Lucia | 10.5% | Americas; IPU 1 Aug 2026; 2/19 filled seats; election 12.2025; official_value. |
| 165 | Samoa | 9.8% | Pacific; IPU 1 Aug 2026; 5/51 filled seats; election 08.2025; official_value. |
| 165 | Sri Lanka | 9.8% | Asia; IPU 1 Aug 2026; 22/225 filled seats; election 11.2024; official_value. |
| 167 | Fiji | 9.1% | Pacific; IPU 1 Aug 2026; 5/55 filled seats; election 12.2022; official_value. |
| 168 | Botswana | 9.0% | Sub-Saharan Africa; IPU 1 Aug 2026; 6/67 filled seats; election 10.2024; official_value. |
| 169 | Gambia (The) | 8.6% | Sub-Saharan Africa; IPU 1 Aug 2026; 5/58 filled seats; election 04.2022; official_value. |
| 170 | Lebanon | 6.3% | Middle East and North Africa; IPU 1 Aug 2026; 8/128 filled seats; election 05.2022; official_value. |
| 171 | Algeria | 6.1% | Middle East and North Africa; IPU 1 Aug 2026; 25/407 filled seats; election 07.2026; official_value. |
| 171 | Qatar | 6.1% | Middle East and North Africa; IPU 1 Aug 2026; 3/49 filled seats; election 10.2025; official_value. |
| 173 | Solomon Islands | 6.0% | Pacific; IPU 1 Aug 2026; 3/50 filled seats; election 04.2024; official_value. |
| 174 | Iran (Islamic Republic of) | 4.9% | Asia; IPU 1 Aug 2026; 14/285 filled seats; election 03.2024; official_value. |
| 175 | Bhutan | 4.3% | Asia; IPU 1 Aug 2026; 2/47 filled seats; election 01.2024; official_value. |
| 176 | Nigeria | 4.2% | Sub-Saharan Africa; IPU 1 Aug 2026; 15/356 filled seats; election 02.2023; official_value. |
| 177 | Tonga | 3.7% | Pacific; IPU 1 Aug 2026; 1/27 filled seats; election 11.2025; official_value. |
| 178 | Maldives | 3.2% | Asia; IPU 1 Aug 2026; 3/93 filled seats; election 04.2024; official_value. |
| 179 | Papua New Guinea | 2.7% | Pacific; IPU 1 Aug 2026; 3/111 filled seats; election 07.2022; official_value. |
| 180 | Vanuatu | 1.9% | Pacific; IPU 1 Aug 2026; 1/52 filled seats; election 01.2025; official_value. |
| 181 | Oman | 0.0% | Middle East and North Africa; IPU 1 Aug 2026; 0/90 filled seats; election 10.2023; official_value. |
| 181 | Tuvalu | 0.0% | Pacific; IPU 1 Aug 2026; 0/16 filled seats; election 01.2024; official_value. |
| 181 | Yemen | 0.0% | Middle East and North Africa; IPU 1 Aug 2026; 0/245 filled seats; election 04.2003; official_value. Election 2003: historical chamber date. |
The rank column reproduces IPU's tied positions. The percentage, women-count, filled-seat-count and election month/year are as published for the 1 August 2026 snapshot. All 183 rows remain visible when scripts are disabled.
Four findings from the August 2026 country data
Key Insight
8 of 183 countries (4.4%) reached at least 50% women in the lower/single house. Rwanda's 63.8% exceeds the 50% threshold by 13.8 percentage points.
Notable Pattern
31 countries (16.9%) were at 40% or more; 59 (32.2%) were below 20%. The unweighted median country stood at 26.5%, against an unweighted mean of 26.7%.
Regional/Source Concentration
5 of the Top 10 came from the IPU Americas group: Cuba, Nicaragua, Costa Rica, Bolivia and Mexico. Across all 183 ranked countries the regional counts were Europe 48, Sub-Saharan Africa 44, Americas 33, Asia 27, Middle East and North Africa 17, and Pacific 14.
Outlier
Canada ranked 72nd at 30.6% in its lower chamber, but the IPU reported 55.1% women in its upper chamber. The 24.5-point difference demonstrates why a lower-house ranking cannot stand in for both houses.
How to interpret a country's rank
A higher rank means a larger share of women among the members of the relevant parliamentary chamber on 1 August 2026. It is not a ranking of democratic quality, government gender equality policies, women's participation in elections, or the share of women in a cabinet. A bicameral country's upper chamber may have a substantially different percentage.
Countries should not be compared using election months as if they were observation years. Likewise, 0.0% is an observed number for Oman, Tuvalu and Yemen in the IPU table; it must not be confused with an unavailable percentage for another country. The global 27.2% figure is seat-weighted, while the country median of 26.5% gives one observation to each of 183 listed countries regardless of chamber size.
FAQ: women in national parliaments in August 2026
Which country had the highest proportion of women in parliament in August 2026?
Rwanda led the IPU lower/single-house ranking with 63.8% women, or 51 out of 80 filled seats, as of 1 August 2026.
Why does the ranking use 1 August instead of the date of the last election?
IPU ranks the number of women among members who held filled seats at the monthly snapshot date. Election months are reference dates for each chamber; they do not replace the 1 August 2026 observation date.
Are these official values or modeled 2026 projections?
All 183 percentages are official IPU-published snapshot values compiled from national-parliament information. There are no modeled forecasts. StatRanker's median, unweighted mean, tier counts and percentage-point gaps are calculated from those published inputs.
Does this table include upper-house women senators?
No. It ranks the lower chamber in bicameral countries and the sole chamber in unicameral countries. The IPU source separately publishes upper-chamber percentages; for example, Canada shows 30.6% in its lower chamber and 55.1% in its upper chamber.
How many countries reached gender parity at 50% or higher?
Eight of the 183 ranked countries: Rwanda, Cuba, Nicaragua, Costa Rica, Bolivia, Mexico, Andorra and the United Arab Emirates. They occupy the first eight country positions, with Andorra and the UAE tied at rank 7.
Why are ten countries not assigned a rank?
For Eritrea, Ethiopia, Guinea-Bissau, Haiti, Kazakhstan and Venezuela, the IPU August table does not report a lower/single-house women percentage. Afghanistan, Kuwait, Myanmar and Sudan are marked as suspended. Missing or suspended is not the same as zero women.
Why is the worldwide 27.2% not identical to the 26.7% country mean?
IPU's 27.2% uses 10,022 women divided by 36,778 filled lower/single-house seats with known gender. The 26.7% mean equally weights all 183 country percentages; larger and smaller chambers each contribute one percentage rather than a proportional number of seats.
How are ranks and percentage inconsistencies handled?
IPU's published percentage and tied rank are retained. In six countries, recomputing women divided by the displayed count of filled seats differs by about 0.1 percentage point from the published percentage; these entries are identified in the table and methodology instead of being silently adjusted.
Sources and reproducibility
IPU Parline · monthly country ranking
Role: numeric_source. Official 1 August 2026 rankings, chamber counts, women counts, election dates and reported country percentages. Single publishing organization.
https://data.ipu.org/women-ranking/?date_month=08&date_year=2026IPU Parline · global and regional averages
Role: validation_source. Official 27.2% global average and totals for lower/single chambers: 10,022 women, 36,778 members with known gender; regional context figures. Same publisher as the numeric source.
https://data.ipu.org/women-averages/?date_month=08&date_year=2026IPU Parline · regional groupings
Role: methodology_source. Defines six major IPU regions and their country membership for the filter and regional concentration checks. Not a separate numerical source.
https://data.ipu.org/regional-groupings/Download the Women in National Parliaments by Country: August 2026 Ranking dataset
Women in National Parliaments by Country: August 2026 Ranking
183 ranked entries · Excel + CSV + methodology + sources + chart · Snapshot: IPU lower/single chamber percentage, 1 August 2026 · Version 1.0
The archive includes machine-readable data, methodology and source documentation. Quick human verification is required before the ZIP is delivered. Full Data Pack downloads require a free account. Free accounts can download 1 different Data Pack every 30 days; re-downloading the same pack does not use another slot. Annual Data Access provides unlimited manual downloads while annual access is active.
Download Excel + CSV Data Pack