

Electricity Outage Duration by U.S. State: 2024 Ranking
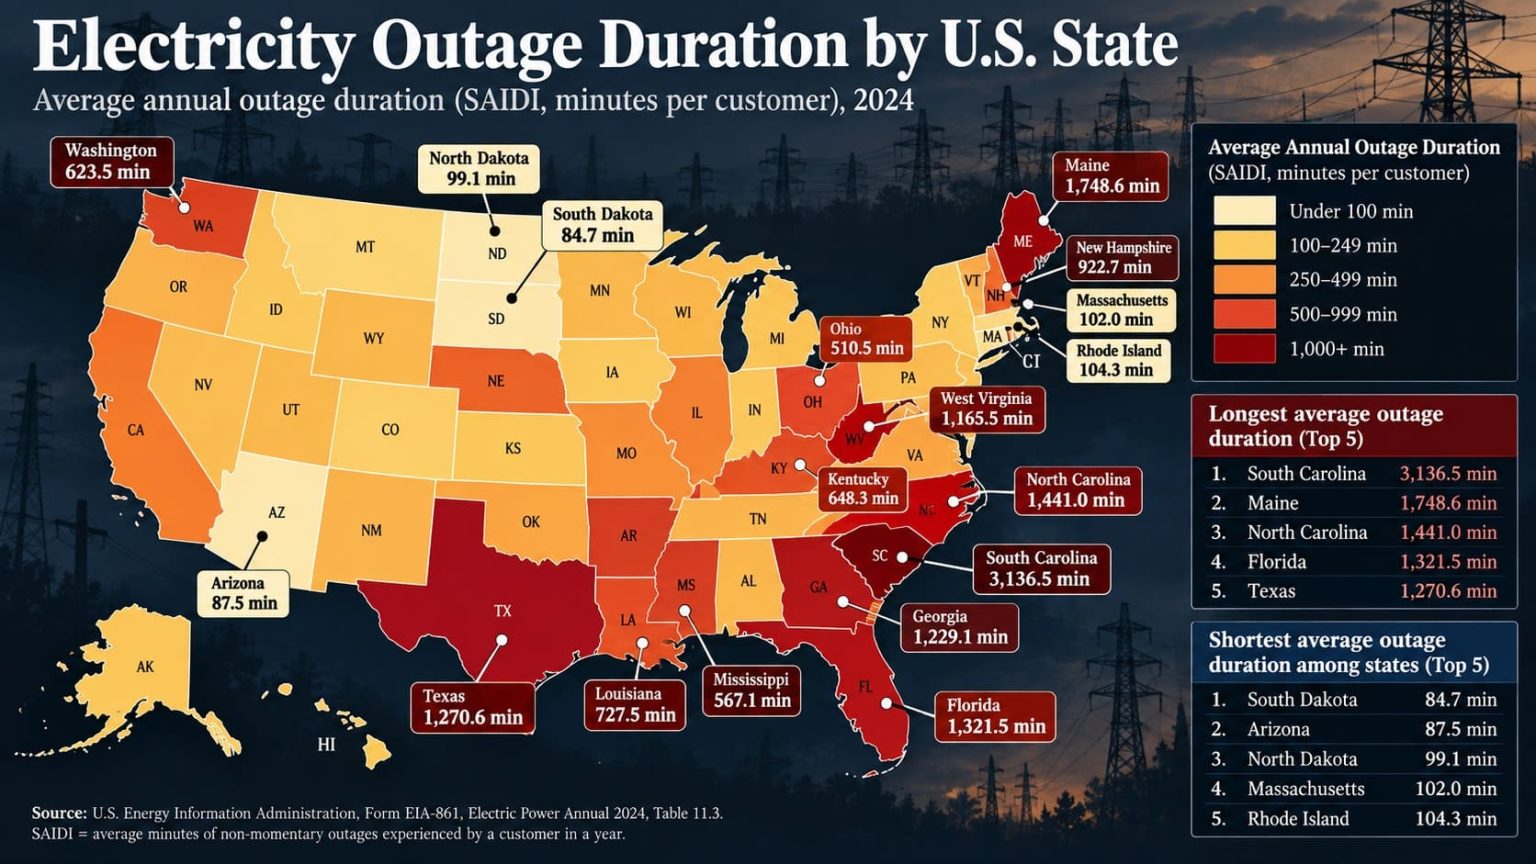
Which States Had the Most Power Outage Time in 2024?
South Carolina ranked first with 3,136.5 minutes (52.3 hours) of electricity interruptions per average customer in 2024. Maine followed at 1,748.6 minutes, then North Carolina at 1,441.0 minutes. South Dakota had the shortest duration among the states, at 84.7 minutes.
The ranking uses the System Average Interruption Duration Index (SAIDI), which measures annual minutes of non-momentary electricity interruptions per average customer. The source is the U.S. Energy Information Administration's Electric Power Annual, Table 11.3, using the all-events, any-method series. All 50 states are ranked from longest to shortest duration.
Data year: 2024. Unit: minutes per customer-year. Coverage: 50 states, excluding Washington, D.C. Status: 50 official published values; no modeled or forecast ranking entries. EIA edition released October 16, 2025; source retrieved October 14, 2026. Reporting coverage nationwide: 95.0% of customers under EIA's published measure.
South Carolina, rank 1. Equivalent to 52.3 hours.
South Dakota, rank 50. Equivalent to 1.4 hours.
EIA 2024; all 50 entries are official published values.
Calculated from 50 EIA observations, equivalent to 4.7 hours.
What SAIDI Measures — and What It Does Not
SAIDI adds the time customers spend without electricity across non-momentary interruptions during the year. It is not the length of one typical outage. That requires CAIDI, while SAIFI measures how frequently interruptions occur.
With major events
The main ranking includes interruptions attributed to major events. Florida, for example, recorded 1,321.5 minutes of all-event SAIDI in 2024, equivalent to 22.0 hours.
Without major events
Florida's separately published 2024 figure excluding major events was 66.4 minutes. The difference shows why it is important to distinguish the two reporting series. They are not mixed in the ranking.
National context: U.S. all-event SAIDI increased from 342.0 minutes in 2023 to 611.3 minutes in 2024. The 2024 value excluding major events was 126.0 minutes. The difference, 485.3 minutes, represents 79.4% of the all-event figure. The national aggregate includes Washington, D.C. and is not the same as the median of the 50 states.
Top 10 States With the Longest Annual Power Outages
South Carolina exceeded second-place Maine by 1,387.9 minutes (23.1 hours). Vermont, ranked tenth, had 696.7 minutes of interruption time per average customer.
| Rank | State | 2024 SAIDI | Region / source note |
|---|---|---|---|
| 1 | South Carolina | 3,136.5 min | South Atlantic; EIA 2024, official; excluding major events: 117.8 min. |
| 2 | Maine | 1,748.6 min | New England; EIA 2024, official; excluding major events: 274.0 min. |
| 3 | North Carolina | 1,441.0 min | South Atlantic; EIA 2024, official; excluding major events: 141.4 min. |
| 4 | Florida | 1,321.5 min | South Atlantic; EIA 2024, official; excluding major events: 66.4 min. |
| 5 | Texas | 1,270.6 min | West South Central; EIA 2024, official; excluding major events: 129.4 min. |
| 6 | Georgia | 1,229.1 min | South Atlantic; EIA 2024, official; excluding major events: 212.3 min. |
| 7 | West Virginia | 1,165.5 min | South Atlantic; EIA 2024, official; excluding major events: 486.1 min. |
| 8 | New Hampshire | 922.7 min | New England; EIA 2024, official; excluding major events: 132.3 min. |
| 9 | Louisiana | 727.5 min | West South Central; EIA 2024, official; excluding major events: 206.0 min. |
| 10 | Vermont | 696.7 min | New England; EIA 2024, official; excluding major events: 275.0 min. |
Source: EIA Electric Power Annual, Table 11.3, all events, any method. Values are published minutes per customer-year.
Chart: Top 20 States by Electricity Outage Duration
South Carolina represents 100% of the chart scale. Every other bar is proportional to that state's 2024 SAIDI divided by 3,136.5 minutes.
Chart unit: SAIDI minutes per customer-year. Bar widths are calculated from the same source values as the ranking and rounded to two decimal places.
Methodology and Reporting Limits
Metric and ranking direction
SAIDI measures annual non-momentary interruption minutes per average electricity customer. The ranking is descending: more minutes means a higher position, not more reliable electricity service.
Source, year and status
The numeric source is EIA Electric Power Annual, Table 11.3, Form EIA-861. All 50 state values are officially published observations from calendar year 2024. Their status is official_value. No ranking rows use calculated values, modeled projections or forecasts.
Reporting methods and major events
The selected series is Any Method, All Events. EIA combines IEEE and non-IEEE utility reporting methods in this series. Major-event classifications may differ by method. The separate IEEE-only series is not substituted into the ranking.
Coverage and exclusions
All 50 U.S. states are included; Washington, D.C. is excluded. The national reporting coverage was 95.0%. State coverage ranged from 73.7% in Nebraska to 103.1% in Nevada. EIA's coverage numerator and denominator come from different reporting measures, which can produce values above 100%.
Calculations
Hours = SAIDI minutes / 60. The 50-state median = (Kansas 285.6 + California 279.6) / 2 = 282.6 minutes. Annual change = 2024 SAIDI − 2023 SAIDI. Major-event-exclusion difference = all-event SAIDI − SAIDI without major events. Percentage difference = difference / all-event SAIDI × 100.
Across all 50 states, 28 changes are positive and 22 are negative. These are calculations from confirmed published observations, not forecasts.
Validation and limitations
Table 11.3 supplies state values and comparisons. EIA Table 11.1 validates national totals; Table 11.2 checks the method distinction. Different method populations are not averaged. Rankings use EIA's published minute values before rounding derived hours or percentages.
SAIDI does not measure outage frequency, a specific home's interruption experience, momentary interruptions or the duration of one individual blackout.
No 2024 state observations are missing from this ranking, and no historical values are substituted into the 2024 column. State-to-state comparisons should still account for reporting coverage and major-event classification differences.
Complete 2024 Electricity Outage Ranking: All 50 States
The table reports the official 2024 all-event SAIDI value for each state, with a 2023 comparison, the 2024 figure excluding major events and EIA reporting coverage. Original ranks remain unchanged when sorting or filtering.
The display limit is applied after sorting and filtering. Selecting "Fewest minutes first" and "First 10" displays the ten states with the lowest SAIDI, while the Rank column continues to show the original longest-first position.
Showing 50 of 50 states
| Rank | State | SAIDI 2024 | Region / source note |
|---|---|---|---|
| 1 | South Carolina | 3,136.5 min | South Atlantic; 2023: 167.2; excluding major: 117.8; coverage: 96.5%. EIA 2024, official, all events, any method. |
| 2 | Maine | 1,748.6 min | New England; 2023: 1,863.0; excluding major: 274.0; coverage: 100.3%. EIA 2024, official, all events, any method. |
| 3 | North Carolina | 1,441.0 min | South Atlantic; 2023: 252.0; excluding major: 141.4; coverage: 96.0%. EIA 2024, official, all events, any method. |
| 4 | Florida | 1,321.5 min | South Atlantic; 2023: 160.1; excluding major: 66.4; coverage: 100.4%. EIA 2024, official, all events, any method. |
| 5 | Texas | 1,270.6 min | West South Central; 2023: 496.2; excluding major: 129.4; coverage: 98.1%. EIA 2024, official, all events, any method. |
| 6 | Georgia | 1,229.1 min | South Atlantic; 2023: 349.2; excluding major: 212.3; coverage: 88.9%. EIA 2024, official, all events, any method. |
| 7 | West Virginia | 1,165.5 min | South Atlantic; 2023: 751.5; excluding major: 486.1; coverage: 97.3%. EIA 2024, official, all events, any method. |
| 8 | New Hampshire | 922.7 min | New England; 2023: 645.8; excluding major: 132.3; coverage: 99.2%. EIA 2024, official, all events, any method. |
| 9 | Louisiana | 727.5 min | West South Central; 2023: 584.2; excluding major: 206.0; coverage: 93.5%. EIA 2024, official, all events, any method. |
| 10 | Vermont | 696.7 min | New England; 2023: 744.4; excluding major: 275.0; coverage: 87.0%. EIA 2024, official, all events, any method. |
| 11 | Kentucky | 648.3 min | East South Central; 2023: 868.2; excluding major: 153.3; coverage: 96.5%. EIA 2024, official, all events, any method. |
| 12 | Nebraska | 641.7 min | West North Central; 2023: 72.6; excluding major: 73.6; coverage: 73.7%. EIA 2024, official, all events, any method. |
| 13 | Washington | 623.5 min | Pacific Contiguous; 2023: 151.7; excluding major: 158.6; coverage: 95.2%. EIA 2024, official, all events, any method. |
| 14 | Oregon | 591.0 min | Pacific Contiguous; 2023: 126.9; excluding major: 130.9; coverage: 93.0%. EIA 2024, official, all events, any method. |
| 15 | Mississippi | 567.1 min | East South Central; 2023: 802.1; excluding major: 266.3; coverage: 83.2%. EIA 2024, official, all events, any method. |
| 16 | Ohio | 510.5 min | East North Central; 2023: 366.2; excluding major: 133.2; coverage: 96.6%. EIA 2024, official, all events, any method. |
| 17 | Arkansas | 509.1 min | West South Central; 2023: 911.2; excluding major: 194.6; coverage: 89.2%. EIA 2024, official, all events, any method. |
| 18 | Michigan | 470.4 min | East North Central; 2023: 1,093.6; excluding major: 160.1; coverage: 97.5%. EIA 2024, official, all events, any method. |
| 19 | Virginia | 418.3 min | South Atlantic; 2023: 221.1; excluding major: 166.4; coverage: 96.4%. EIA 2024, official, all events, any method. |
| 20 | Montana | 351.5 min | Mountain; 2023: 118.7; excluding major: 156.6; coverage: 74.7%. EIA 2024, official, all events, any method. |
| 21 | Pennsylvania | 336.1 min | Middle Atlantic; 2023: 252.7; excluding major: 131.0; coverage: 94.5%. EIA 2024, official, all events, any method. |
| 22 | Alaska | 327.1 min | Pacific Noncontiguous; 2023: 374.8; excluding major: 192.4; coverage: 84.2%. EIA 2024, official, all events, any method. |
| 23 | Hawaii | 320.6 min | Pacific Noncontiguous; 2023: 491.8; excluding major: 225.6; coverage: 99.9%. EIA 2024, official, all events, any method. |
| 24 | Indiana | 312.4 min | East North Central; 2023: 455.4; excluding major: 121.4; coverage: 92.0%. EIA 2024, official, all events, any method. |
| 25 | Kansas | 285.6 min | West North Central; 2023: 283.1; excluding major: 103.6; coverage: 82.4%. EIA 2024, official, all events, any method. |
| 26 | California | 279.6 min | Pacific Contiguous; 2023: 346.6; excluding major: 158.2; coverage: 100.0%. EIA 2024, official, all events, any method. |
| 27 | Alabama | 279.4 min | East South Central; 2023: 294.2; excluding major: 117.8; coverage: 80.7%. EIA 2024, official, all events, any method. |
| 28 | New Mexico | 278.8 min | Mountain; 2023: 168.9; excluding major: 156.5; coverage: 90.1%. EIA 2024, official, all events, any method. |
| 29 | Tennessee | 278.6 min | East South Central; 2023: 857.9; excluding major: 159.5; coverage: 85.9%. EIA 2024, official, all events, any method. |
| 30 | Oklahoma | 270.9 min | West South Central; 2023: 896.6; excluding major: 119.6; coverage: 90.6%. EIA 2024, official, all events, any method. |
| 31 | Wisconsin | 266.1 min | East North Central; 2023: 183.0; excluding major: 91.3; coverage: 92.3%. EIA 2024, official, all events, any method. |
| 32 | Colorado | 255.1 min | Mountain; 2023: 99.2; excluding major: 119.0; coverage: 93.7%. EIA 2024, official, all events, any method. |
| 33 | Idaho | 232.8 min | Mountain; 2023: 137.5; excluding major: 174.0; coverage: 95.1%. EIA 2024, official, all events, any method. |
| 34 | Missouri | 224.3 min | West North Central; 2023: 371.8; excluding major: 106.0; coverage: 86.7%. EIA 2024, official, all events, any method. |
| 35 | New York | 219.9 min | Middle Atlantic; 2023: 120.0; excluding major: 72.0; coverage: 98.2%. EIA 2024, official, all events, any method. |
| 36 | Minnesota | 219.6 min | West North Central; 2023: 126.4; excluding major: 92.2; coverage: 89.0%. EIA 2024, official, all events, any method. |
| 37 | New Jersey | 174.2 min | Middle Atlantic; 2023: 108.3; excluding major: 99.7; coverage: 100.9%. EIA 2024, official, all events, any method. |
| 38 | Iowa | 166.7 min | West North Central; 2023: 104.9; excluding major: 89.8; coverage: 85.4%. EIA 2024, official, all events, any method. |
| 39 | Nevada | 158.9 min | Mountain; 2023: 138.7; excluding major: 63.8; coverage: 103.1%. EIA 2024, official, all events, any method. |
| 40 | Illinois | 156.9 min | East North Central; 2023: 208.2; excluding major: 59.4; coverage: 98.1%. EIA 2024, official, all events, any method. |
| 41 | Connecticut | 153.6 min | New England; 2023: 164.6; excluding major: 73.1; coverage: 101.2%. EIA 2024, official, all events, any method. |
| 42 | Wyoming | 137.8 min | Mountain; 2023: 127.0; excluding major: 109.1; coverage: 76.0%. EIA 2024, official, all events, any method. |
| 43 | Utah | 119.8 min | Mountain; 2023: 127.1; excluding major: 106.7; coverage: 88.3%. EIA 2024, official, all events, any method. |
| 44 | Maryland | 118.1 min | South Atlantic; 2023: 166.2; excluding major: 75.1; coverage: 98.6%. EIA 2024, official, all events, any method. |
| 45 | Delaware | 116.1 min | South Atlantic; 2023: 108.2; excluding major: 65.9; coverage: 89.1%. EIA 2024, official, all events, any method. |
| 46 | Rhode Island | 104.3 min | New England; 2023: 104.6; excluding major: 60.8; coverage: 97.6%. EIA 2024, official, all events, any method. |
| 47 | Massachusetts | 102.0 min | New England; 2023: 259.4; excluding major: 76.1; coverage: 92.3%. EIA 2024, official, all events, any method. |
| 48 | North Dakota | 99.1 min | West North Central; 2023: 208.6; excluding major: 84.2; coverage: 88.5%. EIA 2024, official, all events, any method. |
| 49 | Arizona | 87.5 min | Mountain; 2023: 106.8; excluding major: 72.0; coverage: 96.6%. EIA 2024, official, all events, any method. |
| 50 | South Dakota | 84.7 min | West North Central; 2023: 77.0; excluding major: 62.1; coverage: 75.4%. EIA 2024, official, all events, any method. |
All 50 rows use EIA Table 11.3, 2024, all events, any method. The 2023 and excluding-major-event values are provided for comparison only. All numeric figures in the ranking are official published values.
Four Findings From the 2024 Outage Data
Key Insight
The median of the 50 state values was 282.6 minutes. Yet 13 states, or 26% of the ranking, exceeded the separate EIA national aggregate of 611.3 minutes. The median gives every state equal weight, unlike the national customer-based aggregate.
Notable Pattern
From 2023 to 2024, all-event SAIDI increased in 28 states and decreased in 22. South Carolina had the greatest increase, +2,969.3 minutes, while Oklahoma had the greatest decrease, −625.7 minutes. These changes describe the observed data, not their causes.
Regional Concentration
Five of the ten highest-ranked states belong to EIA's South Atlantic division: South Carolina (#1), North Carolina (#3), Florida (#4), Georgia (#6) and West Virginia (#7). They represent 50% of the Top 10 and five of the division's eight states when Washington, D.C. is excluded.
Outlier
Nebraska rose from 72.6 minutes in 2023 to 641.7 in 2024, a 569.1-minute increase. Its 2024 SAIDI excluding major events was just 73.6 minutes. Nebraska also had the lowest reporting coverage among states, at 73.7%, which limits how broadly its annual value can be interpreted.
How to Interpret a State's Outage Record
Texas recorded 1,270.6 all-event SAIDI minutes in 2024. For the average reported customer, this represents approximately 21.2 hours of non-momentary electricity interruptions accumulated across the year. Excluding major events, Texas reported 129.4 minutes. The difference matters when comparing an unusual year with more routine service interruptions.
A statewide annual figure cannot predict outage conditions at a particular address. Before evaluating local electricity reliability, compare several years of data for the relevant utility. SAIDI alone does not show the number of outages, the duration of one particular interruption, or whether one neighborhood was affected more severely than another.
Frequently Asked Questions
Which state had the longest average power outage duration in 2024?
South Carolina ranked first with 3,136.5 SAIDI minutes per average customer, equivalent to 52.3 hours accumulated over the year. Maine ranked second and North Carolina third.
Which state recorded the shortest outage duration?
South Dakota had the lowest all-event SAIDI among the 50 states at 84.7 minutes. Washington, D.C. recorded 32.6 minutes separately but is excluded because it is not a state.
Does SAIDI measure the length of one power outage?
No. SAIDI measures total annual interruption time per average customer. CAIDI measures average restoration duration per sustained interruption, while SAIFI measures interruption frequency.
Are hurricanes and other major events included?
Yes. The ranking uses EIA's all-event SAIDI series. The main table also shows the corresponding value excluding major events for each state.
Why did Nebraska's outage duration increase in 2024?
EIA reports an increase from 72.6 minutes in 2023 to 641.7 minutes in 2024. Its 2024 figure excluding major events was 73.6 minutes. These figures show a substantial difference but cannot, by themselves, establish which specific incidents caused it.
Why is the national SAIDI figure different from the state median?
EIA's national figure is based on reported customer data and includes Washington, D.C. The 50-state median is the midpoint between the 25th and 26th state observations, giving each state one position regardless of population.
Are these figures forecasts for 2025 or 2026?
No. All 50 ranking values are official observations for 2024. Derived statistics use published 2023 and 2024 inputs, with no modeled projections.
Why can electricity reporting coverage exceed 100%?
EIA calculates coverage using reliability-report meters and a separate sales-customer count. These denominators can differ, allowing values above 100%. Nevada's 2024 coverage was 103.1%.
Sources
The ranking uses one official numeric publisher: the U.S. Energy Information Administration. Other EIA publications serve validation, methodological or contextual roles rather than independent sources of ranking values.
EIA Electric Power Annual — Table 11.3
Official 2024 state SAIDI values, 2023 comparisons, figures excluding major events, geographic divisions and reporting coverage.
https://www.eia.gov/electricity/annual/table.php?t=epa_11_03.htmlEIA Electric Power Annual — Table 11.1
National SAIDI totals used for comparison and validation. Not used to replace state ranking values.
https://www.eia.gov/electricity/annual/table.php?t=epa_11_01.htmlEIA Form EIA-861
Utility reporting framework, survey data and reliability measurement definitions.
https://www.eia.gov/electricity/data/eia861/EIA Electric Power Annual — Table 11.2
IEEE-only reliability data used to distinguish reporting methodologies. Not combined with the any-method ranking.
https://www.eia.gov/electricity/annual/table.php?t=epa_11_02.htmlEIA Today in Energy — December 1, 2025
Official context on the effects of major weather events on U.S. power outages in 2024. Not used as a replacement numeric dataset.
https://www.eia.gov/todayinenergy/detail.php?id=66744Download the Electricity Outage Duration by U.S. State: 2024 Ranking dataset
Electricity Outage Duration by U.S. State: 2024 Ranking
50 ranked entries · Excel + CSV + methodology + sources + chart · Snapshot: 2024 EIA SAIDI by state; compiled archive 2026-10-15 · Version 1.0
The archive includes machine-readable data, methodology and source documentation. Quick human verification is required before the ZIP is delivered. Full Data Pack downloads require a free account. Free accounts can download 1 different Data Pack every 30 days; re-downloading the same pack does not use another slot. Annual Data Access provides unlimited manual downloads while annual access is active.
Download Excel + CSV Data PackRelated rankings
Closely related StatRanker ranking and data pages selected by topic, entity scope and category. Fewer links are shown when strong matches are limited.
