

Highest-Paying U.S. States for Registered Nurses: 2025 Salary Ranking
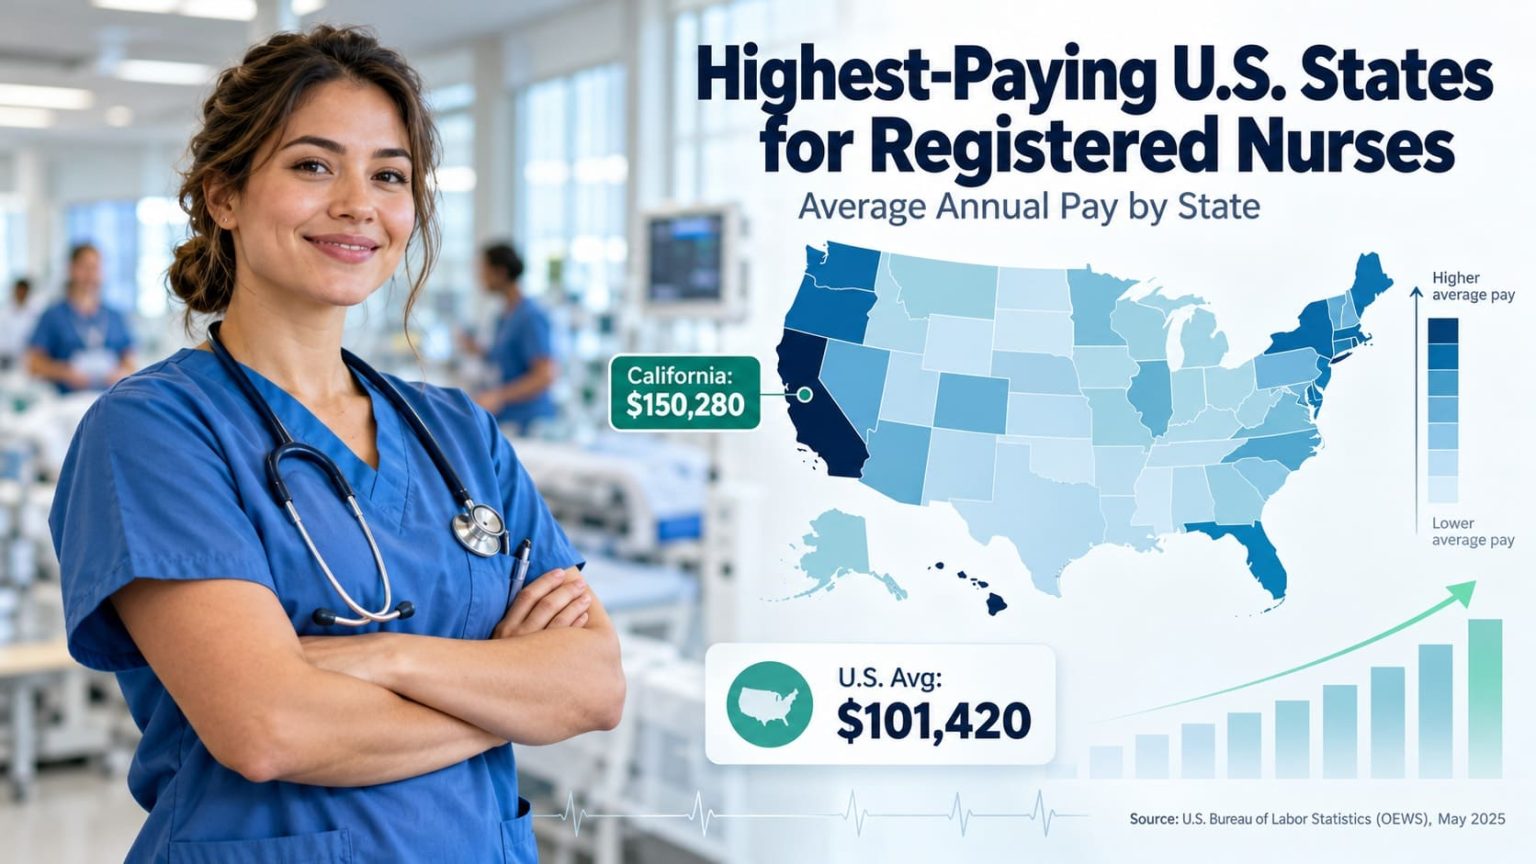
Highest-Paying U.S. States for Registered Nurses: 2025 Ranking
Metric: annual median wage for Registered Nurses (SOC 29-1141). Coverage: 50 states plus Washington, D.C. (51 jurisdictions). Source: U.S. Bureau of Labor Statistics, Occupational Employment and Wage Statistics (OEWS), May 2025. Unit: nominal U.S. dollars per year. Direction: highest to lowest. Data status: 51 official_value; 0 calculated wage rows; 0 forecasts or projections. Source reference access date: October 24, 2026.
California leads with a $140,270 annual median, ahead of Hawaii ($136,320) and Oregon ($129,010). Alabama is last among the 51 jurisdictions at $77,080. The May 2025 estimates were published on May 15, 2026; this is a ranking of 2025 wage estimates, not a forecast of 2026 salaries.
California, rank 1; official BLS wage estimate.
Alabama, rank 51; official BLS wage estimate.
All 50 states and D.C.; all 51 rows official_value.
StatRanker-calculated from 51 state/DC values, unweighted; not the U.S. nurse median.
Overview: where registered nurse median pay is highest
The national median annual wage for registered nurses in May 2025 was $97,550, according to BLS. Only 18 of the 51 state/DC median wages in this ranking exceed that national benchmark. This does not mean only 18 areas have nurses earning more than $97,550: each row describes the midpoint of an entire area's RN wage distribution.
The distribution is uneven. The top four jurisdictions pay medians of at least $124,200, while the fifth, Alaska, sits at $109,480. The West accounts for six of the ten highest-paying states; all four remaining Top 10 positions belong to the Northeast, using U.S. Census geographic regions.
A median is the point at which half of wage-and-salary RN workers in the area earn more and half earn less. It is not the mean, a guaranteed job offer, an overtime-inclusive paycheck or a cost-of-living-adjusted figure. Statewide results also hide differences between cities, hospitals, employers and nursing specialties.
Top 10 highest-paying states for registered nurses in 2025
Rankings are recalculated from the published annual median wage values, in descending order. Washington, D.C., is included in the full 51-area table but does not enter the Top 10.
Annual median wages (USD), BLS OEWS May 2025; single official numeric source
| Rank | State / area | Annual median | Region / source note |
|---|---|---|---|
| 1 | California | $140,270 | West; BLS OEWS May 2025; official_value; SOC 29-1141. |
| 2 | Hawaii | $136,320 | West; BLS OEWS May 2025; official_value; SOC 29-1141. |
| 3 | Oregon | $129,010 | West; BLS OEWS May 2025; official_value; SOC 29-1141. |
| 4 | Washington | $124,200 | West; BLS OEWS May 2025; official_value; SOC 29-1141. |
| 5 | Alaska | $109,480 | West; BLS OEWS May 2025; official_value; SOC 29-1141. |
| 6 | New York | $109,440 | Northeast; BLS OEWS May 2025; official_value; SOC 29-1141. |
| 7 | New Jersey | $106,500 | Northeast; BLS OEWS May 2025; official_value; SOC 29-1141. |
| 8 | Massachusetts | $104,550 | Northeast; BLS OEWS May 2025; official_value; SOC 29-1141. |
| 9 | Nevada | $103,670 | West; BLS OEWS May 2025; official_value; SOC 29-1141. |
| 10 | Connecticut | $102,740 | Northeast; BLS OEWS May 2025; official_value; SOC 29-1141. |
Status on every row: official_value. The median annual wage is a BLS-published statistical estimate, not a StatRanker projection.
Chart: Top 20 U.S. jurisdictions by RN median annual wage
Bars represent the same unrounded-to-display BLS dollar values as the tables, scaled to California at 100%. This is a nominal-pay comparison, not a purchasing-power ranking.
StatRanker calculation from confirmed rows: the average of the Top 10 state medians is $116,618, versus $79,125 for the bottom ten—a difference of $37,493. These are unweighted averages of area medians, not mean salaries earned by individual nurses.
Methodology and comparability
Definition and unit
Registered Nurses, Standard Occupational Classification 29-1141; BLS annual median wage, in nominal U.S. dollars. Larger medians rank higher. The values are BLS wage-and-salary estimates, not average annual earnings.
Release and status
Reference period: May 2025; BLS release: May 15, 2026; online source references checked: October 24, 2026. All 51 ranked wage values are official_value. No missing 2025 state/DC medians are filled, no inflation forecast is made and no earlier-year rows are mixed in.
Scope and exclusions
Includes exactly 50 states and the District of Columbia. Excludes Puerto Rico, Guam, the U.S. Virgin Islands, national totals, counties, metropolitan areas and other nursing occupations such as LPNs, nursing assistants and nurse practitioners.
Region grouping
West (13), Northeast (9), Midwest (12), South (17), as defined by U.S. Census geographic regions. D.C. belongs to South. Region is an analytical label, not an alternative wage source.
Published measures versus page calculations
The 51 wages come from the BLS OEWS May 2025 state series and are treated as official published statistical estimates. Ranks, gaps, percentages, regional counts and summaries are StatRanker calculations on those confirmed inputs. Ranking uses the dollar figures shown, not a copied external ordering. Dollar figures in this ranking are displayed to the same $10 precision as the published medians; percentages are rounded to one decimal place.
Wage definition and interpretation limits
OEWS is an employer survey of wage-and-salary jobs. It covers straight-time gross pay including some allowances and incentive pay, but excludes overtime, shift differentials, employer-paid benefits and some additional compensation. Estimates are statistical rather than an exact census of every nurse. Hourly-paid occupations' annual wages are generally annualized using a 2,080-hour work year under BLS rules.
The estimates are not adjusted for tax, rent, prices, hours actually worked, nursing experience, metropolitan concentration or workplace. A median in a high-cost state cannot be read as a higher standard of living. The national $97,550 median is a worker-level national distribution measure; the $93,600 median of 51 area medians on this page is an unweighted StatRanker statistic and must not replace the official national median.
Primary dataset, extraction fields and reproducibility
The primary numeric series is the BLS May 2025 state OEWS release. Its downloadable state archive is oesm25st.zip, containing state_M2025_dl.xlsx. A direct workbook-based check selects the all-industries (NAICS 000000), all-ownership statewide records where OCC_CODE = 29-1141 and reads A_MEDIAN, the published median annual wage. Match the state code or name to precisely 50 states and the District of Columbia; omit U.S. territories and any national or substate entries. The original release, not the order of a secondary ranking, determines which wage belongs to each jurisdiction.
State-by-state government validation: All 51 HTML annual median amounts were compared with the 2025 Annual Median (50%) values in the U.S. Department of Labor's O*NET OnLine state wage tables for Registered Nurses (29-1141.00). Vermont was additionally verified in the government CareerOneStop Salary Finder and the O*NET Vermont statewide figure displayed through its ZIP-based local wages view. Result: 51 of 51 values matched; zero discrepancies. O*NET and CareerOneStop republish BLS wage data; they are authoritative government validation views of the same underlying survey, not additional independent wage surveys. The direct BLS ZIP remains linked in Sources for reproducibility, but its original XLSX was not downloaded or checksum-audited for this edition. No claim of a direct workbook or byte-level comparison is made.
Source priority, missing values and change control
BLS is the single authoritative numeric publisher. O*NET, CareerOneStop and Becker's are validation presentations of the same BLS 2025 wage estimates and do not increase the independent numeric publisher count above one. If a BLS record and a secondary presentation disagree, retain the verified original BLS value and document the discrepancy; never average the two. No row is interpolated from an earlier year, estimated from hourly pay or changed to fit a published rank order. All 51 displayed values are labeled official_value because they are reported as BLS May 2025 wage estimates; StatRanker-generated comparisons are identified separately and are not official BLS measures. The current edition has no missing or stale-year rows. An updated BLS release would require another documented comparison before changing figures.
Wage survey design and remaining limitations
The OEWS wage estimates are based on employer survey samples across multiple semiannual panels rather than a full census of individual paychecks. Estimates can be revised; sampling error, employment mix, geographic variation and rounding constrain comparisons between close neighbors such as Alaska and New York (a $40 difference). Census supplies the region definitions only. Neither Becker's nor CareerOneStop represents an independently measured alternative to BLS OEWS.
Main ranking: all 50 states and Washington, D.C.
Search by place, filter by U.S. region or data status, sort the existing rows, or restrict the view to the original Top 10 or Top 20. All 51 rows remain visible without JavaScript.
Showing 51 of 51 jurisdictions.
May 2025 BLS OEWS annual median wages for SOC 29-1141; 51 official_value rows; nominal USD
| Rank | State / area | Annual median | Region / source note |
|---|---|---|---|
| 1 | California | $140,270 | West; BLS OEWS May 2025; official_value; SOC 29-1141. |
| 2 | Hawaii | $136,320 | West; BLS OEWS May 2025; official_value; SOC 29-1141. |
| 3 | Oregon | $129,010 | West; BLS OEWS May 2025; official_value; SOC 29-1141. |
| 4 | Washington | $124,200 | West; BLS OEWS May 2025; official_value; SOC 29-1141. |
| 5 | Alaska | $109,480 | West; BLS OEWS May 2025; official_value; SOC 29-1141. |
| 6 | New York | $109,440 | Northeast; BLS OEWS May 2025; official_value; SOC 29-1141. |
| 7 | New Jersey | $106,500 | Northeast; BLS OEWS May 2025; official_value; SOC 29-1141. |
| 8 | Massachusetts | $104,550 | Northeast; BLS OEWS May 2025; official_value; SOC 29-1141. |
| 9 | Nevada | $103,670 | West; BLS OEWS May 2025; official_value; SOC 29-1141. |
| 10 | Connecticut | $102,740 | Northeast; BLS OEWS May 2025; official_value; SOC 29-1141. |
| 11 | District of Columbia | $102,540 | South; BLS OEWS May 2025; official_value; SOC 29-1141. |
| 12 | Minnesota | $101,510 | Midwest; BLS OEWS May 2025; official_value; SOC 29-1141. |
| 13 | Rhode Island | $100,640 | Northeast; BLS OEWS May 2025; official_value; SOC 29-1141. |
| 14 | Colorado | $100,260 | West; BLS OEWS May 2025; official_value; SOC 29-1141. |
| 15 | Maryland | $99,790 | South; BLS OEWS May 2025; official_value; SOC 29-1141. |
| 16 | New Hampshire | $99,700 | Northeast; BLS OEWS May 2025; official_value; SOC 29-1141. |
| 17 | Delaware | $99,520 | South; BLS OEWS May 2025; official_value; SOC 29-1141. |
| 18 | Arizona | $99,500 | West; BLS OEWS May 2025; official_value; SOC 29-1141. |
| 19 | Vermont | $97,460 | Northeast; BLS OEWS May 2025; official_value; SOC 29-1141. |
| 20 | Pennsylvania | $96,430 | Northeast; BLS OEWS May 2025; official_value; SOC 29-1141. |
| 21 | Illinois | $95,990 | Midwest; BLS OEWS May 2025; official_value; SOC 29-1141. |
| 22 | Texas | $95,970 | South; BLS OEWS May 2025; official_value; SOC 29-1141. |
| 23 | Wisconsin | $95,530 | Midwest; BLS OEWS May 2025; official_value; SOC 29-1141. |
| 24 | New Mexico | $94,340 | West; BLS OEWS May 2025; official_value; SOC 29-1141. |
| 25 | Michigan | $94,300 | Midwest; BLS OEWS May 2025; official_value; SOC 29-1141. |
| 26 | Virginia | $93,600 | South; BLS OEWS May 2025; official_value; SOC 29-1141. |
| 27 | Georgia | $93,550 | South; BLS OEWS May 2025; official_value; SOC 29-1141. |
| 28 | Idaho | $92,460 | West; BLS OEWS May 2025; official_value; SOC 29-1141. |
| 29 | Maine | $86,990 | Northeast; BLS OEWS May 2025; official_value; SOC 29-1141. |
| 30 | Montana | $85,280 | West; BLS OEWS May 2025; official_value; SOC 29-1141. |
| 31 | Nebraska | $84,730 | Midwest; BLS OEWS May 2025; official_value; SOC 29-1141. |
| 32 | Utah | $84,600 | West; BLS OEWS May 2025; official_value; SOC 29-1141. |
| 33 | North Carolina | $84,350 | South; BLS OEWS May 2025; official_value; SOC 29-1141. |
| 34 | Florida | $84,190 | South; BLS OEWS May 2025; official_value; SOC 29-1141. |
| 35 | Wyoming | $83,760 | West; BLS OEWS May 2025; official_value; SOC 29-1141. |
| 36 | Indiana | $83,500 | Midwest; BLS OEWS May 2025; official_value; SOC 29-1141. |
| 37 | Oklahoma | $82,920 | South; BLS OEWS May 2025; official_value; SOC 29-1141. |
| 38 | Ohio | $82,510 | Midwest; BLS OEWS May 2025; official_value; SOC 29-1141. |
| 39 | South Carolina | $82,360 | South; BLS OEWS May 2025; official_value; SOC 29-1141. |
| 40 | Missouri | $81,780 | Midwest; BLS OEWS May 2025; official_value; SOC 29-1141. |
| 41 | Tennessee | $81,500 | South; BLS OEWS May 2025; official_value; SOC 29-1141. |
| 42 | Kentucky | $81,040 | South; BLS OEWS May 2025; official_value; SOC 29-1141. |
| 43 | North Dakota | $80,730 | Midwest; BLS OEWS May 2025; official_value; SOC 29-1141. |
| 44 | Louisiana | $80,230 | South; BLS OEWS May 2025; official_value; SOC 29-1141. |
| 45 | West Virginia | $80,130 | South; BLS OEWS May 2025; official_value; SOC 29-1141. |
| 46 | Kansas | $79,320 | Midwest; BLS OEWS May 2025; official_value; SOC 29-1141. |
| 47 | Arkansas | $78,940 | South; BLS OEWS May 2025; official_value; SOC 29-1141. |
| 48 | Iowa | $78,630 | Midwest; BLS OEWS May 2025; official_value; SOC 29-1141. |
| 49 | South Dakota | $78,060 | Midwest; BLS OEWS May 2025; official_value; SOC 29-1141. |
| 50 | Mississippi | $77,090 | South; BLS OEWS May 2025; official_value; SOC 29-1141. |
| 51 | Alabama | $77,080 | South; BLS OEWS May 2025; official_value; SOC 29-1141. |
Source notes identify the official BLS May 2025 estimate for each area; the status is not a salary prediction. D.C. is a federal district, shown separately from the 50 states.
Four findings from the 51-jurisdiction ranking
Key Insight: an 82% span
California's median of $140,270 is $63,190 above Alabama's $77,080, a gap of 82.0% measured against Alabama. The highest area median is approximately 1.82 times the lowest.
Notable Pattern: national benchmark
Just 18 of 51 jurisdiction medians (35.3%) exceed the official national RN median of $97,550. Vermont at rank 19 ($97,460) is $90 below that benchmark, immediately after Arizona at rank 18 ($99,500).
Regional Concentration: West and Northeast
The West accounts for 6 of the Top 10 places (60%): California, Hawaii, Oregon, Washington, Alaska and Nevada. The remaining four are Northeast states; neither the Midwest nor the South appears in the Top 10.
Outlier: the fourth-to-fifth drop
Washington (4th, $124,200) is $14,720 above Alaska (5th, $109,480). By contrast Alaska and New York (6th, $109,440) are separated by only $40, making their adjacent ranks particularly close.
What the wage ranking tells a registered nurse
California and Hawaii lead on nominal statewide median pay, but that midpoint is not an individual job offer. New York's statewide figure, for example, should not be treated as the expected wage at a specific New York City hospital or an upstate employer: both are included in a statewide distribution, while job setting, experience and local employment mix can differ.
The statewide comparison is most useful as a screening tool. Compare metro-area medians before choosing a city, then review the actual employer, scheduled hours, shift differentials, licensing rules, living costs and take-home pay. StatRanker's companion RN metropolitan-area ranking addresses a different geographic scale and is listed under Further reading in Sources.
The national RN median ($97,550) describes the wage distribution of workers nationally. The site's $93,600 median of 51 jurisdiction medians gives every jurisdiction equal weight, regardless of RN employment, and should never be interpreted as the median wage of a U.S. nurse.
Frequently asked questions
What was the highest-paying state for registered nurses in 2025?
California ranks first by BLS annual median wage for Registered Nurses (SOC 29-1141), at $140,270 in May 2025. Hawaii is second ($136,320); Oregon is third ($129,010).
Why does a 2025 ranking refer to a 2026 publication?
The reference period is May 2025, and BLS released those estimates on May 15, 2026. The year in the title describes the underlying wage data, not the page's publication year.
Is this the average RN salary or median salary?
The ranking uses the median annual wage, not the arithmetic mean. The nationwide BLS median was $97,550; the published national mean was $101,420. The two statistics answer different questions and should not be mixed within one rank list.
Does Washington, D.C., count as a state here?
No. The ranking covers 50 states plus the District of Columbia as a separate jurisdiction. D.C. ranks 11th at $102,540. Puerto Rico and other U.S. territories are excluded for geographic consistency.
Do higher wage figures mean better purchasing power?
Not necessarily. These are nominal, pre-tax wage estimates. They are not adjusted for housing prices, local costs, taxes, overtime, benefits or actual job-offer terms.
Are all 51 salary figures officially published, or estimated by the site?
All 51 ranked wages are BLS-published statistical estimates with status official_value. The site independently calculates ranks, gaps, jurisdiction counts and comparisons. No state wage is forecast, imputed or extrapolated.
How is the $93,600 median of area medians calculated?
Sort the 51 published state/DC median wages from lowest to highest and select the 26th observation. That equals Virginia's $93,600. It is an unweighted median of jurisdiction medians and should not be confused with BLS's $97,550 national median across workers.
Which nursing jobs are included?
Only the BLS Registered Nurses occupation (SOC 29-1141). Nurse practitioners, nurse anesthetists, licensed practical/vocational nurses and nursing assistants have separate occupational classifications and are not mixed into this ranking.
How can I independently check a state salary against the original dataset?
In Sources, use the U.S. Department of Labor O*NET OnLine state wage selector, choose Registered Nurses (29-1141.00) and compare the 2025 Annual Median (50%) for the state. To verify the original publication, use the official BLS state XLSX archive and its A_MEDIAN field for OCC_CODE 29-1141. Never substitute A_MEAN, hourly median or metro wages.
Sources and their roles
U.S. Bureau of Labor Statistics — state OEWS, May 2025
numeric_source · primary, officialAuthoritative numeric publisher for the 51 state/DC annual median wage estimates (SOC 29-1141; May 2025). The state index provides the original survey release and the archive enables direct A_MEDIAN extraction; the present review cross-checked displayed values via government wage tables rather than claiming a direct ZIP checksum audit.
https://www.bls.gov/oes/2025/may/oessrcst.htm
https://www.bls.gov/oes/tables.htm
Primary downloadable May 2025 state XLSX archive: https://www.bls.gov/oes/special-requests/oesm25st.zip
Use state_M2025_dl.xlsx, field A_MEDIAN, OCC_CODE 29-1141 and all-industry/all-ownership statewide records for direct verification.
U.S. Department of Labor — O*NET OnLine, RN state wage tables
validation_source · government, BLS-derived; all 51 jurisdictions reviewedRow-level verification of the 2025 annual median (50th percentile) for Registered Nurses, occupation 29-1141.00. The 51 statewide annual medians matched the ranking exactly. Select each state in the State Wages control; do not use metropolitan-area values or hourly medians. O*NET uses the same BLS wage estimates, so it is a validation presentation, not an independent survey.
Occupation page and state selector: https://www.onetonline.org/link/details/29-1141.00
Direct state verification examples: https://www.onetonline.org/link/localwages/29-1141.00?st=CA and https://www.onetonline.org/link/localwages/29-1141.00?st=DC
Vermont statewide value is also shown in the O*NET ZIP-locality view: https://www.onetonline.org/link/localwages/29-1141.00?zip=05150
BLS — Occupational Employment and Wages, May 2025
methodology_source · officialOccupation scope, wage definition, survey design, national RN mean wage and release background. Same publishing organization as the numeric source, not an independent dataset.
https://www.bls.gov/news.release/ocwage.htm
OEWS survey coverage, six-panel design and model-based estimation: https://www.bls.gov/oes/oes_emp.htm
BLS — Registered Nurses, Occupational Outlook Handbook
context_source · officialRN occupation description and May 2025 national median wage benchmark. The national benchmark is not included among the 51 state ranks.
https://www.bls.gov/ooh/healthcare/Print/registered-nurses.htm
U.S. Census Bureau — Regions and Divisions
methodology_source · geographyDefinitions for Northeast, Midwest, South and West, used solely for the regional filter and concentration analysis.
https://www.census.gov/programs-surveys/economic-census/guidance-geographies/levels.html
U.S. Department of Labor — CareerOneStop Salary Finder
validation_source · government, BLS-derivedGovernment secondary confirmation of 2025 RN annual median wages, including Oregon and Vermont. For every area, compare the Yearly / Median entry, not hourly, mean, or metro-area wages. This Department of Labor service draws on BLS OEWS and is not an independent wage survey.
StatRanker — Highest-Paying U.S. Metro Areas for Registered Nurses
context_source · further reading, geographyRelated ranking of metropolitan areas, rather than states, using the same RN occupation and annual-median metric. Not used to determine or validate state wage values.
Becker's Hospital Review — RN median pay by state
validation_source · secondarySecondary editorial cross-reference only. The May 2025 salary figures are a republication of BLS statistics, not an independent survey. Ranking order and all 51 official values were checked separately against government wage tables, rather than relying on this secondary table.
https://www.beckershospitalreview.com/compensation-issues/rn-median-pay-by-state/
Download the Highest-Paying U.S. States for Registered Nurses: 2025 Salary Ranking dataset
Highest-Paying U.S. States for Registered Nurses: 2025 Salary Ranking
51 ranked entries · Excel + CSV + methodology + sources + chart · Snapshot: BLS May 2025 OEWS Registered Nurses SOC 29-1141 annual median wages · Version 1.0
The archive includes machine-readable data, methodology and source documentation. Quick human verification is required before the ZIP is delivered. Full Data Pack downloads require a free account. Free accounts can download 1 different Data Pack every 30 days; re-downloading the same pack does not use another slot. Annual Data Access provides unlimited manual downloads while annual access is active.
Download Excel + CSV Data PackRelated rankings
Closely related StatRanker ranking and data pages selected by topic, entity scope and category. Fewer links are shown when strong matches are limited.
