

Homelessness Rate by U.S. State (2025): HUD PIT Ranking
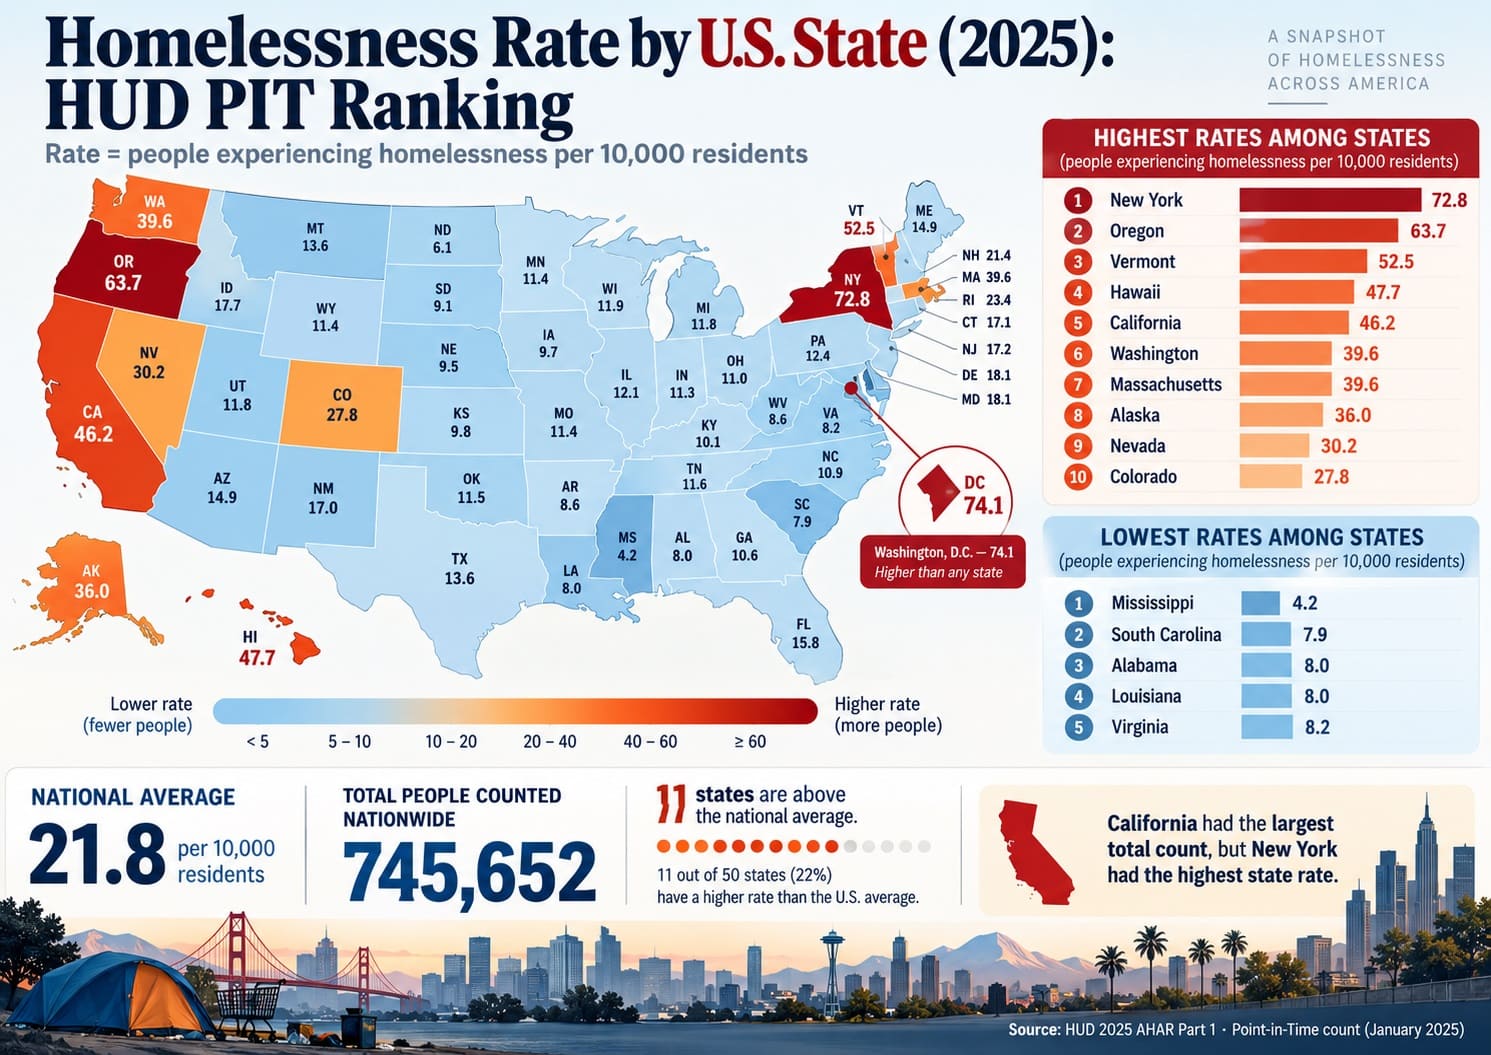
Which Jurisdictions Had the Highest PIT Homelessness Rates in 2025?
Washington, D.C. has the highest calculated homelessness rate in the January 2025 HUD Point-in-Time (PIT) count: 74.1 people per 10,000 residents. Among the 50 states, New York leads at 72.8, followed by Oregon at 63.7; Mississippi has the lowest rate at 4.2.
The ranking covers 50 states and Washington, D.C., in descending order. Rates per 10,000 are StatRanker calculations: each jurisdiction's HUD January 2025 sheltered-plus-unsheltered PIT count divided by its Census Bureau July 1, 2025 resident population, multiplied by 10,000. HUD publishes the count; it does not publish the rate calculated here. These are calculations from observed inputs, not forecasts or projections.
PIT and population reference year: 2025 · HUD AHAR release: May 2026 · Data retrieved: October 19, 2026 · Coverage: 51 jurisdictions · Rate status: 51 calculated_value, 0 official_value, 0 forecasts/projections. The table is a compiled research dataset based on 2 independent publishing organizations (HUD and U.S. Census Bureau), with row-level source and method notes shown in the ranking table.
District of Columbia · rank 1. The highest actual state is New York, rank 2, at 72.8.
Mississippi · rank 51 · HUD PIT 2025: 1,245 people.
51 comparable calculated rates; no U.S. territories included in the ranking.
Unweighted state median; not the same as a population-weighted U.S. rate.
Overview: a rate ranking is not a count ranking
HUD counted 181,934 people experiencing homelessness in California on the January 2025 PIT night, the largest state count, but California ranks 6th by rate (46.2 per 10,000) in this table. New York counted 145,560 people and ranks 2nd among all 51 jurisdictions (72.8). Population-adjusted rates answer a different question from total counts.
Across the 50 states and D.C. in this table, the observed PIT numerator totals 742,420 people; the matching July 2025 Census population denominator is 341,784,857. Their directly comparable ratio is 21.7 per 10,000. HUD's separately reported 745,652 national PIT count additionally covers island territories and therefore should not be divided by the 50-state-plus-D.C. population without a scope note.
These are one-night estimates, not the number of unique people who experienced homelessness at any time during 2025. Rates cover people in defined shelters and people in places not meant for habitation. The denominator is a midyear population estimate, six months after the January count.
Top 10 jurisdictions by 2025 homelessness rate
These values are population-adjusted rates, rather than total numbers of people. D.C. is a separate federal district and is retained for comparison; New York is the highest-ranked state.
| Rank | Jurisdiction | Rate / 10,000 | Source / method note |
|---|---|---|---|
| 1 | District of Columbia | 74.1 | calculated_value · South · HUD PIT Jan 2025: 5,138; Census PEP Jul 2025: 693,645; (HUD / Census) × 10,000. |
| 2 | New York | 72.8 | calculated_value · Northeast · HUD PIT Jan 2025: 145,560; Census PEP Jul 2025: 20,002,427; (HUD / Census) × 10,000. |
| 3 | Oregon | 63.7 | calculated_value · West · HUD PIT Jan 2025: 27,202; Census PEP Jul 2025: 4,273,586; (HUD / Census) × 10,000. |
| 4 | Vermont | 52.5 | calculated_value · Northeast · HUD PIT Jan 2025: 3,386; Census PEP Jul 2025: 644,663; (HUD / Census) × 10,000. |
| 5 | Hawaii | 47.7 | calculated_value · West · HUD PIT Jan 2025: 6,828; Census PEP Jul 2025: 1,432,820; (HUD / Census) × 10,000. |
| 6 | California | 46.2 | calculated_value · West · HUD PIT Jan 2025: 181,934; Census PEP Jul 2025: 39,355,309; (HUD / Census) × 10,000. |
| 7 | Washington | 39.6 | calculated_value · West · HUD PIT Jan 2025: 31,721; Census PEP Jul 2025: 8,001,020; (HUD / Census) × 10,000. |
| 8 | Massachusetts | 39.6 | calculated_value · Northeast · HUD PIT Jan 2025: 28,311; Census PEP Jul 2025: 7,154,084; (HUD / Census) × 10,000. |
| 9 | Alaska | 36.0 | calculated_value · West · HUD PIT Jan 2025: 2,655; Census PEP Jul 2025: 737,270; (HUD / Census) × 10,000. |
| 10 | Nevada | 30.2 | calculated_value · West · HUD PIT Jan 2025: 9,905; Census PEP Jul 2025: 3,282,188; (HUD / Census) × 10,000. |
All rates are StatRanker calculations from HUD 2025 PIT counts and Census 2025 population estimates. Displayed to one decimal; ranks use unrounded rates.
Top 20 homelessness rates: per 10,000 residents
The horizontal bars use the same unrounded rate values as the main table. The first bar is scaled to 100%; every other bar is proportional to Washington, D.C.'s 2025 rate.
Chart and tables share the same underlying 2025 numerator, denominator, calculation and rank. The bar length is proportional to rate, not to total count.
Methodology and data quality
1. Observed input: HUD
HUD is the original official numeric publisher of the January 2025 PIT sheltered-plus-unsheltered counts. For the 51 ranking rows, the 2025 state totals were transcribed from KFF State Health Facts' republication of HUD data and cross-checked against KFF's separate sheltered/unsheltered table. The HUD AHAR and state spreadsheet are the source of record; KFF is a secondary access and validation surface, not an independent count producer. HUD released AHAR Part 1 on May 29, 2026.
2. Observed input: Census
The numeric denominator is the Census Bureau Population Estimates Program, Vintage 2025, resident population on July 1, 2025 (NST-EST2025-ALLDATA / NST-EST2025-POP). The same population vintage is used for all 51 jurisdictions, including D.C.
3. Rate formula and status
Rate per 10,000 = (HUD January 2025 PIT count ÷ Census July 2025 resident population) × 10,000. Example: D.C. = 5,138 ÷ 693,645 × 10,000 = 74.0725, displayed as 74.1. All 51 rates have calculated_value status; no synthetic estimates or projections are included.
4. Ranking and precision
Jurisdictions are sorted by unrounded calculated rates, highest first. Rates are displayed to one decimal, so two different raw values can appear tied: Washington ranks seventh at 39.6462, ahead of eighth-ranked Massachusetts at 39.5732, although both display as 39.6. Missing PIT totals or population estimates would exclude a jurisdiction; none of the 51 included rows has a missing input.
5. Geography and source hierarchy
Census Northeast, Midwest, South and West groupings determine the region filter; the District of Columbia is classified within the Census South but is not a state. HUD and the U.S. Census Bureau are the two independent official numeric organizations. KFF supplies the secondary HUD data display used for transcription and verification; USAFacts supplies a separate comparison of published high/low rates. Census regional definitions are a methodology source, not another independent numerical publisher. Conflicting source figures were not averaged.
6. Scope, years and caveats
Both inputs are measured in 2025, though HUD is a January one-night count and Census is a July resident estimate. U.S. territories are excluded from this ranking. The 2025 PIT process had 29 CoCs without an unsheltered count, and the Augusta-Richmond County CoC in Georgia did not participate. These omissions and local field-count practices can affect comparability.
What the rate does not measure: annual homelessness prevalence, housing insecurity or doubled-up living arrangements, risk of becoming homeless, adequacy of shelter capacity, total demand for permanent housing, or causal effects of state policy. Because no confidence intervals are provided for these PIT inputs, small rank gaps should not be read as statistically meaningful differences.
Rounding: rates and charts to one decimal, analytic ratios/percentages to one decimal, underlying calculation retained without rounding for ordering. Source-published observed inputs are distinct from StatRanker-derived rates, averages, ratios and comparisons. No reported source conflicts were averaged.
Full 2025 ranking: all 50 states plus Washington, D.C.
Filter by jurisdiction, Census region or value status. The Top 10 and Top 20 switches retain the original nationwide rank threshold, even after regional filtering; select All to see every jurisdiction in a filtered group. Showing 51 of 51 rows.
| Rank | Jurisdiction | Rate / 10,000 | Source / method note |
|---|---|---|---|
| 1 | District of Columbia | 74.1 | calculated_value · South · HUD PIT Jan 2025: 5,138; Census PEP Jul 2025: 693,645; (HUD / Census) × 10,000. |
| 2 | New York | 72.8 | calculated_value · Northeast · HUD PIT Jan 2025: 145,560; Census PEP Jul 2025: 20,002,427; (HUD / Census) × 10,000. |
| 3 | Oregon | 63.7 | calculated_value · West · HUD PIT Jan 2025: 27,202; Census PEP Jul 2025: 4,273,586; (HUD / Census) × 10,000. |
| 4 | Vermont | 52.5 | calculated_value · Northeast · HUD PIT Jan 2025: 3,386; Census PEP Jul 2025: 644,663; (HUD / Census) × 10,000. |
| 5 | Hawaii | 47.7 | calculated_value · West · HUD PIT Jan 2025: 6,828; Census PEP Jul 2025: 1,432,820; (HUD / Census) × 10,000. |
| 6 | California | 46.2 | calculated_value · West · HUD PIT Jan 2025: 181,934; Census PEP Jul 2025: 39,355,309; (HUD / Census) × 10,000. |
| 7 | Washington | 39.6 | calculated_value · West · HUD PIT Jan 2025: 31,721; Census PEP Jul 2025: 8,001,020; (HUD / Census) × 10,000. |
| 8 | Massachusetts | 39.6 | calculated_value · Northeast · HUD PIT Jan 2025: 28,311; Census PEP Jul 2025: 7,154,084; (HUD / Census) × 10,000. |
| 9 | Alaska | 36.0 | calculated_value · West · HUD PIT Jan 2025: 2,655; Census PEP Jul 2025: 737,270; (HUD / Census) × 10,000. |
| 10 | Nevada | 30.2 | calculated_value · West · HUD PIT Jan 2025: 9,905; Census PEP Jul 2025: 3,282,188; (HUD / Census) × 10,000. |
| 11 | Colorado | 27.8 | calculated_value · West · HUD PIT Jan 2025: 16,687; Census PEP Jul 2025: 6,012,561; (HUD / Census) × 10,000. |
| 12 | New Mexico | 22.0 | calculated_value · West · HUD PIT Jan 2025: 4,683; Census PEP Jul 2025: 2,125,498; (HUD / Census) × 10,000. |
| 13 | Rhode Island | 21.3 | calculated_value · Northeast · HUD PIT Jan 2025: 2,373; Census PEP Jul 2025: 1,114,521; (HUD / Census) × 10,000. |
| 14 | Arizona | 20.0 | calculated_value · West · HUD PIT Jan 2025: 15,259; Census PEP Jul 2025: 7,623,818; (HUD / Census) × 10,000. |
| 15 | Montana | 19.8 | calculated_value · West · HUD PIT Jan 2025: 2,263; Census PEP Jul 2025: 1,144,694; (HUD / Census) × 10,000. |
| 16 | Maine | 17.1 | calculated_value · Northeast · HUD PIT Jan 2025: 2,413; Census PEP Jul 2025: 1,414,874; (HUD / Census) × 10,000. |
| 17 | New Hampshire | 17.0 | calculated_value · Northeast · HUD PIT Jan 2025: 2,406; Census PEP Jul 2025: 1,415,342; (HUD / Census) × 10,000. |
| 18 | South Dakota | 15.5 | calculated_value · Midwest · HUD PIT Jan 2025: 1,450; Census PEP Jul 2025: 935,094; (HUD / Census) × 10,000. |
| 19 | Delaware | 14.8 | calculated_value · South · HUD PIT Jan 2025: 1,573; Census PEP Jul 2025: 1,059,952; (HUD / Census) × 10,000. |
| 20 | Minnesota | 14.4 | calculated_value · Midwest · HUD PIT Jan 2025: 8,392; Census PEP Jul 2025: 5,830,405; (HUD / Census) × 10,000. |
| 21 | New Jersey | 14.4 | calculated_value · Northeast · HUD PIT Jan 2025: 13,714; Census PEP Jul 2025: 9,548,215; (HUD / Census) × 10,000. |
| 22 | North Carolina | 13.9 | calculated_value · South · HUD PIT Jan 2025: 15,512; Census PEP Jul 2025: 11,197,968; (HUD / Census) × 10,000. |
| 23 | Missouri | 13.3 | calculated_value · Midwest · HUD PIT Jan 2025: 8,345; Census PEP Jul 2025: 6,270,541; (HUD / Census) × 10,000. |
| 24 | Idaho | 13.3 | calculated_value · West · HUD PIT Jan 2025: 2,697; Census PEP Jul 2025: 2,029,733; (HUD / Census) × 10,000. |
| 25 | Nebraska | 13.2 | calculated_value · Midwest · HUD PIT Jan 2025: 2,656; Census PEP Jul 2025: 2,018,006; (HUD / Census) × 10,000. |
| 26 | Utah | 13.0 | calculated_value · West · HUD PIT Jan 2025: 4,584; Census PEP Jul 2025: 3,538,904; (HUD / Census) × 10,000. |
| 27 | Kentucky | 12.6 | calculated_value · South · HUD PIT Jan 2025: 5,789; Census PEP Jul 2025: 4,606,864; (HUD / Census) × 10,000. |
| 28 | Oklahoma | 12.5 | calculated_value · South · HUD PIT Jan 2025: 5,174; Census PEP Jul 2025: 4,123,288; (HUD / Census) × 10,000. |
| 29 | Tennessee | 12.1 | calculated_value · South · HUD PIT Jan 2025: 8,850; Census PEP Jul 2025: 7,315,076; (HUD / Census) × 10,000. |
| 30 | Florida | 11.9 | calculated_value · South · HUD PIT Jan 2025: 27,888; Census PEP Jul 2025: 23,462,518; (HUD / Census) × 10,000. |
| 31 | Illinois | 11.5 | calculated_value · Midwest · HUD PIT Jan 2025: 14,576; Census PEP Jul 2025: 12,719,141; (HUD / Census) × 10,000. |
| 32 | Maryland | 11.4 | calculated_value · South · HUD PIT Jan 2025: 7,120; Census PEP Jul 2025: 6,265,347; (HUD / Census) × 10,000. |
| 33 | Pennsylvania | 11.4 | calculated_value · Northeast · HUD PIT Jan 2025: 14,834; Census PEP Jul 2025: 13,059,432; (HUD / Census) × 10,000. |
| 34 | West Virginia | 10.9 | calculated_value · South · HUD PIT Jan 2025: 1,925; Census PEP Jul 2025: 1,766,147; (HUD / Census) × 10,000. |
| 35 | Georgia | 10.9 | calculated_value · South · HUD PIT Jan 2025: 12,284; Census PEP Jul 2025: 11,302,748; (HUD / Census) × 10,000. |
| 36 | North Dakota | 10.8 | calculated_value · Midwest · HUD PIT Jan 2025: 861; Census PEP Jul 2025: 799,358; (HUD / Census) × 10,000. |
| 37 | Ohio | 10.2 | calculated_value · Midwest · HUD PIT Jan 2025: 12,196; Census PEP Jul 2025: 11,900,510; (HUD / Census) × 10,000. |
| 38 | Connecticut | 10.1 | calculated_value · Northeast · HUD PIT Jan 2025: 3,735; Census PEP Jul 2025: 3,688,496; (HUD / Census) × 10,000. |
| 39 | Michigan | 10.0 | calculated_value · Midwest · HUD PIT Jan 2025: 10,155; Census PEP Jul 2025: 10,127,884; (HUD / Census) × 10,000. |
| 40 | Indiana | 9.6 | calculated_value · Midwest · HUD PIT Jan 2025: 6,675; Census PEP Jul 2025: 6,973,333; (HUD / Census) × 10,000. |
| 41 | Wyoming | 9.1 | calculated_value · West · HUD PIT Jan 2025: 535; Census PEP Jul 2025: 588,753; (HUD / Census) × 10,000. |
| 42 | Kansas | 8.9 | calculated_value · Midwest · HUD PIT Jan 2025: 2,658; Census PEP Jul 2025: 2,977,220; (HUD / Census) × 10,000. |
| 43 | Texas | 8.8 | calculated_value · South · HUD PIT Jan 2025: 28,031; Census PEP Jul 2025: 31,709,821; (HUD / Census) × 10,000. |
| 44 | Wisconsin | 8.8 | calculated_value · Midwest · HUD PIT Jan 2025: 5,243; Census PEP Jul 2025: 5,972,787; (HUD / Census) × 10,000. |
| 45 | Arkansas | 8.7 | calculated_value · South · HUD PIT Jan 2025: 2,720; Census PEP Jul 2025: 3,114,791; (HUD / Census) × 10,000. |
| 46 | Iowa | 8.7 | calculated_value · Midwest · HUD PIT Jan 2025: 2,816; Census PEP Jul 2025: 3,238,387; (HUD / Census) × 10,000. |
| 47 | Virginia | 8.2 | calculated_value · South · HUD PIT Jan 2025: 7,240; Census PEP Jul 2025: 8,880,107; (HUD / Census) × 10,000. |
| 48 | Louisiana | 8.0 | calculated_value · South · HUD PIT Jan 2025: 3,688; Census PEP Jul 2025: 4,618,189; (HUD / Census) × 10,000. |
| 49 | Alabama | 8.0 | calculated_value · South · HUD PIT Jan 2025: 4,137; Census PEP Jul 2025: 5,193,088; (HUD / Census) × 10,000. |
| 50 | South Carolina | 7.9 | calculated_value · South · HUD PIT Jan 2025: 4,398; Census PEP Jul 2025: 5,570,274; (HUD / Census) × 10,000. |
| 51 | Mississippi | 4.2 | calculated_value · South · HUD PIT Jan 2025: 1,245; Census PEP Jul 2025: 2,954,160; (HUD / Census) × 10,000. |
Row-level calculation: HUD PIT 2025 count divided by Census PEP July 2025 population, times 10,000. Each row is calculated_value; absolute numeric-source URLs appear in Sources.
Four findings from the 2025 state-level dataset
Key insight: a 17.6-fold spread
D.C. ranks 1st at 74.1, compared with Mississippi, 51st at 4.2 people per 10,000. Based on unrounded calculated rates, the D.C.–Mississippi multiple is 17.6×. Among states only, New York is the leader at 72.8.
Notable pattern: count and rate diverge
California is 6th by rate (46.2) but 1st by count (181,934). Together with New York's 145,560, those two states account for 327,494 of 742,420 people in the 50-state-plus-D.C. scope, or 44.1%. That is a share of the included PIT total, not a national homelessness rate.
Regional concentration: the West has six of ten
Of the ten highest-rate jurisdictions, 6 are in the Census West (Oregon, Hawaii, California, Washington, Alaska and Nevada), 3 in the Northeast (New York, Vermont and Massachusetts), 1 in the South (D.C.) and 0 in the Midwest. These are counts of top-ranked jurisdictions, not population shares.
Outlier: Vermont ranks high despite a small total count
Vermont ranks fourth at 52.5 per 10,000 with a PIT count of just 3,386. Massachusetts, also in the Northeast, ranks eighth at 39.6 despite counting 28,311 people, or 8.4 times Vermont's total. Vermont's rate is 13.0 per 10,000 higher using the unrounded inputs. The difference illustrates why raw counts and population-adjusted ranks answer different questions; it does not establish a cause.
What these differences mean
A rate lets a reader compare the size of a HUD PIT count relative to a jurisdiction's population. It does not determine whether the people counted were sheltered, whether housing assistance was sufficient, or how many people experienced homelessness across the year. D.C. also differs from a state in geographic scale and urban structure, so state-only comparisons should start with New York as the top-ranked state.
The rank is sensitive to observation rules and the population denominator, particularly when displayed values are close. HUD's single-night PIT method can miss unsheltered people, and different CoCs have different count coverage. The rate should not be read as an individual's probability of experiencing homelessness, a direct measure of rent affordability, or evidence of a policy's effectiveness.
For a different geographic view, see U.S. cities by homelessness rate (2026 snapshot). That article compares selected city-centered Continuum of Care service areas using January 2024 PIT data, not the complete set of states in January 2025. A CoC, municipality, county and state can cover very different populations, so rates and rank numbers should not be compared without matching years and boundaries.
FAQ: homelessness rates and HUD 2025 state estimates
Which U.S. state had the highest homelessness rate in 2025?
New York led the 50 states at 72.8 per 10,000 residents. Washington, D.C. ranked higher at 74.1 but is a federal district, not a state. Oregon ranked second among the 50 states at 63.7.
Why does this full ranking contain 51 rows?
It includes the 50 U.S. states plus the District of Columbia. D.C. is labeled separately, and U.S. territories are excluded because this is a state-plus-D.C. comparison using the same Census population denominator scope.
Are the per-10,000 rates directly published by HUD?
No. The HUD-published January 2025 PIT counts are official observed inputs; the Census Bureau's July 1, 2025 resident estimates are separate official observed inputs. StatRanker divides the count by population and multiplies by 10,000, so every rate has calculated_value status rather than official_value status.
Does 2025 refer to the count year or publication year?
It refers to the year of the PIT counts (January 2025) and population denominator (July 1, 2025). HUD released its 2025 AHAR Part 1 in May 2026; Census published the Vintage 2025 state population estimates in January 2026.
Why does the U.S. benchmark here read 21.7 instead of 21.8?
This page uses matched geography: 742,420 PIT observations in the 50 states plus D.C. divided by their Census population of 341,784,857, multiplied by 10,000 = 21.7. HUD's wider 745,652 national PIT count includes people in island territories. Dividing that wider numerator by the states-plus-D.C. denominator yields a different, mismatched-scope figure.
Is a higher PIT homelessness rate the same as more unsheltered homelessness?
No. The total PIT count combines sheltered and unsheltered people, and shelter mix varies sharply. New York recorded 139,704 sheltered people out of 145,560 total in 2025; California recorded 66,351 sheltered out of 181,934.
How precise are the ranks, and can displayed rates tie?
Rank uses the unrounded calculated numerator-to-denominator ratio. For presentation, a rate is rounded to one decimal, so two different exact values may display identically. PIT data are subject to counting limitations and are not accompanied here by confidence intervals.
Does this ranking contain 2026 forecasts or annual homelessness totals?
No. All 51 rows are calculated from observed 2025 HUD and Census inputs. There are no modeled projections, no official forecasts and no estimates of how many distinct people lacked housing at any point throughout the whole year.
Sources and provenance
HUD — 2025 AHAR Part 1 / state PIT counts
Role: numeric_source. Official 2025 state-level PIT numerator, including sheltered and unsheltered people. Release: May 2026. The same HUD organization provides the AHAR report and its accompanying 2007–2025 XLSB state dataset.
https://www.huduser.gov/portal/sites/default/files/xls/2007-2025-PIT-Counts-by-State.xlsb
U.S. Census Bureau — Vintage 2025 population
Role: numeric_source. Original 2025 resident-population denominator for the 50 states and D.C. (POPESTIMATE2025); Census Population Estimates Program. Data reference: July 1, 2025.
https://www.census.gov/data/tables/time-series/demo/popest/2020s-state-total.html
KFF State Health Facts — HUD data replication
Role: validation_source and secondary access interface for HUD numeric_source. The 2025 HUD state counts were transcribed from KFF's independently hosted republication and verified against its sheltered/unsheltered breakdown. KFF does not independently originate the HUD PIT counts and is not a third independent numeric publishing organization for this ranking. KFF also documents the CoC count limitations.
https://www.kff.org/state-health-policy-data/state-indicator/estimates-of-homelessness/
U.S. Census Bureau — regions and divisions
Role: methodology_source. Defines the four geographic groupings used by the region filter; it is the same Census publishing organization as the population source.
https://www.census.gov/programs-surveys/popest/about/glossary/geo-terms.html
USAFacts — independent high/low comparison
Role: validation_source. Independent analysis using HUD and Census data to corroborate the high and low jurisdictions and provide context on PIT limitations. Its separately stated nationwide rate uses its own coverage framing and is not substituted for this article's matched-scope benchmark.
https://usafacts.org/articles/which-states-have-the-highest-and-lowest-rates-of-homelessness/
