

Electrician Salary by U.S. State: 2025 BLS Ranking
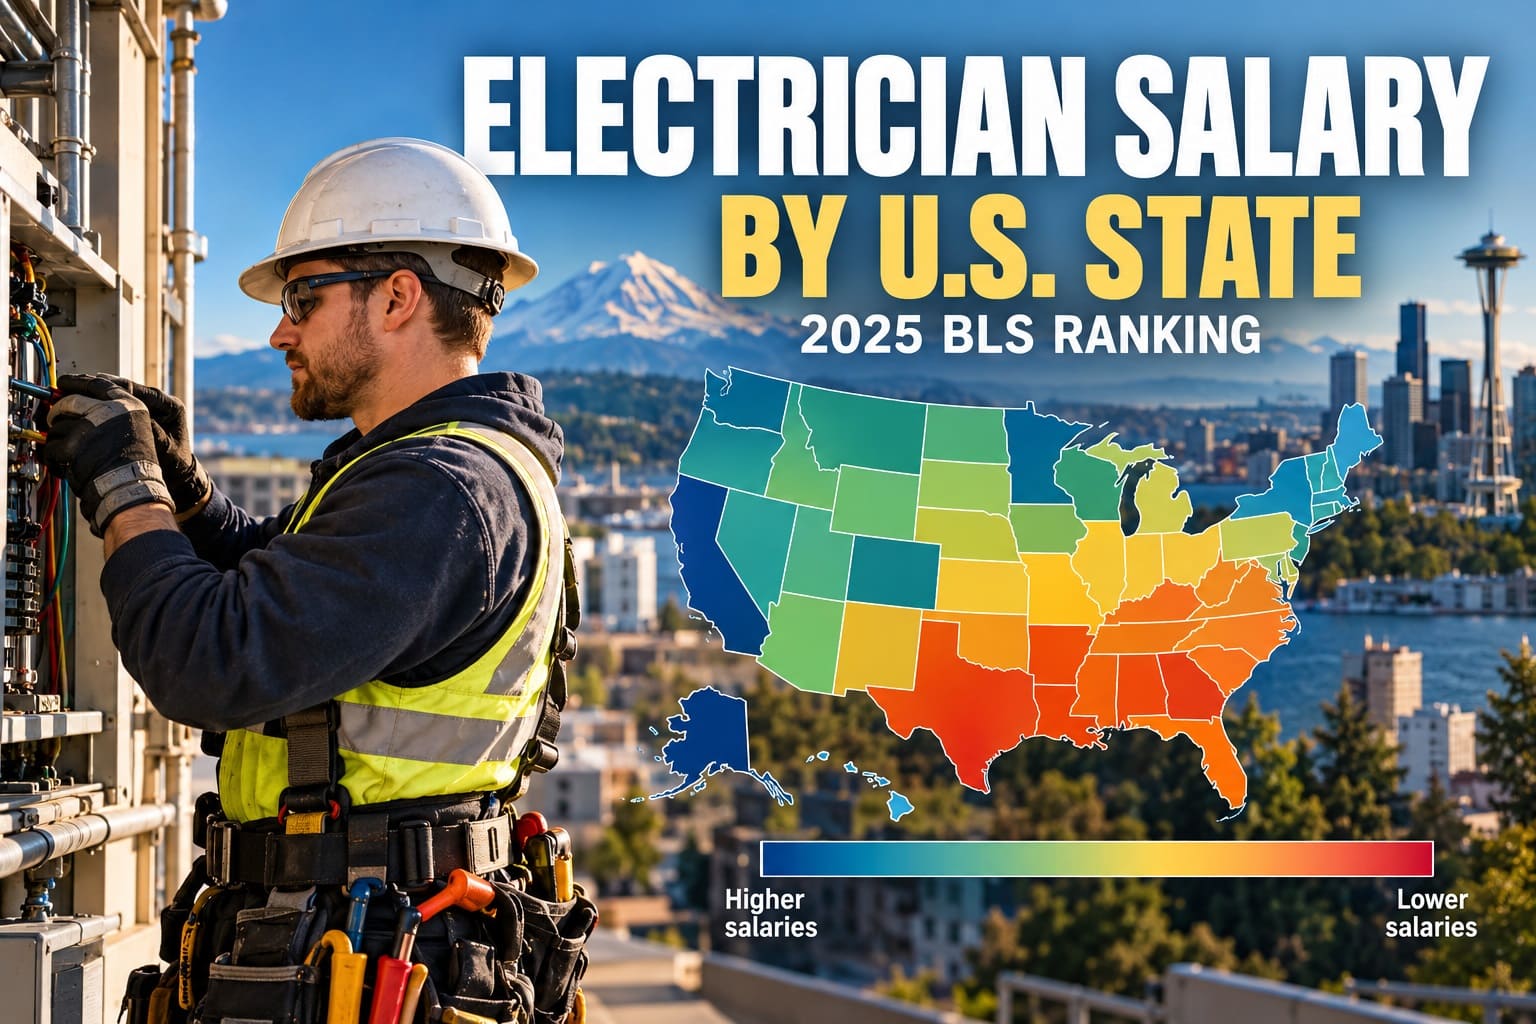
Where electrician wages are highest and lowest across U.S. states
The U.S. Bureau of Labor Statistics (BLS) May 2025 Occupational Employment and Wage Statistics (OEWS) show how mean annual electrician pay differs across all 50 states. This ranking uses BLS-published wage estimates for Electricians (SOC 47-2111), measured in nominal U.S. dollars per year, sorted highest to lowest. The May 2025 dataset was released on May 15, 2026; research and source checks were completed on October 28, 2026.
All 50 rows are BLS-published May 2025 occupational wage estimates (official_value); there are 0 projected or calculated salary rows. Occupation: Electricians (SOC 47-2111), all industries. Estimated employment accompanies each wage. Percentages against the $71,490 U.S. mean, regional counts and concentration measures are StatRanker calculations, not statistics separately published by BLS.
Electrician salary: key figures
Oregon, rank #1; 10,590 employed electricians.
Arkansas, rank #50; 7,500 employed electricians.
Published national mean annual wage; $34.37 mean hourly wage, BLS May 2025.
50 BLS official values, one reference period (May 2025), USD/year, one numeric publisher.
Overview: average pay is not the same as workforce size
Oregon leads the states at $99,750, followed by Washington ($94,470) and Hawaii ($92,870). At the low end, Arkansas has the smallest reported state mean at $53,470. The highest-to-lowest state gap is $46,280, or 1.87 times the lower figure. These are comparisons of published BLS mean wages, not forecasts.
Using the BLS $71,490 national mean as a common benchmark, 22 states are above and 28 below. The $69,830 median of the 50 state mean wages is a separate, unweighted StatRanker statistic; it must not be confused with the BLS median wage for individual U.S. electricians ($63,190).
Employment tells a different story. Texas has 76,770 electricians, the largest state count, but ranks #44 by average wage ($59,280). California has 73,310 electricians and ranks #7 on pay ($85,860). BLS national employment is 757,220, including the District of Columbia in the national geographic coverage.
Top 10 highest-paying states for electricians
These ten states have the highest BLS May 2025 mean annual electrician wages. Each note identifies the published wage estimate, estimated jobs and the separately calculated deviation from the $71,490 U.S. mean. Ranks use mean wages, not medians.
| Rank | State | Mean annual wage | Region / source note |
|---|---|---|---|
| 1 | Oregon | $99,750 | West; BLS OEWS May 2025; official_value; 10,590 employed; +39.5% vs. U.S. mean (StatRanker-calculated). |
| 2 | Washington | $94,470 | West; BLS OEWS May 2025; official_value; 19,380 employed; +32.1% vs. U.S. mean (StatRanker-calculated). |
| 3 | Hawaii | $92,870 | West; BLS OEWS May 2025; official_value; 3,070 employed; +29.9% vs. U.S. mean (StatRanker-calculated). |
| 4 | Illinois | $92,230 | Midwest; BLS OEWS May 2025; official_value; 23,120 employed; +29.0% vs. U.S. mean (StatRanker-calculated). |
| 5 | Alaska | $90,040 | West; BLS OEWS May 2025; official_value; 1,870 employed; +25.9% vs. U.S. mean (StatRanker-calculated). |
| 6 | New Jersey | $86,700 | Northeast; BLS OEWS May 2025; official_value; 13,520 employed; +21.3% vs. U.S. mean (StatRanker-calculated). |
| 7 | California | $85,860 | West; BLS OEWS May 2025; official_value; 73,310 employed; +20.1% vs. U.S. mean (StatRanker-calculated). |
| 8 | New York | $84,860 | Northeast; BLS OEWS May 2025; official_value; 40,130 employed; +18.7% vs. U.S. mean (StatRanker-calculated). |
| 9 | Massachusetts | $81,560 | Northeast; BLS OEWS May 2025; official_value; 17,810 employed; +14.1% vs. U.S. mean (StatRanker-calculated). |
| 10 | Minnesota | $80,830 | Midwest; BLS OEWS May 2025; official_value; 14,350 employed; +13.1% vs. U.S. mean (StatRanker-calculated). |
The percentages in the notes are calculated as (state mean annual wage / U.S. mean annual wage − 1) × 100, using $71,490 as the national denominator.
Top 20 states: average electrician salary chart
The bar lengths use the same published dollar figures as the ranking: state mean annual wage divided by Oregon's $99,750, multiplied by 100. Oregon is the 100% reference for the chart, not a national market share.
The twentieth-ranked state is Vermont ($73,360); a $26,390 difference separates Vermont from Oregon. Bars represent mean annual wages, not employment or purchasing power.
Methodology and verification
Metric, scope and direction
Official BLS May 2025 OEWS annual mean wages for Electricians (2018 SOC 47-2111), all industries, state geography, current USD/year. The ranking sorts the 50 state estimates descending; ties, if any, are ordered alphabetically. Washington, DC ($88,860; 2,440 jobs) is a federal district, not a state, and is excluded from the 50 ranks.
Survey panels and reference year
The May 2025 OEWS release (published May 15, 2026) combines six semiannual survey panels: Nov 2022, May 2023, Nov 2023, May 2024, Nov 2024 and May 2025. BLS adjusts older survey inputs to the May 2025 reference period using its MB3 model-based method. All 50 published estimates are labeled May 2025; this is not a 2026 salary projection. Sources checked October 28, 2026.
Source roles and verification
Numeric source: BLS OEWS May 2025, one official publisher. Validation: two independently published full-state BLS-derived transcriptions (MapifyStats and Affordable Trade Schools), both agreeing on annual mean wages and employment for all 50 states, plus the EC&M Top 5 report. Methodology: BLS technical notes and FAQ; Census Bureau regional divisions. Every wage row is official_value as a published BLS estimate, not an independently modeled StatRanker figure. The primary BLS state ZIP is linked, but its binary contents were not retrievable for an independent row-by-row archive comparison in this review; 50 full-state values were reconciled across two published secondary datasets and the leaders cross-validated against industry reporting. This is independent transcription checking, not direct parsing of the original BLS binary archive.
Comparison formulas
Dollar gap: state annual mean − $71,490 BLS U.S. annual mean. Percentage gap: (state annual mean / $71,490 − 1) × 100. High/low ratio: $99,750 / $53,470 = 1.87. State-mean median: midpoint of 50 sorted state means = $69,830. Calculations use the published wages as inputs; they are not wage projections.
Regions and concentration
West, Northeast, Midwest and South use U.S. Census Bureau region membership. Region counts refer to states, not people. Employment-share calculation: sum of five largest state counts (268,860) / 757,220 U.S. electricians × 100 = 35.5%. State employment estimates are rounded, so small reconciliation differences are expected.
Rounding and interpretation
Annual mean wages use BLS-published dollar amounts rounded to the nearest $10, typically based on a 2,080-hour full-time equivalent. Do not reconstruct the published annual mean from the already-rounded hourly figure. State estimates include sampling/model uncertainty; small differences do not establish statistically significant wage advantages. Regional averages of state means are not national employee-weighted wages.
Coverage and checks: all 50 states have an observed May 2025 annual mean and estimated occupation count in the accessible BLS-derived comparison. State employment estimates sum to 754,800; adding DC (2,440) gives 757,240, which differs from the national estimate (757,220) by 20 due to published rounding. No older state years or missing annual means were inserted. BLS data take precedence over reproductions; a conflicting value must be investigated rather than averaged. This metric excludes self-employment and overtime premiums and does not measure benefits, vacancies, taxes, local prices, actual annual hours or journeyman-only pay.
Full ranking: all 50 U.S. states by electrician mean pay
Search by state, filter by Census region or data status, then sort by wage or state name. The first 10 / first 20 limit applies after filtering and sorting, so sorting from low to high shows the ten lowest salaries. The Rank column always retains the original high-to-low BLS wage rank.
Showing all 50 states.
| Rank | State | Mean annual wage | Region / source note |
|---|---|---|---|
| 1 | Oregon | $99,750 | West; BLS OEWS May 2025; official_value; 10,590 jobs; +39.5% vs. U.S. mean (calculated). |
| 2 | Washington | $94,470 | West; BLS OEWS May 2025; official_value; 19,380 jobs; +32.1% vs. U.S. mean (calculated). |
| 3 | Hawaii | $92,870 | West; BLS OEWS May 2025; official_value; 3,070 jobs; +29.9% vs. U.S. mean (calculated). |
| 4 | Illinois | $92,230 | Midwest; BLS OEWS May 2025; official_value; 23,120 jobs; +29.0% vs. U.S. mean (calculated). |
| 5 | Alaska | $90,040 | West; BLS OEWS May 2025; official_value; 1,870 jobs; +25.9% vs. U.S. mean (calculated). |
| 6 | New Jersey | $86,700 | Northeast; BLS OEWS May 2025; official_value; 13,520 jobs; +21.3% vs. U.S. mean (calculated). |
| 7 | California | $85,860 | West; BLS OEWS May 2025; official_value; 73,310 jobs; +20.1% vs. U.S. mean (calculated). |
| 8 | New York | $84,860 | Northeast; BLS OEWS May 2025; official_value; 40,130 jobs; +18.7% vs. U.S. mean (calculated). |
| 9 | Massachusetts | $81,560 | Northeast; BLS OEWS May 2025; official_value; 17,810 jobs; +14.1% vs. U.S. mean (calculated). |
| 10 | Minnesota | $80,830 | Midwest; BLS OEWS May 2025; official_value; 14,350 jobs; +13.1% vs. U.S. mean (calculated). |
| 11 | Connecticut | $77,390 | Northeast; BLS OEWS May 2025; official_value; 7,710 jobs; +8.3% vs. U.S. mean (calculated). |
| 12 | Maine | $77,250 | Northeast; BLS OEWS May 2025; official_value; 3,780 jobs; +8.1% vs. U.S. mean (calculated). |
| 13 | Pennsylvania | $75,770 | Northeast; BLS OEWS May 2025; official_value; 22,730 jobs; +6.0% vs. U.S. mean (calculated). |
| 14 | Nevada | $75,710 | West; BLS OEWS May 2025; official_value; 8,350 jobs; +5.9% vs. U.S. mean (calculated). |
| 15 | Maryland | $75,450 | South; BLS OEWS May 2025; official_value; 13,690 jobs; +5.5% vs. U.S. mean (calculated). |
| 16 | Wyoming | $74,860 | West; BLS OEWS May 2025; official_value; 2,960 jobs; +4.7% vs. U.S. mean (calculated). |
| 17 | Rhode Island | $74,150 | Northeast; BLS OEWS May 2025; official_value; 2,420 jobs; +3.7% vs. U.S. mean (calculated). |
| 18 | Michigan | $73,840 | Midwest; BLS OEWS May 2025; official_value; 23,530 jobs; +3.3% vs. U.S. mean (calculated). |
| 19 | Wisconsin | $73,810 | Midwest; BLS OEWS May 2025; official_value; 14,310 jobs; +3.2% vs. U.S. mean (calculated). |
| 20 | Vermont | $73,360 | Northeast; BLS OEWS May 2025; official_value; 1,270 jobs; +2.6% vs. U.S. mean (calculated). |
| 21 | Missouri | $72,310 | Midwest; BLS OEWS May 2025; official_value; 12,780 jobs; +1.1% vs. U.S. mean (calculated). |
| 22 | Montana | $71,930 | West; BLS OEWS May 2025; official_value; 2,750 jobs; +0.6% vs. U.S. mean (calculated). |
| 23 | Indiana | $70,820 | Midwest; BLS OEWS May 2025; official_value; 19,020 jobs; -0.9% vs. U.S. mean (calculated). |
| 24 | Delaware | $70,750 | South; BLS OEWS May 2025; official_value; 2,260 jobs; -1.0% vs. U.S. mean (calculated). |
| 25 | North Dakota | $70,460 | Midwest; BLS OEWS May 2025; official_value; 3,570 jobs; -1.4% vs. U.S. mean (calculated). |
| 26 | Kansas | $69,200 | Midwest; BLS OEWS May 2025; official_value; 6,350 jobs; -3.2% vs. U.S. mean (calculated). |
| 27 | Ohio | $68,840 | Midwest; BLS OEWS May 2025; official_value; 28,950 jobs; -3.7% vs. U.S. mean (calculated). |
| 28 | Virginia | $67,850 | South; BLS OEWS May 2025; official_value; 23,630 jobs; -5.1% vs. U.S. mean (calculated). |
| 29 | West Virginia | $67,840 | South; BLS OEWS May 2025; official_value; 4,290 jobs; -5.1% vs. U.S. mean (calculated). |
| 30 | Idaho | $66,600 | West; BLS OEWS May 2025; official_value; 5,690 jobs; -6.8% vs. U.S. mean (calculated). |
| 31 | Colorado | $66,310 | West; BLS OEWS May 2025; official_value; 17,010 jobs; -7.2% vs. U.S. mean (calculated). |
| 32 | New Hampshire | $65,780 | Northeast; BLS OEWS May 2025; official_value; 3,330 jobs; -8.0% vs. U.S. mean (calculated). |
| 33 | Utah | $65,290 | West; BLS OEWS May 2025; official_value; 11,450 jobs; -8.7% vs. U.S. mean (calculated). |
| 34 | Arizona | $64,220 | West; BLS OEWS May 2025; official_value; 21,140 jobs; -10.2% vs. U.S. mean (calculated). |
| 35 | Nebraska | $63,960 | Midwest; BLS OEWS May 2025; official_value; 6,440 jobs; -10.5% vs. U.S. mean (calculated). |
| 36 | Tennessee | $63,540 | South; BLS OEWS May 2025; official_value; 17,070 jobs; -11.1% vs. U.S. mean (calculated). |
| 37 | Oklahoma | $63,410 | South; BLS OEWS May 2025; official_value; 8,500 jobs; -11.3% vs. U.S. mean (calculated). |
| 38 | Iowa | $63,190 | Midwest; BLS OEWS May 2025; official_value; 10,310 jobs; -11.6% vs. U.S. mean (calculated). |
| 39 | Louisiana | $62,350 | South; BLS OEWS May 2025; official_value; 10,550 jobs; -12.8% vs. U.S. mean (calculated). |
| 40 | South Dakota | $61,980 | Midwest; BLS OEWS May 2025; official_value; 2,980 jobs; -13.3% vs. U.S. mean (calculated). |
| 41 | Kentucky | $61,410 | South; BLS OEWS May 2025; official_value; 11,030 jobs; -14.1% vs. U.S. mean (calculated). |
| 42 | Georgia | $61,090 | South; BLS OEWS May 2025; official_value; 21,650 jobs; -14.5% vs. U.S. mean (calculated). |
| 43 | New Mexico | $59,620 | West; BLS OEWS May 2025; official_value; 5,020 jobs; -16.6% vs. U.S. mean (calculated). |
| 44 | Texas | $59,280 | South; BLS OEWS May 2025; official_value; 76,770 jobs; -17.1% vs. U.S. mean (calculated). |
| 45 | South Carolina | $59,030 | South; BLS OEWS May 2025; official_value; 8,010 jobs; -17.4% vs. U.S. mean (calculated). |
| 46 | Mississippi | $58,000 | South; BLS OEWS May 2025; official_value; 6,610 jobs; -18.9% vs. U.S. mean (calculated). |
| 47 | Florida | $57,660 | South; BLS OEWS May 2025; official_value; 49,700 jobs; -19.3% vs. U.S. mean (calculated). |
| 48 | Alabama | $57,510 | South; BLS OEWS May 2025; official_value; 10,900 jobs; -19.6% vs. U.S. mean (calculated). |
| 49 | North Carolina | $56,850 | South; BLS OEWS May 2025; official_value; 21,640 jobs; -20.5% vs. U.S. mean (calculated). |
| 50 | Arkansas | $53,470 | South; BLS OEWS May 2025; official_value; 7,500 jobs; -25.2% vs. U.S. mean (calculated). |
Every row: BLS OEWS May 2025 (published annual mean and employment, official_value). Its percentage gap is StatRanker-calculated using the BLS national mean of $71,490. The fixed Rank column always identifies descending mean annual pay among the 50 states, regardless of display sort.
Four findings from the 2025 BLS state data
Key Insight: a $46,280 pay spread
Oregon (#1, $99,750) exceeds Arkansas (#50, $53,470) by $46,280 per year, or 1.87×. Against the national mean of $71,490, Oregon is 39.5% above and Arkansas 25.2% below.
Notable Pattern: employment and wage ranks diverge
Texas employs the most electricians (76,770) but ranks #44 in annual mean pay ($59,280). California employs 73,310 and ranks #7 ($85,860), a $26,580 wage difference despite only 3,460 fewer estimated jobs.
Regional Concentration: West dominates the Top 10
Of the ten highest-paying states, five are in the West, three in the Northeast and two in the Midwest; none are in the South. Only 1 of 16 Southern states (Maryland, #15) exceeds the $71,490 U.S. mean.
Outlier: DC changes the picture if included
The District of Columbia is excluded from state ranks, but its published mean is $88,860 with 2,440 electricians. If it were included, it would fall between Alaska ($90,040) and New Jersey ($86,700), an indicative sixth place in a 51-jurisdiction comparison.
What the electrician salary ranking does—and does not—tell you
These are gross straight-time wage rates expressed as full-time-equivalent annual amounts, not estimates of personal take-home pay. Illinois (#4) has an annual mean of $92,230 and Minnesota (#10) $80,830—a difference of $11,400 between two Midwestern states. That does not establish which state offers better purchasing power: neither taxes nor living costs are deducted and different local job mixes are included.
The employment counts describe estimated filled wage-and-salary positions, not vacancies. The state comparisons do not standardize for union coverage, apprenticeship mix, employer composition or overtime; BLS provides occupation-wide estimates rather than a like-for-like contractor or license-grade salary. Small differences—for example Virginia ($67,850) and West Virginia ($67,840)—should not be read as a meaningful earnings advantage without precision estimates.
For a different geographic and statistical question, see StatRanker's Top 100 U.S. metro areas for electricians. That page ranks metro medians using May 2025 BLS data; this page ranks state means. Do not combine those two rankings or compare their ranks as if their denominators and statistics were identical.
Frequently asked questions
What state pays electricians the highest average salary in 2025?
Oregon ranks #1 on the May 2025 BLS mean annual wage metric at $99,750, followed by Washington ($94,470) and Hawaii ($92,870).
What is the U.S. average electrician salary in the BLS 2025 data?
The BLS national mean annual wage is $71,490 ($34.37 per hour). That is the comparator used for every calculated state percentage.
Why is the national median $63,190 rather than $71,490?
They are different statistics for the same occupation and year. $71,490 is the arithmetic mean; $63,190 is the median wage separating the lower-paid and higher-paid halves of the national electrician wage distribution.
Are these actual 2026 salaries or estimates for May 2025?
They are May 2025 OEWS estimates, officially released May 15, 2026. The page does not estimate salaries for 2026 or apply growth rates.
Why are there 50 entries rather than 51 with Washington, DC?
The ranking is specifically of the 50 states. The District of Columbia is reported separately ($88,860 mean annual wage, 2,440 electricians). Puerto Rico and other territories are also outside this state-only scope.
Does the average salary include overtime or self-employed electricians?
No. OEWS measures straight-time gross wages for wage-and-salary employees in covered establishments. Overtime premiums, employer benefits and self-employed owner earnings are outside this measure. BLS annualized wages generally assume 2,080 hours.
How are the wage gaps and regional counts calculated?
Percent gap = (state BLS mean wage / $71,490 national BLS mean − 1) × 100. Region counts use Census region membership and include only the 50 states. These are arithmetic comparisons of observed BLS estimates, not official forecasts.
How many survey panels are combined for the May 2025 estimates?
BLS combines six semiannual survey panels from November 2022 through May 2025 and uses a model-based approach to express the combined observations as May 2025 occupational estimates. Those are official survey estimates, not a direct count of every electrician in 2025.
Sources and source roles
U.S. Bureau of Labor Statistics — May 2025 OEWS state data
Official primary numeric publication of state occupation-level mean annual wages and employment; May 2025, SOC 47-2111. One numeric publisher. Linked original ZIP; its contents were not directly parsed in this review, so independent archive matching is not claimed.
U.S. Bureau of Labor Statistics — May 2025 OEWS national estimates
Directly readable official national BLS release table: 757,220 electricians, $34.37 mean hourly, $71,490 mean annual, $30.38 median hourly. Same primary publishing organization, not an independent numeric source.
MapifyStats — Electrician Wages by State, May 2025
Public BLS-derived reproduction listing all 50 states plus DC, with annual means, hourly means and employment; 50 rows cross-checked. Links to an archived extract and source checksum. Secondary validation, not an independent original numeric publisher.
Affordable Trade Schools — Electrician industry report
Complete May 2025 OEWS state detail table with mean annual wages and employment. All 50 entries were compared against the ranking and agree with the MapifyStats BLS-based values. Not an additional original wage-survey source.
https://affordabletradeschools.com/industry-reports/electrician/
Electrical Construction & Maintenance — Highest-Paying States for Electricians
Industry reporting used to cross-check the leading May 2025 mean wage observations for Oregon, Washington, Hawaii, Illinois and Alaska.
BLS — Technical Notes for May 2025 OEWS
Primary description of six-panel sampling, MB3 modeling, occupational coverage, reference year, and wage definition for May 2025 estimates.
BLS — OEWS Frequently Asked Questions
Definitions of mean versus median pay, worker coverage, excluded overtime and benefits, and annualization using 2,080 hours.
U.S. Census Bureau — Geographic Levels
Defines Northeast, Midwest, South and West state groupings for the ranking filters and regional count comparisons.
https://www.census.gov/programs-surveys/economic-census/guidance-geographies/levels.html
Related rankings
Closely related StatRanker ranking and data pages selected by topic, entity scope and category. Fewer links are shown when strong matches are limited.
