

Top 100 Countries by Youth Unemployment (15–24, %),
Compare youth unemployment rates for ages 15–24 across 100 countries in the 2025 ranking, with definitions, source years and labour-market

Compare youth unemployment rates for ages 15–24 across 100 countries in the 2025 ranking, with definitions, source years and labour-market

Compare unemployment rates across 100 countries in 2025. See the highest and lowest rates and each country's position in the

Compare 72 countries by real interest rate in the 2025 snapshot using World Bank WDI methodology, with inflation-adjusted lending rates

Compare central bank policy interest rates by country in the December 2025 snapshot, including the highest benchmark rates and methodology

Rank the top 100 countries by automotive import value in 2025 using HS chapter 87 trade data, current US dollars,

Compare the world’s largest new car markets by country in 2025, ranked by annual passenger car and light vehicle sales

Why grid constraints slow the energy transition, with a 2026 ranking of U.S. states by requested interconnection queue capacity using

Learn why installed renewable capacity in MW or GW is not the same as real electricity generation, and how capacity

See when charging access becomes the binding constraint on EV adoption, including home, workplace and public charging availability in a

Understand why fast EV sales growth can coexist with a slowly changing share of electric vehicles in the total car

See why nominal wage growth can fail to improve living standards when inflation, taxes, housing costs and household spending erode

Learn when nominal GDP and PPP GDP are the better comparison tools, and see how 2024 World Bank data can

Compare nominal GDP and PPP GDP, see how country rankings change, and learn which metric to use for trade, debt,

Understand why per-capita rankings often elevate small countries compared with total metrics, using a fixed 2024 GDP case study and

Understand why World Bank, IMF and OECD figures for the same country can differ because of definitions, timing, revisions, conversions

Learn why stock-based country rankings often move slowly even when annual flows change sharply, using a 2024 historical case study
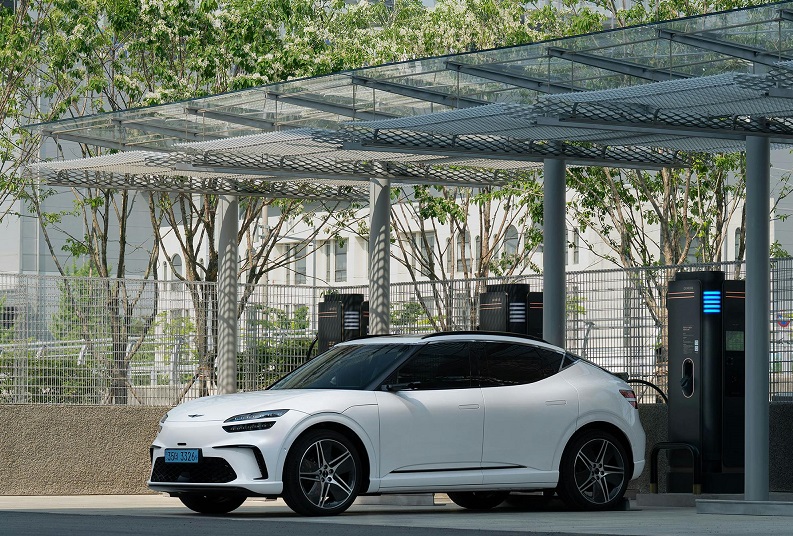
Compare public EV chargers per 1,000 electric vehicles by country in 2025, based on 2024 IEA data, with rankings, charts,
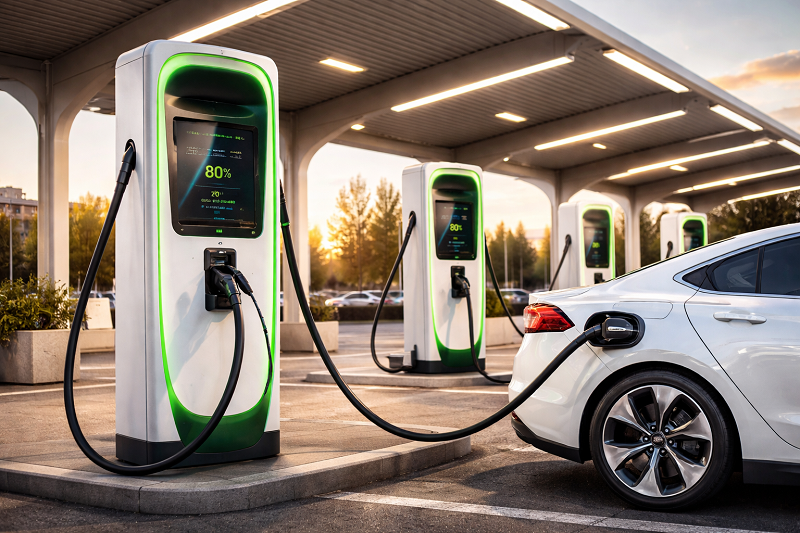
Compare public EV charging density across 100 countries in 2025 using chargers per 100,000 people, with source years, methodology and

Compare phosphate rock mine production by country using USGS 2025 estimates, including China, Morocco, the United States and other major

Top 12 countries by uranium mine production in a 2026 snapshot using World Nuclear Association 2024 country data: 7 reported

Top 30 bauxite-producing countries using the full producer list in World Mining Data 2025. Production year: 2023; values are crude

Compare natural graphite mine production by country in 2025 using USGS estimates, with all 18 confirmed producers, metric tons, rankings

Rank 12 countries by cobalt mine production in the 2025 USGS snapshot, measured as cobalt content, with source notes and

Compare nickel mine production by country using BGS 2023 data, measured as nickel metal content, with source notes and country
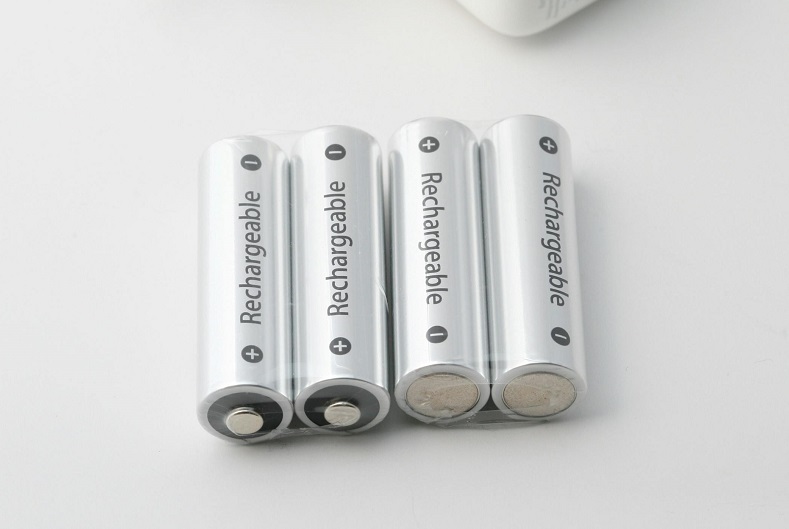
Rank the top lithium-producing countries using 2024 BGS data in tonnes of lithium content, with methodology, source notes and global

Compare 50 copper-producing countries using the latest BGS/USGS mine output data, with metal-content values, concentration analysis and methodology.
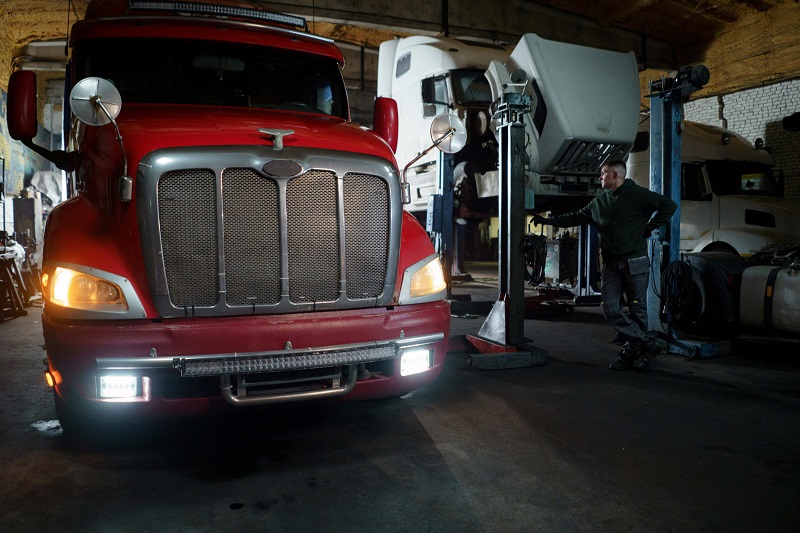
Compare 57 markets by 2024 commercial vehicle registrations or sales using OICA data, with values, shares, year-over-year change and scope

Get Excel and CSV data packs used in published StatRanker research, with source and methodology notes where available.
Browse Data Packs →Publisher details: site managed since 28 August 2025; private entrepreneur, registration code 133276738020, Ukraine. Technical infrastructure is located in the United States; CDN edge locations may be used internationally.