

Fastest-Growing Economies by Real GDP Growth in 2025
See the fastest-growing economies in 2025, ranked by IMF real GDP growth estimates, with South Sudan, Guyana and Libya leading
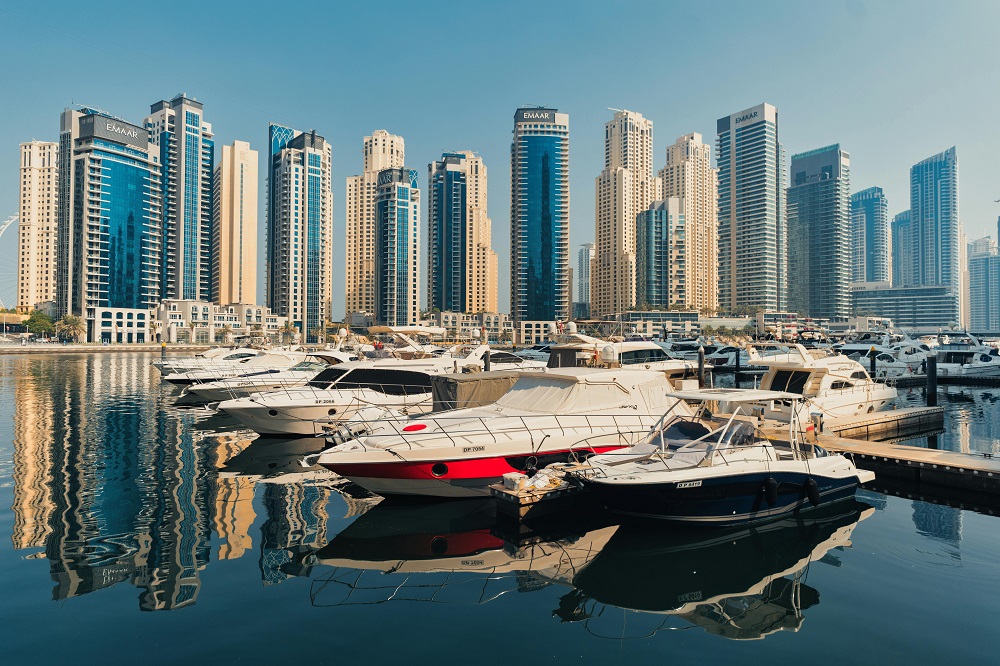
See the fastest-growing economies in 2025, ranked by IMF real GDP growth estimates, with South Sudan, Guyana and Libya leading

See the top 100 largest economies by nominal GDP in 2025, with 2024 estimates and 2026 IMF projections. Ranked by

Rank 100 countries by road quality using comparable WEF 2019 survey data, presented as a 2025 snapshot with methodology and

Compare the world’s largest airline groups by passenger traffic using 2024 data as the benchmark for 2025 planning, with source
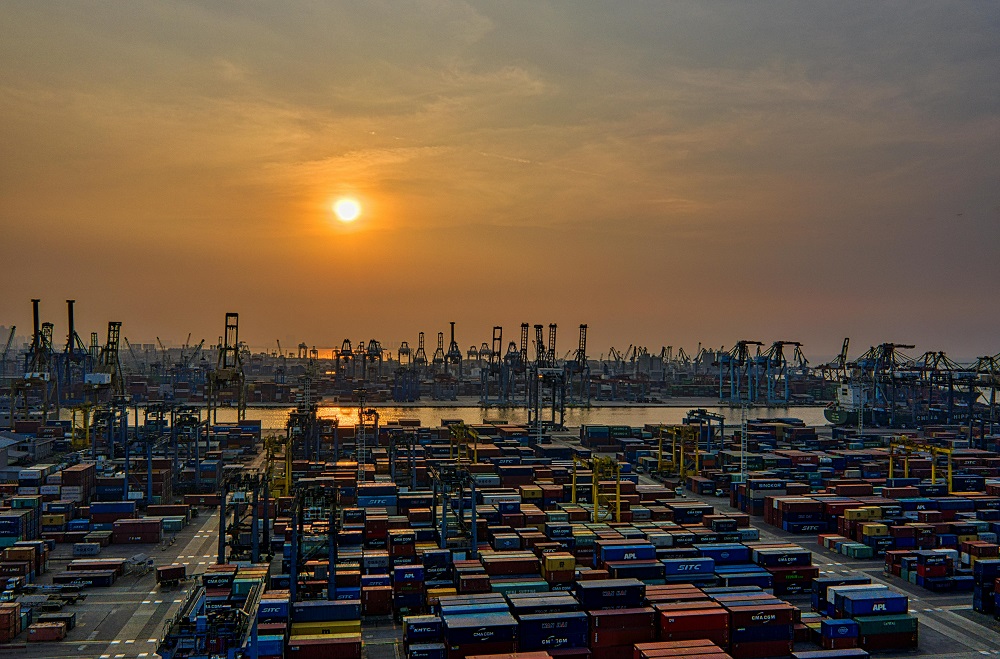
Compare the world’s busiest container ports using 2024 full-year throughput in TEUs as the baseline for the 2025 snapshot, with
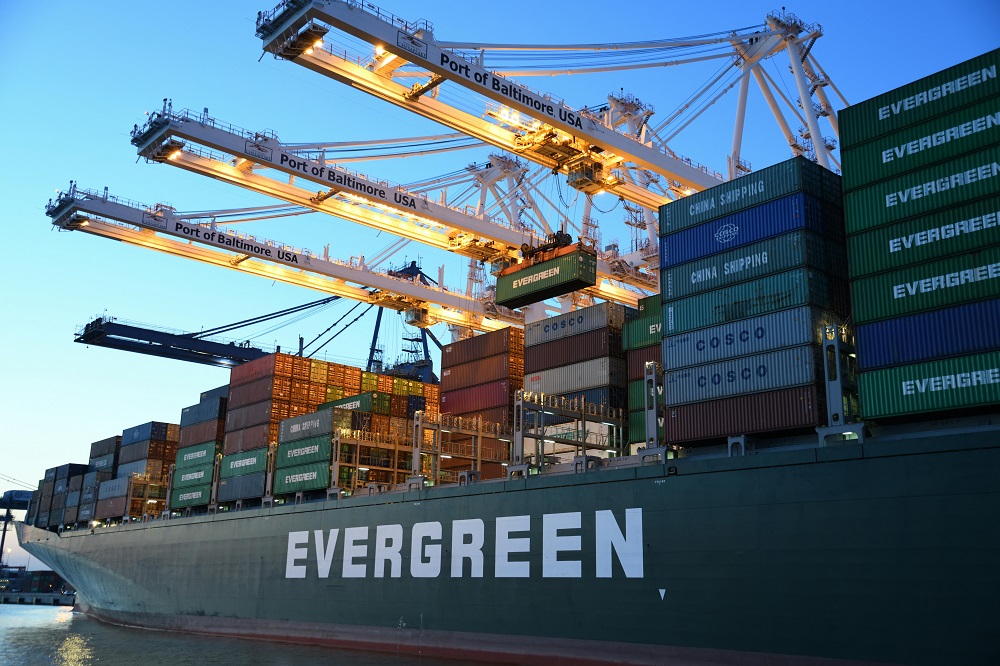
Top 10 countries by the Logistics Performance Index (LPI) in 2025. Ranked table with scores and quick interpretation of what

Compare countries by real, inflation-adjusted home price growth in the 2025 ranking, separating genuine property gains from general consumer inflation.

Compare 40 countries by median tenant rent burden in the 2026 OECD snapshot, measuring rent payments as a share of

Compare countries by combined strategic output across lithium, nickel, cobalt and rare earth supply chains, with methodology and concentration context.

See which countries and economies reduced energy use per unit of GDP fastest from 2015 to 2022, with rates, methodology

Rank 32 countries and territories by nuclear share of electricity generation using 2025 observed OWID data from Ember and the
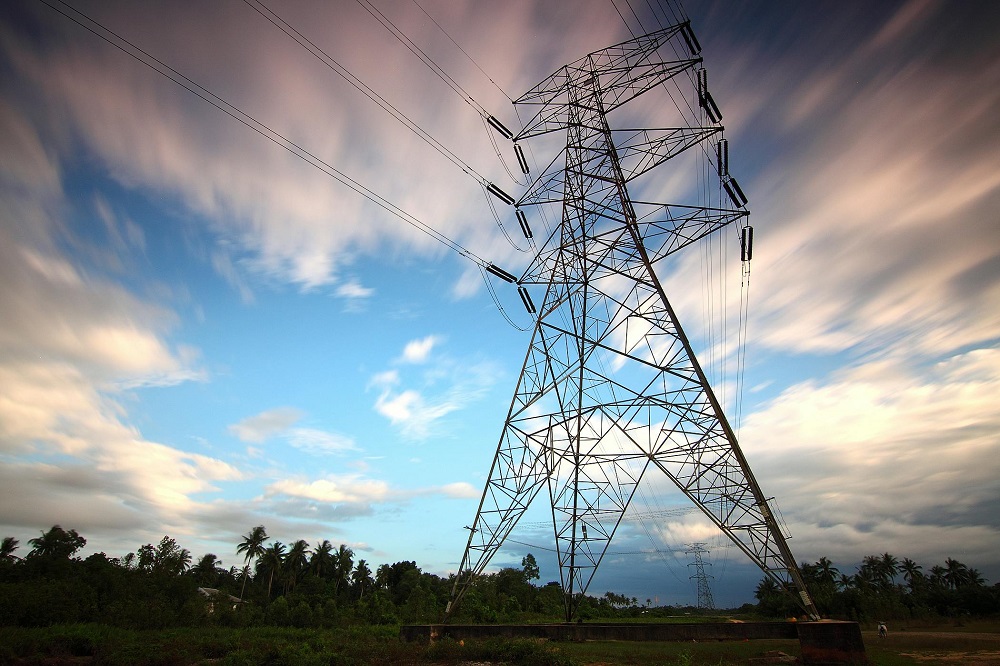
Compare countries where renewables supply the largest share of domestic electricity generation, including hydro, wind, solar, geothermal and bioenergy.

Compare countries by manufacturing value added per person, an SDG 9.2.1(b) productivity metric that scales industrial output to population size.

Compare countries by enterprise birth rate using Eurostat 2023 observations published in 2025, with the rate measured as a share

Compare countries with the strongest access to credit for small and medium-sized enterprises, using the latest OECD lending and financing

Compare the leading venture capital markets by publicly reported startup and growth funding in 2025, with source coverage and methodology
Explain how infrastructure gaps are measured in this 2026 methodology snapshot, why GI Hub data helps and why verified rankings

Compare 33 countries and territories with the lowest confirmed corporate tax headline rates in a 2026 snapshot based on current

Ranking of top FDI inflow destinations for the 2025–2026 cycle, based on UNCTAD 2024 official values and a transparent 2026

Compare countries with the highest standard VAT or GST rates, focusing on headline consumption-tax rates with source notes and tax-system
Compare 30 countries by tax revenue and social contributions as a share of GDP using the latest available observations in

Compare countries by PPP-adjusted annual compensation for mid-to-senior software engineers, including base pay, bonus and annualised equity.

See the 2025 ranking of 30 European countries with the lowest gender pay gap, based on the latest Eurostat data,

Compare countries by PPP-adjusted median wages in the 2025 snapshot, focusing on the midpoint of worker earnings rather than average

Compare statutory minimum wages after PPP adjustment and harmonisation to a common annual pay period, showing real cross-country purchasing power.

Compare gasoline affordability across countries by relating retail pump prices to local income levels rather than relying on nominal fuel

Compare the countries with the highest food inflation in late 2025, with context on domestic price pressure, imports and global

Get Excel and CSV data packs used in published StatRanker research, with source and methodology notes where available.
Browse Data Packs →Publisher details: site managed since 28 August 2025; private entrepreneur, registration code 133276738020, Ukraine. Technical infrastructure is located in the United States; CDN edge locations may be used internationally.