

Top 100 Jurisdictions with the Lowest VAT/GST and
Compare 100 jurisdictions with the lowest VAT, GST or sales-tax rates in 2026 using PwC, EY, OECD and EU tax

Compare 100 jurisdictions with the lowest VAT, GST or sales-tax rates in 2026 using PwC, EY, OECD and EU tax

Compare agricultural insurance penetration across 10 major markets using the World Bank 2007 benchmark, measured as premiums relative to agricultural

A 2026 data availability audit on education inclusion for children with disabilities, covering UNICEF, World Bank, UNESCO and policy sources.

Compare countries by the World Economic Forum railroad infrastructure quality score on a 1–7 scale using the last globally comparable

Compare countries by the World Economic Forum port infrastructure quality score using the 2019 globally comparable Executive Opinion Survey baseline.

Compare countries by the World Economic Forum Quality of Roads score on a 1–7 scale using the latest globally comparable

Ranking of countries with the largest reductions in estimated TB incidence from 2015 to 2024, with both yearly rates and
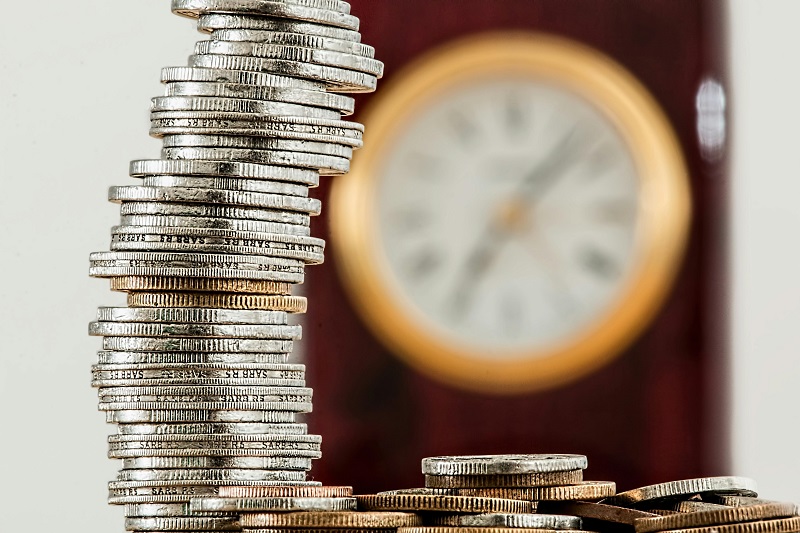
Compare countries by total tax revenue as a share of GDP using the latest OECD observations, with definitions, reference years
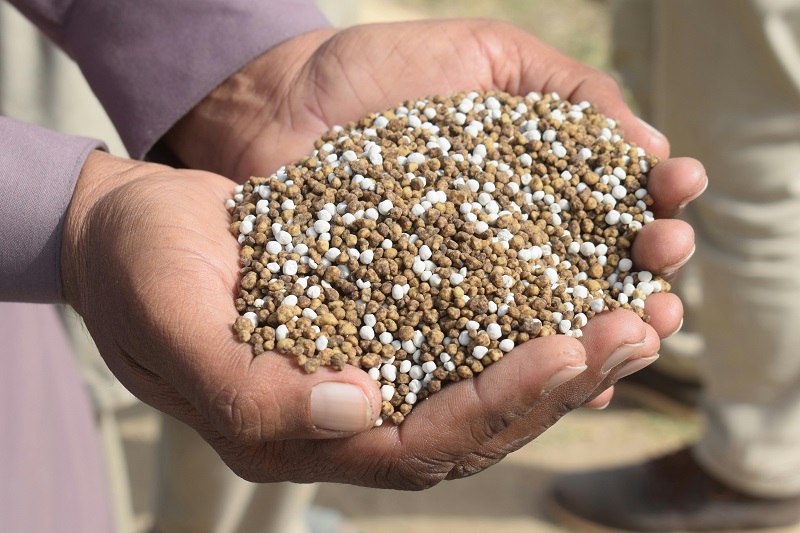
Compare marginal maize yield response to nitrogen across 10 African research domains using MPP at 50 kg N/ha and published

Compare the top date-producing countries using official FAOSTAT 2024 production data, led by Saudi Arabia, Egypt, Algeria and Iran.

Compare the leading cherry-producing countries using the USDA FAS 2025/26 marketing-year forecast for fresh sweet and sour cherries.

Compare major two-wheeler production hubs in 2025 using country-reported production, shipments or wholesales, with scope notes for comparability.

Compare leading bus-producing countries in the 2025 snapshot, with context on transit procurement, fleet renewal, regulation and electrification.

Compare major heavy-truck manufacturing countries using the most comparable 2025 year-to-date production data, with scope, sources and industry context.
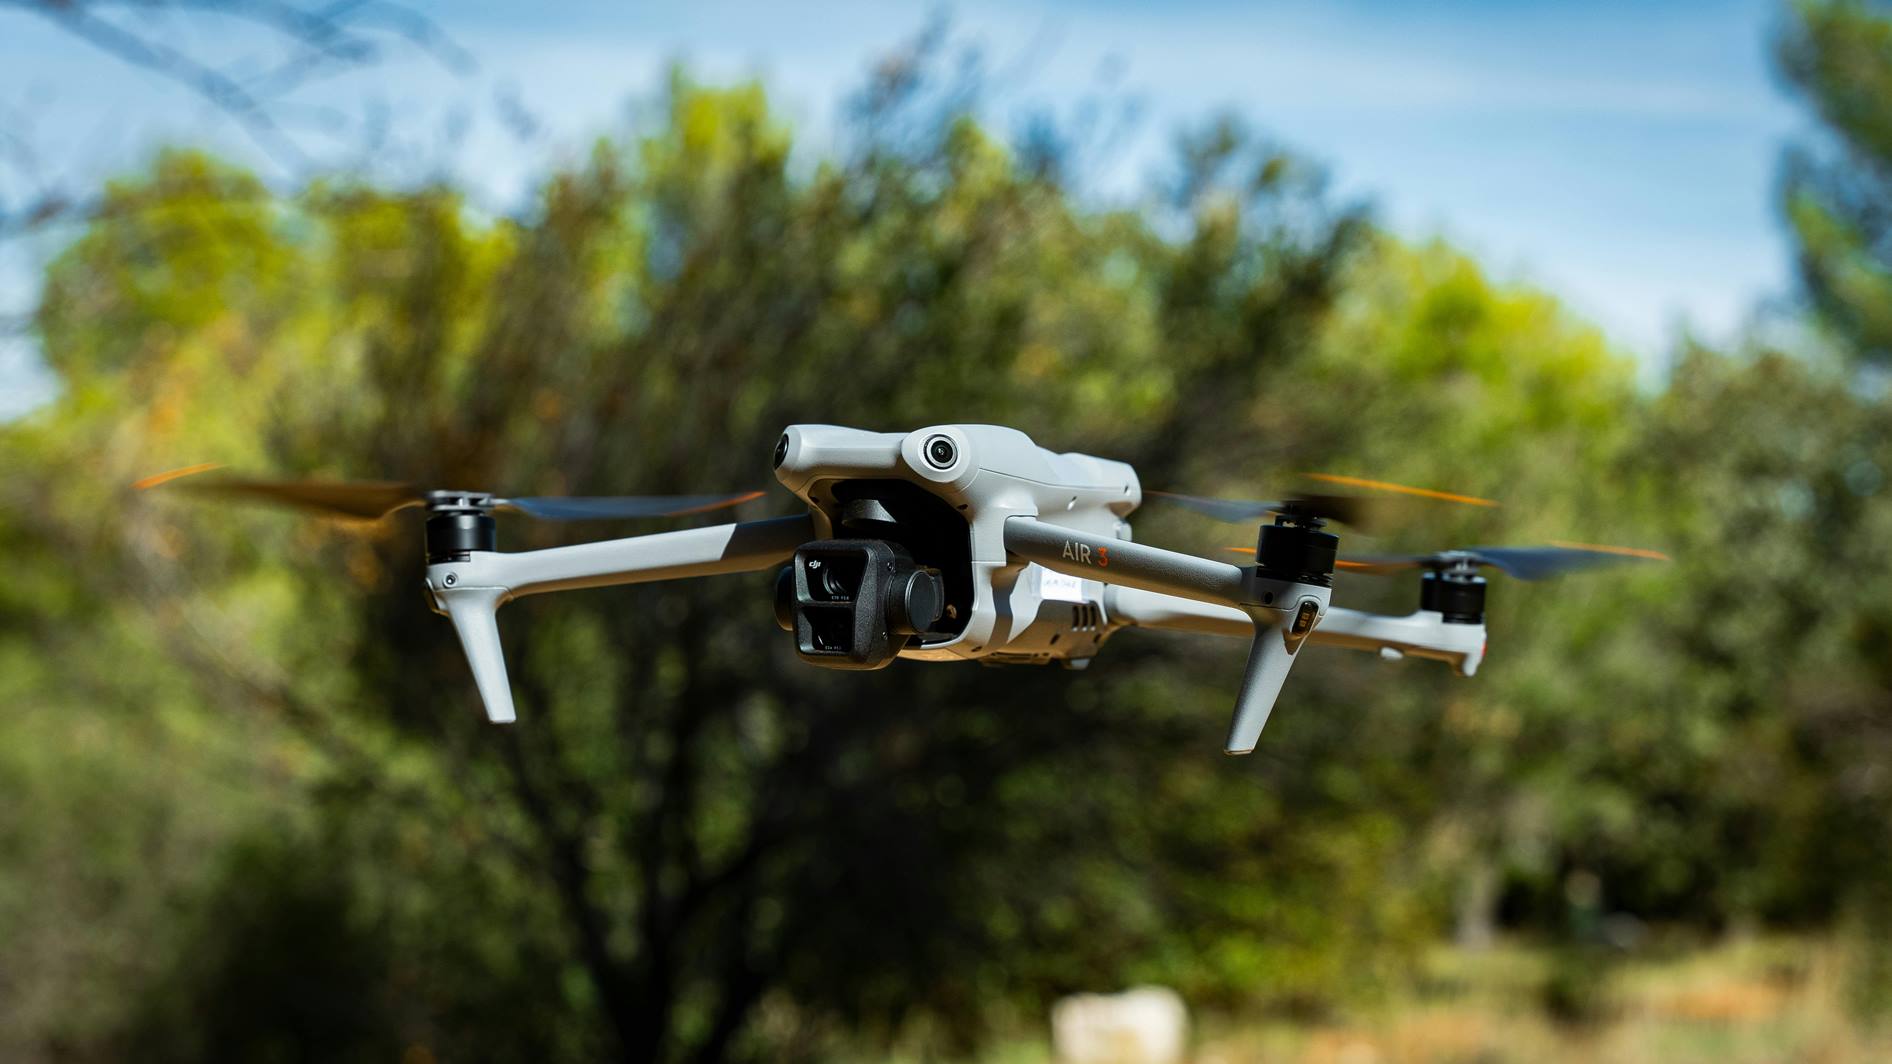
Compare leading drone-exporting countries in a 2026 snapshot using HS 8806 unmanned-aircraft trade data, with methodology and source notes.

Compare major EV manufacturing countries in 2025 by factory scale, battery capacity, supplier depth and export infrastructure; this legacy page

Compare leading 3D-printer manufacturing countries in 2025 across hardware volume, supply-chain depth and higher-value industrial systems.

Compare countries with large waste-to-energy systems using the latest reported data as a proxy for the 2025 snapshot, covering power

Compare countries by electricity generated from coal, gas and oil using 2024 full-year data as the transparent baseline for the
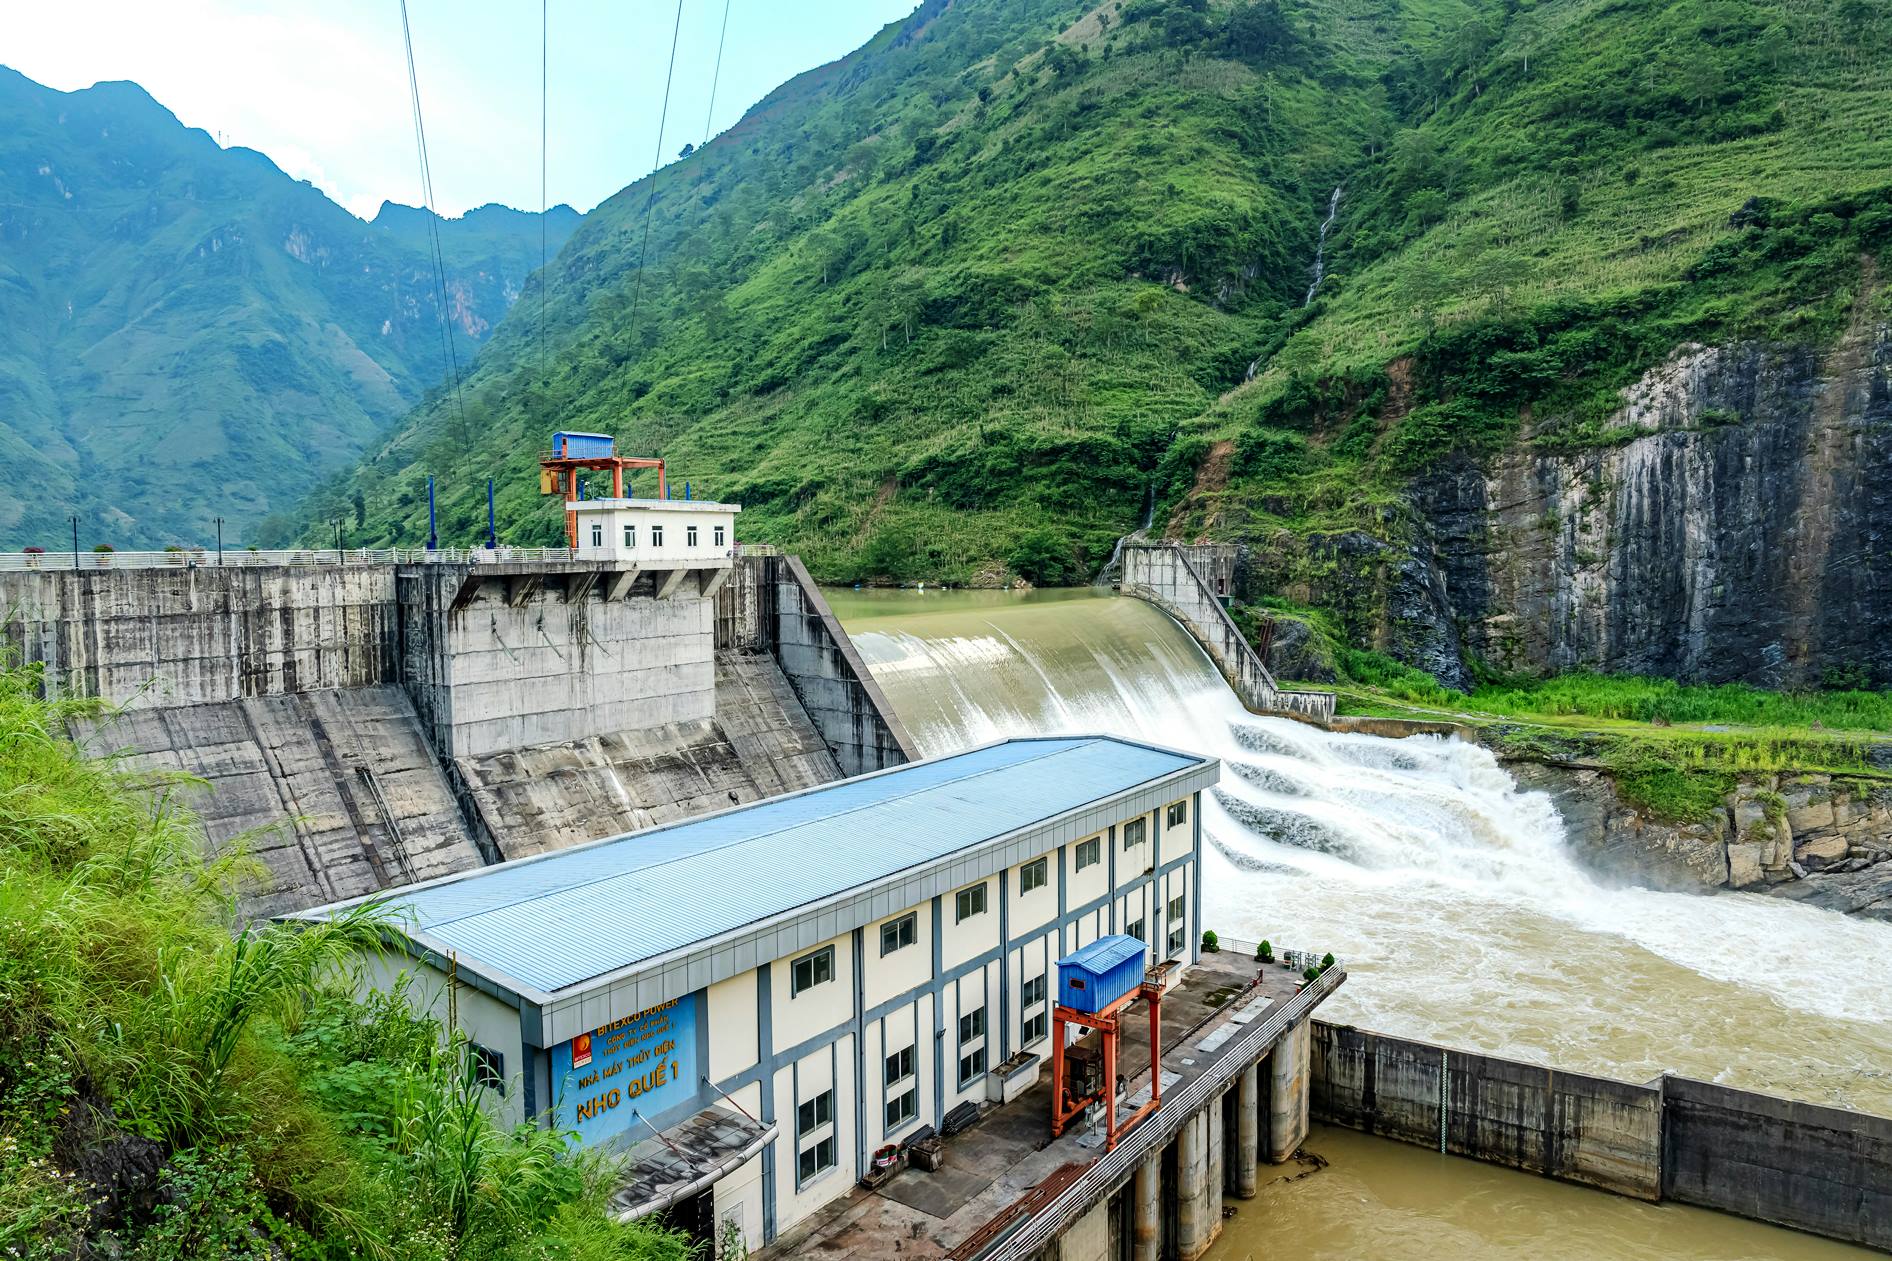
Compare leading hydropower-producing countries using the latest broadly harmonized full-year totals, mostly 2023 generation, as a 2025 snapshot proxy.

Compare the leading natural graphite mine producers using USGS 2025 estimates, with China’s dominant output and other major producers ranked
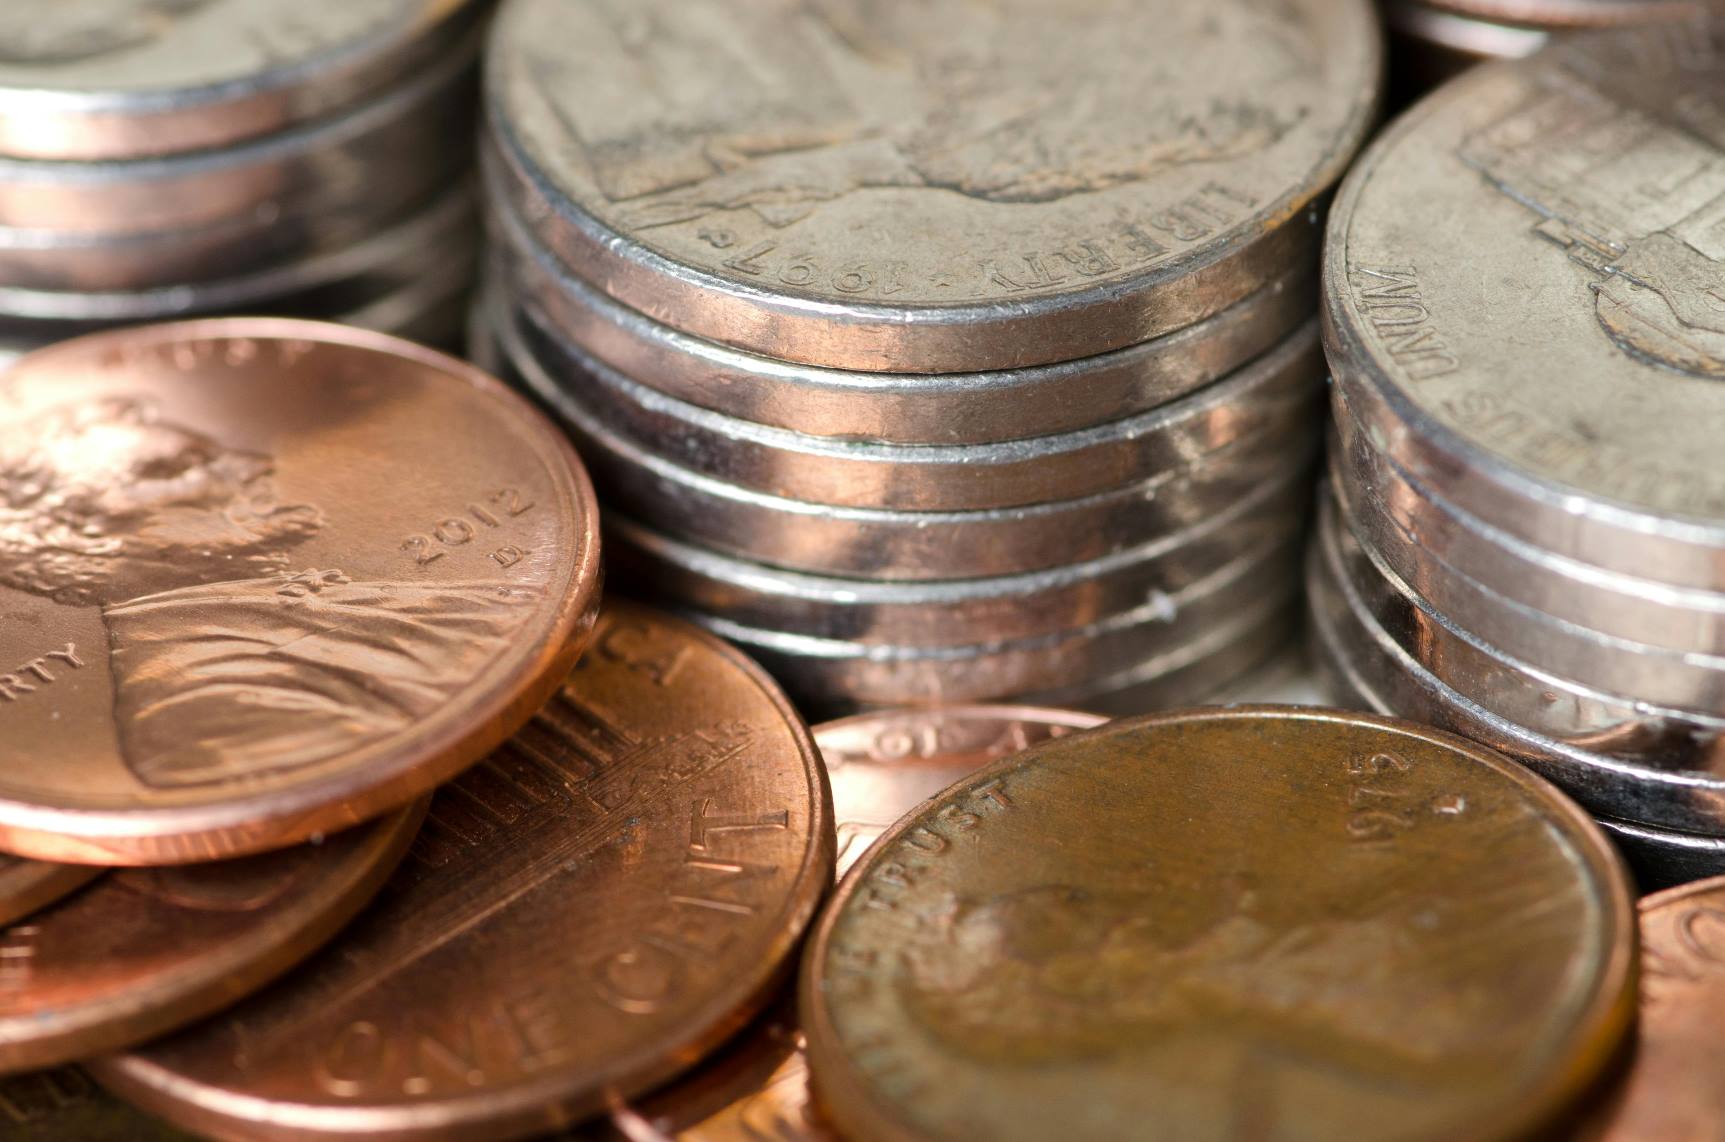
Compare major nickel mine producers in the legacy 2025 estimate ranking; this page remains noindex while the newer verified nickel

Compare leading primary magnesium producers using USGS 2024 smelter-output estimates as the closest transparent proxy for the 2025 ranking.

Compare major sand-producing countries in the 2025 snapshot, with context on construction aggregates, silica sand, industrial demand and sustainability.

Compare countries by tight-oil and shale-oil production in the 2025 snapshot, with scope notes for non-standardized national reporting.
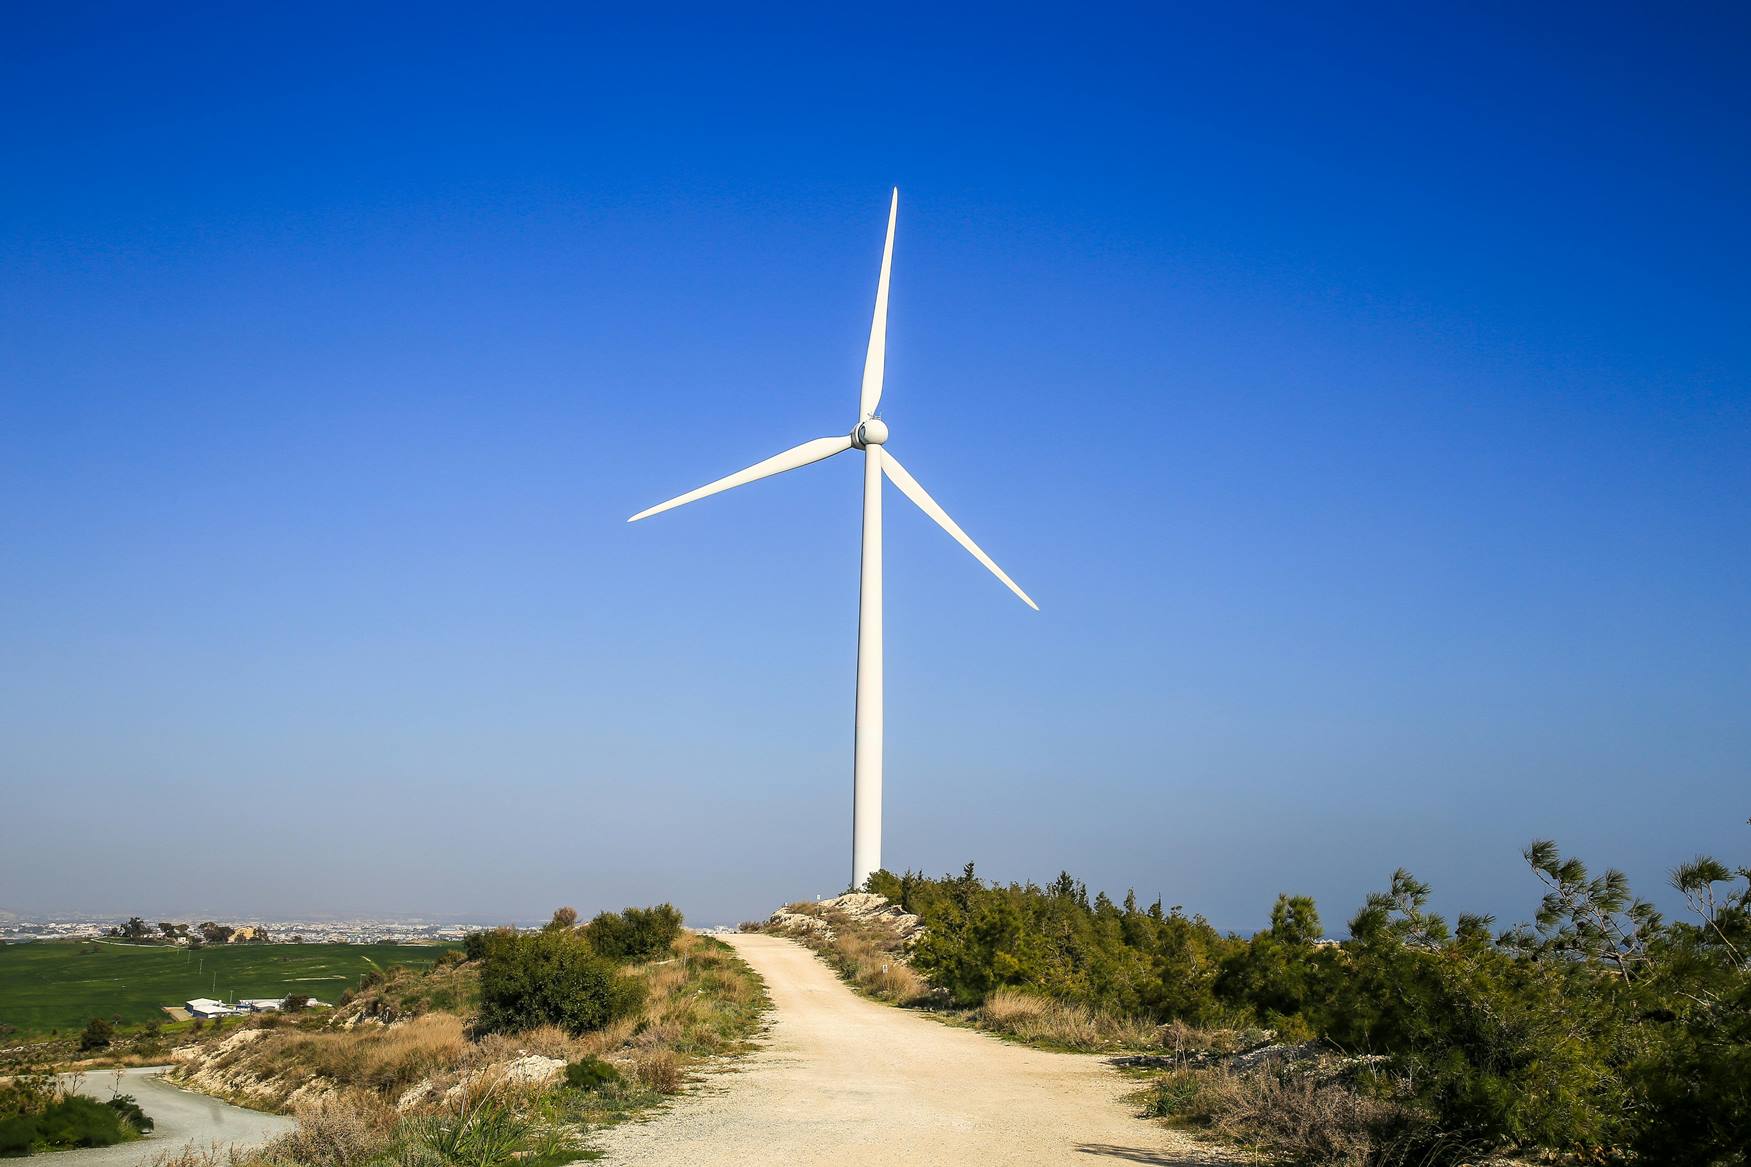
Compare leading turbine-manufacturing countries across wind, gas, steam, hydro and nuclear segments, with industrial supply-chain context.
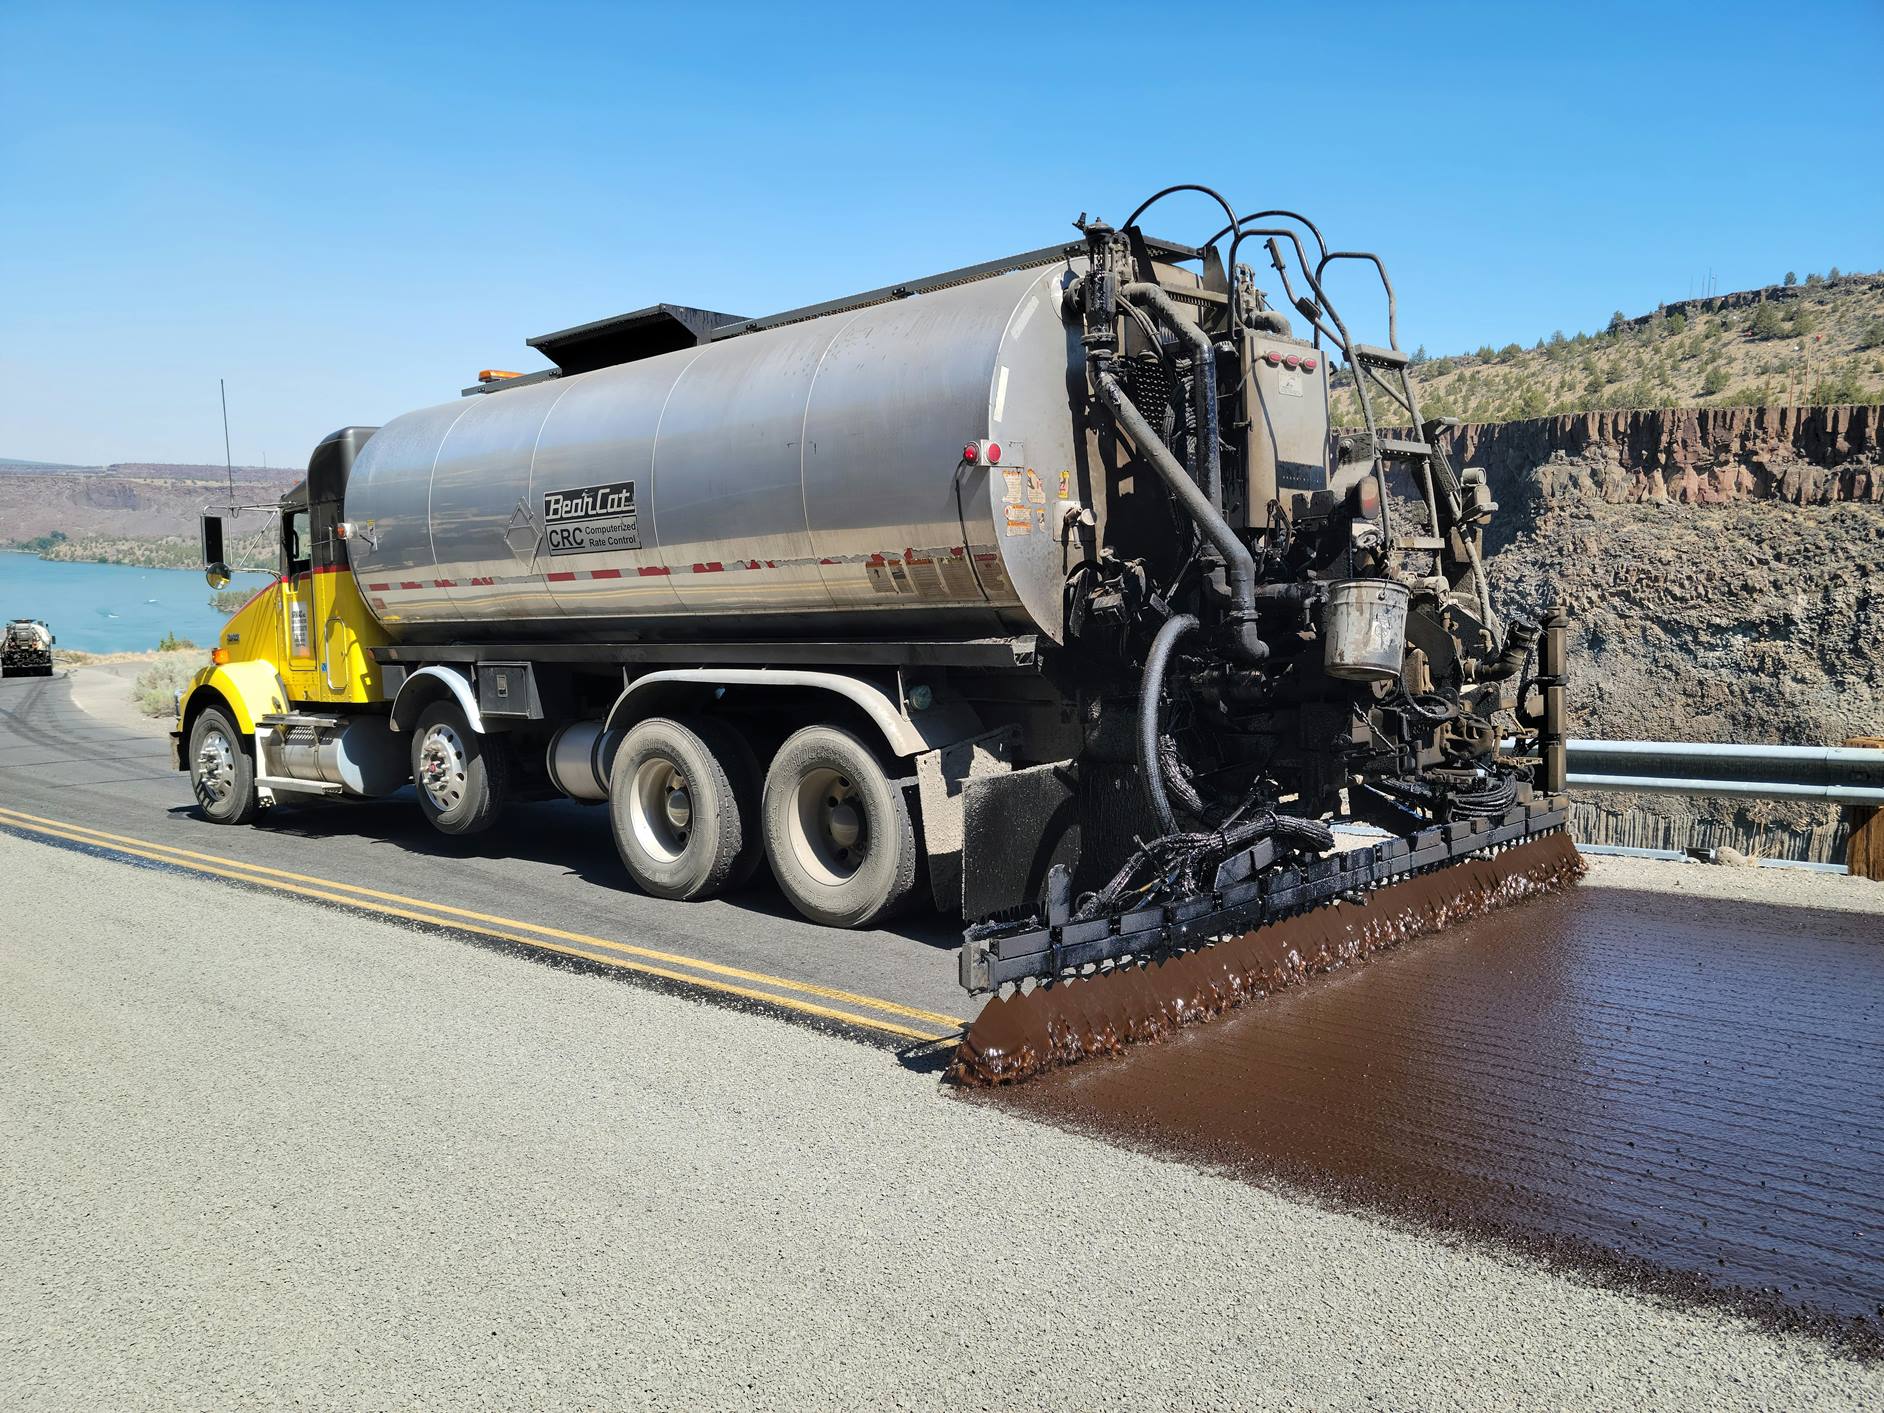
This legacy ranking uses harmonized 2025 bitumen production estimates rather than a single official country dataset and remains noindex pending

Get Excel and CSV data packs used in published StatRanker research, with source and methodology notes where available.
Browse Data Packs →Publisher details: site managed since 28 August 2025; private entrepreneur, registration code 133276738020, Ukraine. Technical infrastructure is located in the United States; CDN edge locations may be used internationally.