

TOP 10 Countries with Lowest Inflation (2025)
Compare countries with the lowest projected end-2025 CPI inflation using the October 2025 IMF baseline, with policy and exchange-rate context.

Compare countries with the lowest projected end-2025 CPI inflation using the October 2025 IMF baseline, with policy and exchange-rate context.

Compare the largest trade surpluses in 2025 using net exports of goods and services, with external-balance context, sources and methodology

Compare countries by trade openness in a 2026 scenario snapshot using official 2024 World Bank data plus transparent modeled assumptions.

Compare the world’s top 20 high-technology exporters across semiconductors, pharmaceuticals, aerospace, computers and scientific instruments.

Ranking of 34 OECD countries where real hourly wages rose faster than inflation in Q1 2025, led by Slovenia, using
Compare countries by real disposable household income per person in PPP terms after taxes, transfers and inflation, with methodology notes.

Compare economies by GDP produced per hour worked using PPP-adjusted labour productivity, with 2025 estimates and methodology notes.
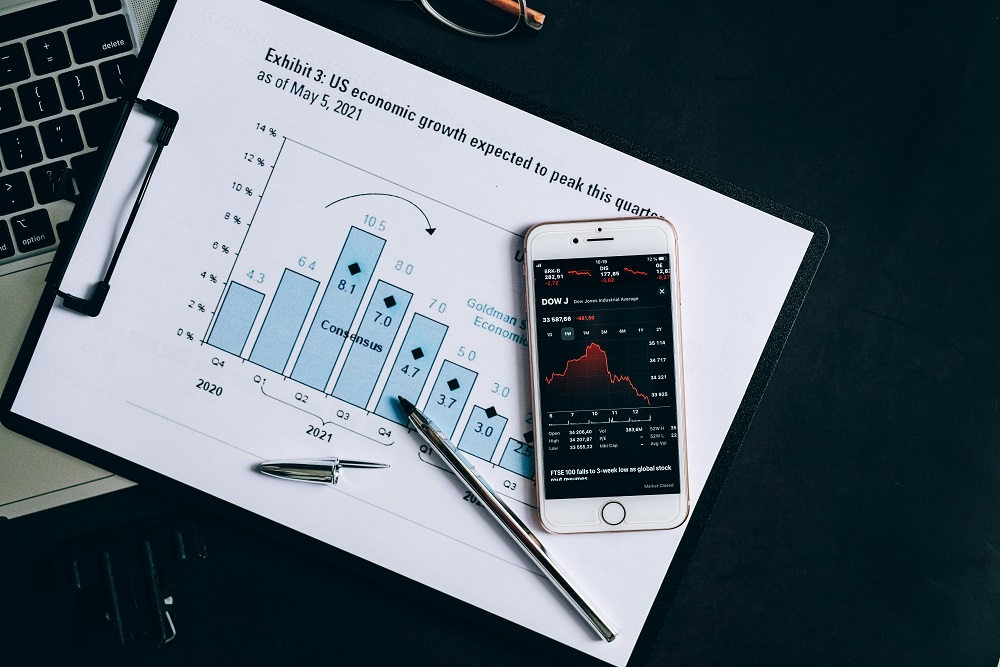
Compare 20 countries by real GDP per capita growth in 2025 using one disclosed IMF World Economic Outlook vintage, with

Compare economies where labour-cost growth is running ahead of productivity using year-over-year unit labour cost growth in Q4 2024.

Rank the 20 highest-paying U.S. occupations in a 2026 snapshot using official BLS May 2025 annual mean wage data and

Compare countries with the lowest income inequality using Gini coefficients, where lower values indicate a more equal distribution of income.

Compare the top 10 European statutory minimum wages using Eurostat’s July 2025 official gross monthly minimum-wage data.

Rank countries by female ownership participation in formal firms using World Bank 2024 data, with methodology, limits and sources.

See which U.S. industries had the highest startup survival rates after one, three and five years, based on official BLS

Top 50 countries and economies by exports of goods and services using latest World Bank WDI values: 47 rows from

Miami led housing permit growth among the Census Bureau’s 20 highest-activity U.S. metro CBSAs in 2025. Compare the Top 10

Compare leading shipyards and shipbuilding countries by LNG carrier and container-ship order books in the 2024–2025 cycle, with industry context.

Compare countries by robot density in a 2026 snapshot using IFR 2024 data, with automation intensity, regional benchmarks and leader

Compare countries by announced lithium-ion battery cell manufacturing capacity for 2030 using the Benchmark Mineral Intelligence July 2024 snapshot.

Compare 20 countries by PPP-adjusted output per employed person, a cross-country labor productivity measure with source notes and methodology.
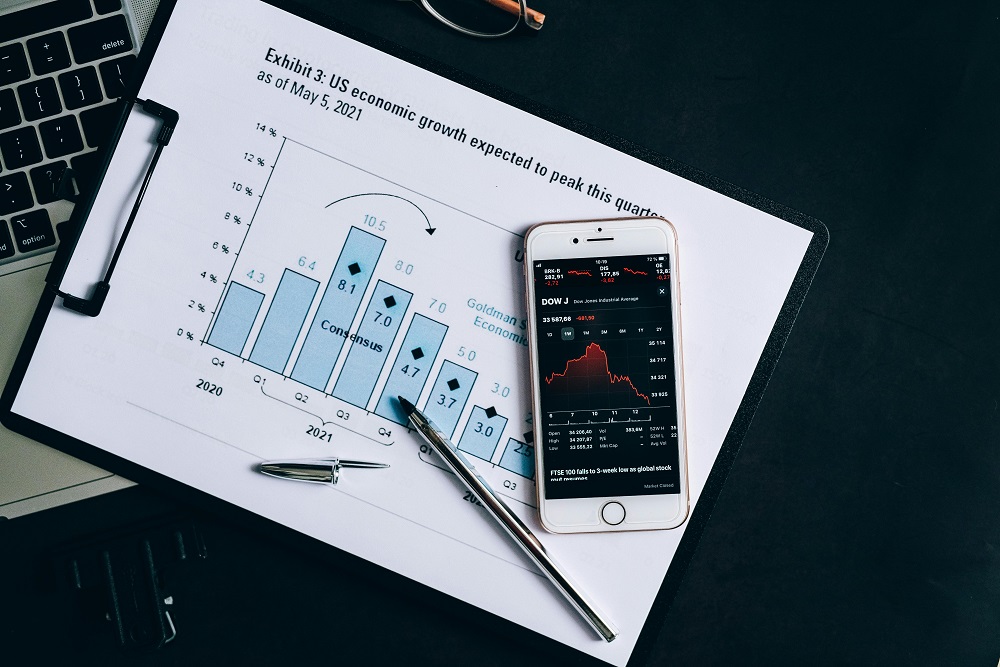
Compare the highest GDP per capita PPP economies and see why small specialized hubs dominate the top of purchasing-power-adjusted rankings.

Ranking of countries where food inflation exceeded headline CPI most sharply in September 2025, measured as the percentage-point gap between
Compare verified WITS entries by export market concentration using the Herfindahl-Hirschman Index, where higher values mean greater destination concentration.
Understand the network of top trading partners for the world’s largest economies, including methodology, trade-flow structure and bilateral link context.

Rank cities by metro and LRT expansion scheduled for 2026, including metro, tram, light rail, monorail and planned route kilometers.

Review 10 major projects in the 2025–2030 execution window selected from official government, operator and program materials with visible milestones.

Compare countries by government interest payments as a share of public revenue, showing where debt-service costs absorb the largest fiscal

Get Excel and CSV data packs used in published StatRanker research, with source and methodology notes where available.
Browse Data Packs →Publisher details: site managed since 28 August 2025; private entrepreneur, registration code 133276738020, Ukraine. Technical infrastructure is located in the United States; CDN edge locations may be used internationally.