

Countries and Economies by Trade Openness 2026 Scenario Snapshot
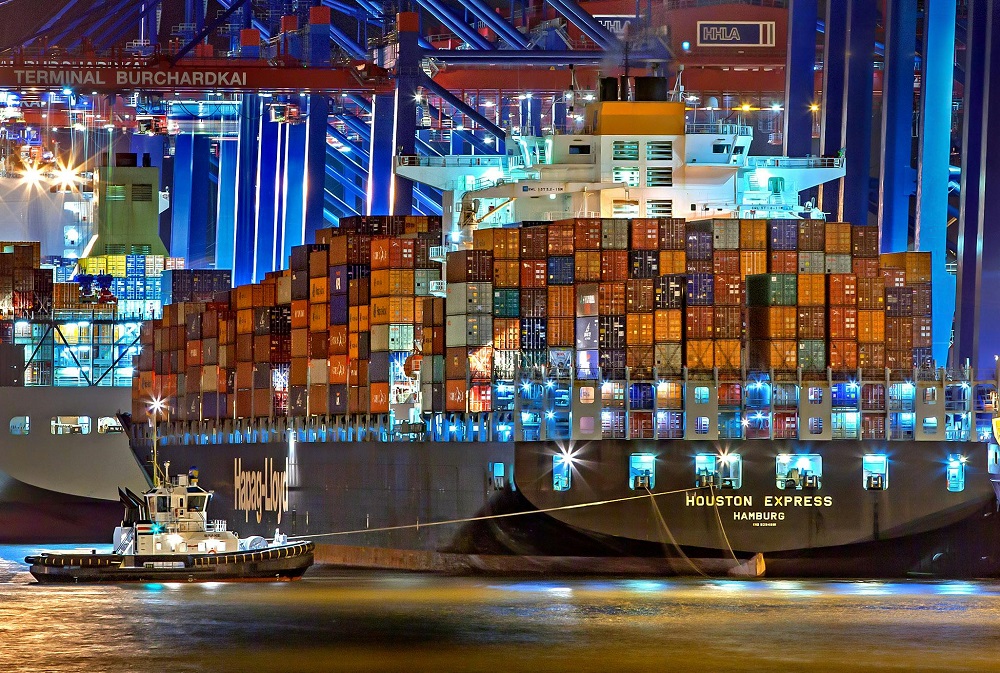
Trade-to-GDP Ratio Ranking Based on Latest Official Data
Trade openness measures exports plus imports of goods and services as a percentage of GDP. A higher value means that cross-border trade flows are large relative to the size of the domestic economy. This ranking covers countries and economies with confirmed 2024 values from the World Bank World Development Indicators series “Trade (% of GDP)”, code NE.TRD.GNFS.ZS.
The 2024 column is the official numeric base. The 2025 and 2026 columns are non-cumulative modeled scenarios applied to the same 2024 base, not official country forecasts. The purpose is to show a current 2026 analytical snapshot while keeping the underlying country ranking anchored to the latest confirmed official World Bank values.
The table is a compiled research dataset using World Bank as the numeric source, IMF World Economic Outlook April 2026 as the macro projection source, and UNCTAD Global Trade Update 2026 as trade-context evidence. Rank direction is descending: higher trade-to-GDP ratios rank higher.
Key Findings from the 2026 Scenario Snapshot
2024 official value: 359.5% of GDP; 2026 non-cumulative scenario: 364.9%.
Serbia closes this confirmed 42-entry table at 111.7% official in 2024 and 113.4% in the 2026 scenario.
The table includes confirmed entries available from the provided research table and keeps the title aligned with the verified coverage.
Exports plus imports of goods and services divided by GDP; higher values rank higher.
Numeric ranking source: official World Bank 2024 values. Scenario columns are modeled and non-official.
Calculated from the 42 official 2024 rows: midpoint of Mauritius and Cambodia.
What This Metric Means
How to read it
A value of 150% means that gross exports plus gross imports equal 1.5 times GDP. It does not mean that trade creates 150% of domestic value added; it measures the scale of trade flows relative to the economy.
Why values exceed 100%
Small hubs, re-export centres, island economies and logistics platforms can record values above 100% because goods and services cross borders at very high volume relative to domestic GDP.
Why countries differ
Trade openness depends on market size, geography, supply-chain position, ports, services exports, import dependence, natural resources, re-export activity and the size of the domestic demand base.
Main limitation
The indicator is not a score for trade policy quality, competitiveness, living standards or export sophistication. A very high ratio can indicate openness, but also exposure to external shocks.
Top 10 Countries and Economies by Trade Openness
The top of the ranking is dominated by trade hubs and small open economies. Hong Kong SAR, Luxembourg and Singapore all exceed 300% in the 2026 scenario because their gross cross-border trade flows are exceptionally large relative to domestic GDP.
| Rank | Economy | 2024 official | 2025 scenario | 2026 scenario |
|---|---|---|---|---|
| 1 | Hong Kong SAR, ChinaEast Asia & Pacific · WB 2024 base; IMF/UNCTAD scenario context. | 359.5% | 366.0% | 364.9% |
| 2 | LuxembourgEurope & Central Asia · WB 2024 base; IMF/UNCTAD scenario context. | 351.3% | 357.6% | 356.6% |
| 3 | SingaporeEast Asia & Pacific · WB 2024 base; IMF/UNCTAD scenario context. | 322.4% | 328.2% | 327.2% |
| 4 | IrelandEurope & Central Asia · WB 2024 base; IMF/UNCTAD scenario context. | 246.2% | 250.6% | 249.9% |
| 5 | DjiboutiMiddle East & North Africa · WB 2024 base; IMF/UNCTAD scenario context. | 241.2% | 245.5% | 244.8% |
| 6 | MaltaEurope & Central Asia · WB 2024 base; IMF/UNCTAD scenario context. | 218.2% | 222.1% | 221.5% |
| 7 | CyprusEurope & Central Asia · WB 2024 base; IMF/UNCTAD scenario context. | 190.4% | 193.8% | 193.3% |
| 8 | SeychellesSub-Saharan Africa · WB 2024 base; IMF/UNCTAD scenario context. | 188.4% | 191.8% | 191.2% |
| 9 | Viet NamEast Asia & Pacific · WB 2024 base; IMF/UNCTAD scenario context. | 173.9% | 177.0% | 176.5% |
| 10 | Slovak RepublicEurope & Central Asia · WB 2024 base; IMF/UNCTAD scenario context. | 171.2% | 174.3% | 173.8% |
Scenario values are rounded to one decimal place. They are not official national forecasts.
Chart: Top 20 by 2026 Trade-Openness Scenario
The first twenty entries show how concentrated very high trade-to-GDP ratios are among small economies, ports, financial hubs and manufacturing platforms. The gap between the first three and the rest of the table is large.
Methodology
The metric is trade openness: exports plus imports of goods and services divided by GDP, expressed as a percentage. The numeric ranking uses the World Bank World Development Indicators series “Trade (% of GDP)”, code NE.TRD.GNFS.ZS. The base year is 2024 because it is the latest official year used in the underlying table.
The 2025 and 2026 columns are non-cumulative scenario columns. They are calculated from the 2024 official base using two separate global factors rather than a country-specific forecast path. The formula is: 2025 scenario = 2024 official value × 1.018; 2026 scenario = 2024 official value × 1.015. This keeps the scenario transparent and avoids pretending that unreleased country-level 2026 trade-openness values are official.
Numeric source
World Bank WDI NE.TRD.GNFS.ZS supplies the official 2024 trade-to-GDP values used to rank countries and economies.
Projection assumption
IMF World Economic Outlook April 2026 provides the macro context for world output and trade-volume momentum used to justify a cautious global scenario factor.
Trade context
UNCTAD Global Trade Update 2026 is used as context for uncertainty, tariffs, supply-chain risk and weaker trade momentum.
Rounding and limits
Values are rounded to one decimal place. The metric does not measure trade quality, tariffs, value added, diversification, current-account balance or resilience.
Source hierarchy is: official World Bank numeric value first; IMF global macro assumptions second; UNCTAD trade-context evidence third. Missing values are not estimated. Conflicts are not averaged. The table should be read as a transparent 2026 scenario snapshot based on official 2024 data, not as an official 2026 statistical release.
Main Ranking Table: Countries and Economies by Trade Openness
Use the controls to search by economy, filter by World Bank region and change the visible subset. The ranking remains anchored to the official 2024 World Bank value, while the 2026 scenario column is used for the displayed order.
| Rank | Economy | 2024 official | 2025 scenario | 2026 scenario |
|---|---|---|---|---|
| 1 | Hong Kong SAR, ChinaEast Asia & Pacific · WB 2024 base; scenario from 2024. | 359.5% | 366.0% | 364.9% |
| 2 | LuxembourgEurope & Central Asia · WB 2024 base; scenario from 2024. | 351.3% | 357.6% | 356.6% |
| 3 | SingaporeEast Asia & Pacific · WB 2024 base; scenario from 2024. | 322.4% | 328.2% | 327.2% |
| 4 | IrelandEurope & Central Asia · WB 2024 base; scenario from 2024. | 246.2% | 250.6% | 249.9% |
| 5 | DjiboutiMiddle East & North Africa · WB 2024 base; scenario from 2024. | 241.2% | 245.5% | 244.8% |
| 6 | MaltaEurope & Central Asia · WB 2024 base; scenario from 2024. | 218.2% | 222.1% | 221.5% |
| 7 | CyprusEurope & Central Asia · WB 2024 base; scenario from 2024. | 190.4% | 193.8% | 193.3% |
| 8 | SeychellesSub-Saharan Africa · WB 2024 base; scenario from 2024. | 188.4% | 191.8% | 191.2% |
| 9 | Viet NamEast Asia & Pacific · WB 2024 base; scenario from 2024. | 173.9% | 177.0% | 176.5% |
| 10 | Slovak RepublicEurope & Central Asia · WB 2024 base; scenario from 2024. | 171.2% | 174.3% | 173.8% |
| 11 | NauruEast Asia & Pacific · WB 2024 base; scenario from 2024. | 165.8% | 168.8% | 168.3% |
| 12 | ArubaLatin America & Caribbean · WB 2024 base; scenario from 2024. | 160.4% | 163.3% | 162.8% |
| 13 | BelgiumEurope & Central Asia · WB 2024 base; scenario from 2024. | 158.9% | 161.8% | 161.3% |
| 14 | BahrainMiddle East & North Africa · WB 2024 base; scenario from 2024. | 157.8% | 160.6% | 160.2% |
| 15 | MaldivesSouth Asia · WB 2024 base; scenario from 2024. | 156.5% | 159.3% | 158.8% |
| 16 | SloveniaEurope & Central Asia · WB 2024 base; scenario from 2024. | 155.7% | 158.5% | 158.0% |
| 17 | NetherlandsEurope & Central Asia · WB 2024 base; scenario from 2024. | 153.8% | 156.6% | 156.1% |
| 18 | EstoniaEurope & Central Asia · WB 2024 base; scenario from 2024. | 151.0% | 153.7% | 153.3% |
| 19 | ArmeniaEurope & Central Asia · WB 2024 base; scenario from 2024. | 150.1% | 152.8% | 152.4% |
| 20 | HungaryEurope & Central Asia · WB 2024 base; scenario from 2024. | 146.5% | 149.1% | 148.7% |
| 21 | MauritiusSub-Saharan Africa · WB 2024 base; scenario from 2024. | 145.4% | 148.0% | 147.6% |
| 22 | CambodiaEast Asia & Pacific · WB 2024 base; scenario from 2024. | 143.4% | 146.0% | 145.6% |
| 23 | LithuaniaEurope & Central Asia · WB 2024 base; scenario from 2024. | 143.0% | 145.6% | 145.1% |
| 24 | Macao SAR, ChinaEast Asia & Pacific · WB 2024 base; scenario from 2024. | 142.1% | 144.7% | 144.2% |
| 25 | MongoliaEast Asia & Pacific · WB 2024 base; scenario from 2024. | 138.4% | 140.9% | 140.5% |
| 26 | MalaysiaEast Asia & Pacific · WB 2024 base; scenario from 2024. | 137.4% | 139.9% | 139.5% |
| 27 | ThailandEast Asia & Pacific · WB 2024 base; scenario from 2024. | 136.7% | 139.2% | 138.8% |
| 28 | North MacedoniaEurope & Central Asia · WB 2024 base; scenario from 2024. | 136.3% | 138.8% | 138.3% |
| 29 | SwitzerlandEurope & Central Asia · WB 2024 base; scenario from 2024. | 134.1% | 136.5% | 136.1% |
| 30 | Brunei DarussalamEast Asia & Pacific · WB 2024 base; scenario from 2024. | 132.6% | 135.0% | 134.6% |
| 31 | LatviaEurope & Central Asia · WB 2024 base; scenario from 2024. | 132.3% | 134.7% | 134.3% |
| 32 | BelarusEurope & Central Asia · WB 2024 base; scenario from 2024. | 131.9% | 134.3% | 133.9% |
| 33 | DenmarkEurope & Central Asia · WB 2024 base; scenario from 2024. | 131.8% | 134.2% | 133.8% |
| 34 | CzechiaEurope & Central Asia · WB 2024 base; scenario from 2024. | 131.5% | 133.9% | 133.5% |
| 35 | Somalia, Fed. Rep.Sub-Saharan Africa · WB 2024 base; scenario from 2024. | 130.3% | 132.6% | 132.3% |
| 36 | LibyaMiddle East & North Africa · WB 2024 base; scenario from 2024. | 128.8% | 131.1% | 130.7% |
| 37 | Kyrgyz RepublicEurope & Central Asia · WB 2024 base; scenario from 2024. | 127.7% | 130.0% | 129.6% |
| 38 | CubaLatin America & Caribbean · WB 2024 base; scenario from 2024. | 124.9% | 127.1% | 126.8% |
| 39 | Marshall IslandsEast Asia & Pacific · WB 2024 base; scenario from 2024. | 123.8% | 126.0% | 125.7% |
| 40 | OmanMiddle East & North Africa · WB 2024 base; scenario from 2024. | 114.9% | 117.0% | 116.6% |
| 41 | KosovoEurope & Central Asia · WB 2024 base; scenario from 2024. | 113.8% | 115.8% | 115.5% |
| 42 | SerbiaEurope & Central Asia · WB 2024 base; scenario from 2024. | 111.7% | 113.7% | 113.4% |
Table note: the rank is sorted by the 2026 scenario value, which preserves the same order as the 2024 official base because a common scenario factor is applied to each row.
Insights from the Ranking
The highest trade-openness values belong to economies where cross-border flows are structurally central to the business model: entrepôt trade, finance, logistics, multinational services and export-platform production.
Europe and Central Asia has the largest presence in this confirmed table, especially among small and mid-sized economies integrated into regional value chains.
Many top-ranked entries have small domestic markets. When GDP is relatively small and imports/exports are large, the trade-to-GDP ratio can rise far above 100%.
Hong Kong SAR, China stands out at 364.9% in the 2026 scenario, far above the median of 146.6% for this table’s scenario column.
What It Means
A high trade-openness ratio is useful for understanding exposure to global demand, imported inputs, logistics networks and cross-border services. It can point to deep global integration, but it can also signal vulnerability to tariffs, shipping disruptions, currency shocks and sudden changes in external demand.
Large economies often rank lower because their domestic markets are big enough to absorb much more production internally. A lower ratio does not automatically mean weak trade performance. It may simply reflect the size of the domestic economy relative to exports and imports.
For investors, policymakers and researchers, this indicator is best used as a starting point. It should be compared with export diversification, value-added trade, current-account balance, industrial structure, logistics quality and institutional resilience before drawing conclusions about economic strength.
FAQ
What is trade openness?
Trade openness is exports plus imports of goods and services divided by GDP, expressed as a percentage. It shows how large gross trade flows are compared with the size of the economy.
Why can trade openness be higher than 100%?
Because the indicator adds exports and imports as gross flows. Economies with large re-export activity, major ports, financial services or high import dependence can exceed 100% without trade being larger than domestic value added in a strict production sense.
Are the 2025 and 2026 values official?
No. The 2024 values are the official World Bank base. The 2025 and 2026 columns are transparent non-cumulative scenario calculations from the 2024 base.
Why not rank by absolute exports or imports?
Absolute trade volume favours very large economies. Trade openness answers a different question: how large trade flows are relative to GDP.
Does a higher value mean a better economy?
No. A higher value means greater trade intensity relative to GDP. It can reflect competitiveness and integration, but also dependence on external markets and imported inputs.
Why are small economies common near the top?
Small domestic markets often rely more heavily on imports and export-oriented sectors. This raises the trade-to-GDP ratio, especially when the economy acts as a logistics or services hub.
What does the metric not measure?
It does not measure trade policy quality, tariff levels, supply-chain resilience, value added, export sophistication, living standards or income distribution.
Sources
World Bank WDI — Numeric source
Primary source for the official 2024 country and economy values: Trade (% of GDP), NE.TRD.GNFS.ZS.
World Bank DataBank Metadata — Indicator definition
Definition source for the indicator: trade is the sum of exports and imports of goods and services expressed as a percentage of GDP.
IMF World Economic Outlook, April 2026 — Projection assumption
Used for global macro and trade-volume context behind the scenario factors.
UNCTAD Global Trade Update 2026 — Trade context
Used to frame trade uncertainty, tariff pressure, policy risk and weaker global trade momentum.
Final quality check applied: H2 differs from page H1, no status filter is used, sources are separated by role, row notes are shortened, mobile tables use stacked cards, and the ranking title does not claim Top 100 when the confirmed table contains 42 entries.
Related rankings
Closely related StatRanker pages selected by topic. If no strong match exists, fewer links are shown instead of unrelated recommendations.
